.NET Tools
Essential productivity kit for .NET and game developers
More debugger features in ReSharper
We have already announced that ReSharper 2017.3 brings the debugger into the editor. The latest EAP build improves performance of the debugger DataTip and provides new functionality. We can now navigate to breakpoints, as well as create breakpoints (and tracepoints) from the Find Results tool window. Let’s have a look!
Navigate to breakpoints
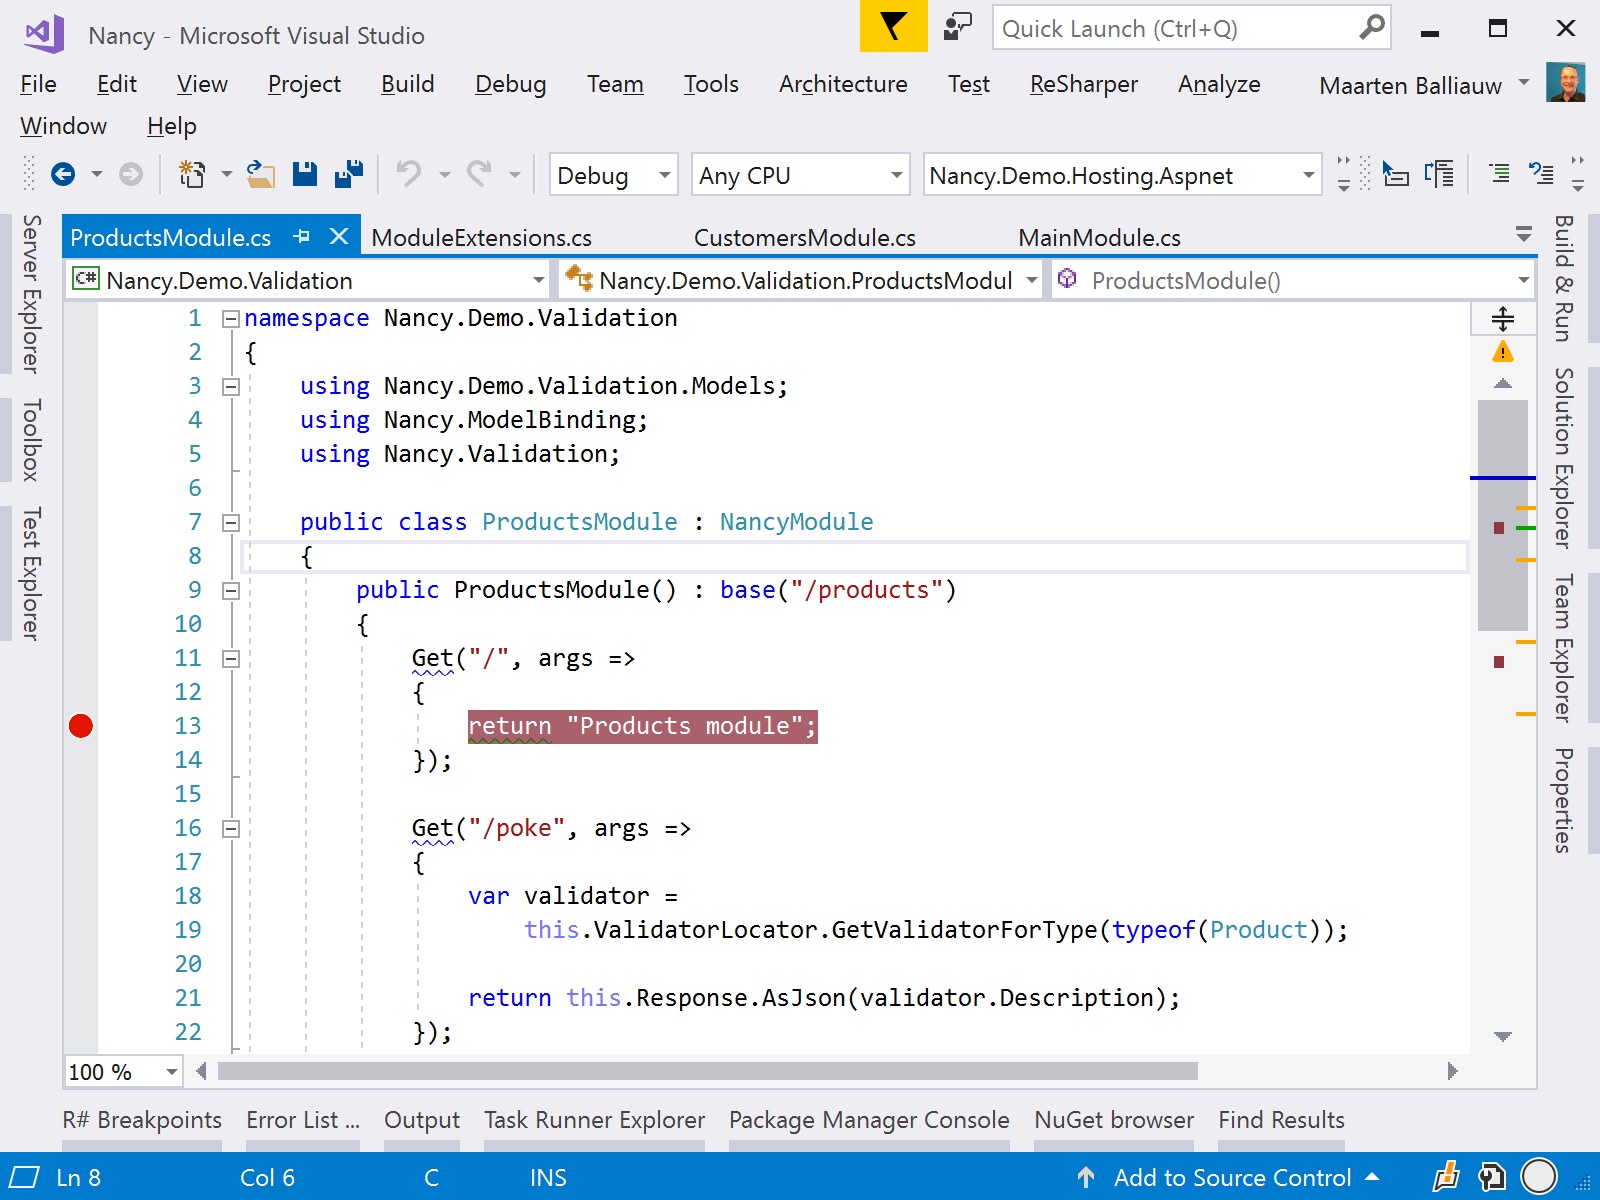
Very often, we have to quickly navigate between breakpoints in our solution. For example in an intensive debugging session, we may have to jump between several locations in our codebase that have a breakpoint defined.
Good news: the new new Go to Breakpoint action (Ctrl+Alt+F9) will show us different breakpoints in our solution. And just like almost every tool window in ReSharper, we can start typing to search for a breakpoint.

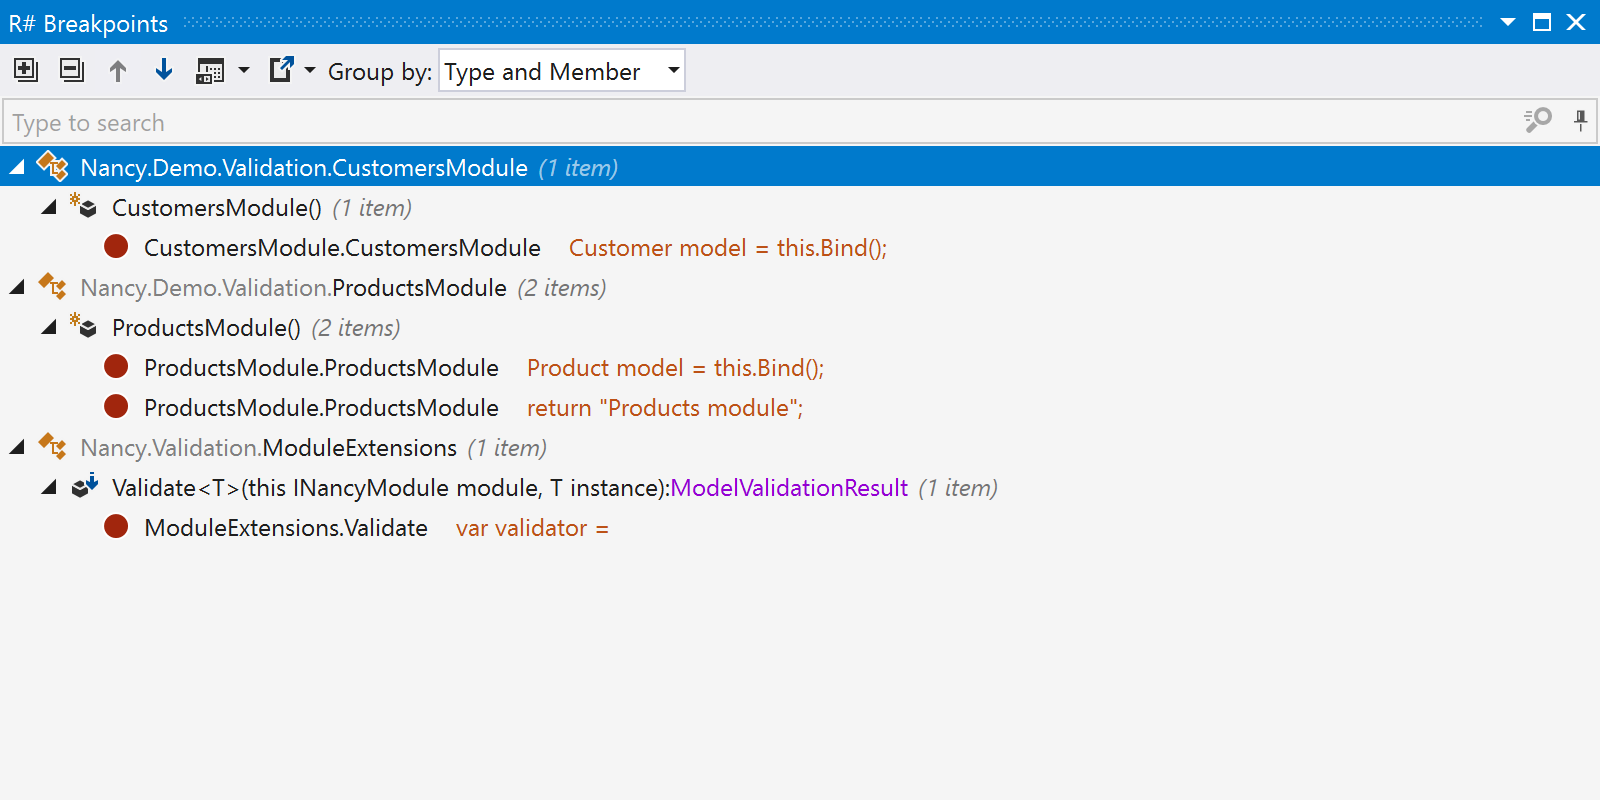
We can click the icon (or use Shift+Enter) to open breakpoints in the new R# Breakpoints tool window. From this tool window we can navigate between breakpoints (using mouse or keyboard), look at a preview of the breakpoint, group breakpoints, … We can also make use of the context menu to quickly enable/disable or remove breakpoints in our solution.

Create breakpoint/tracepoint from Find Results
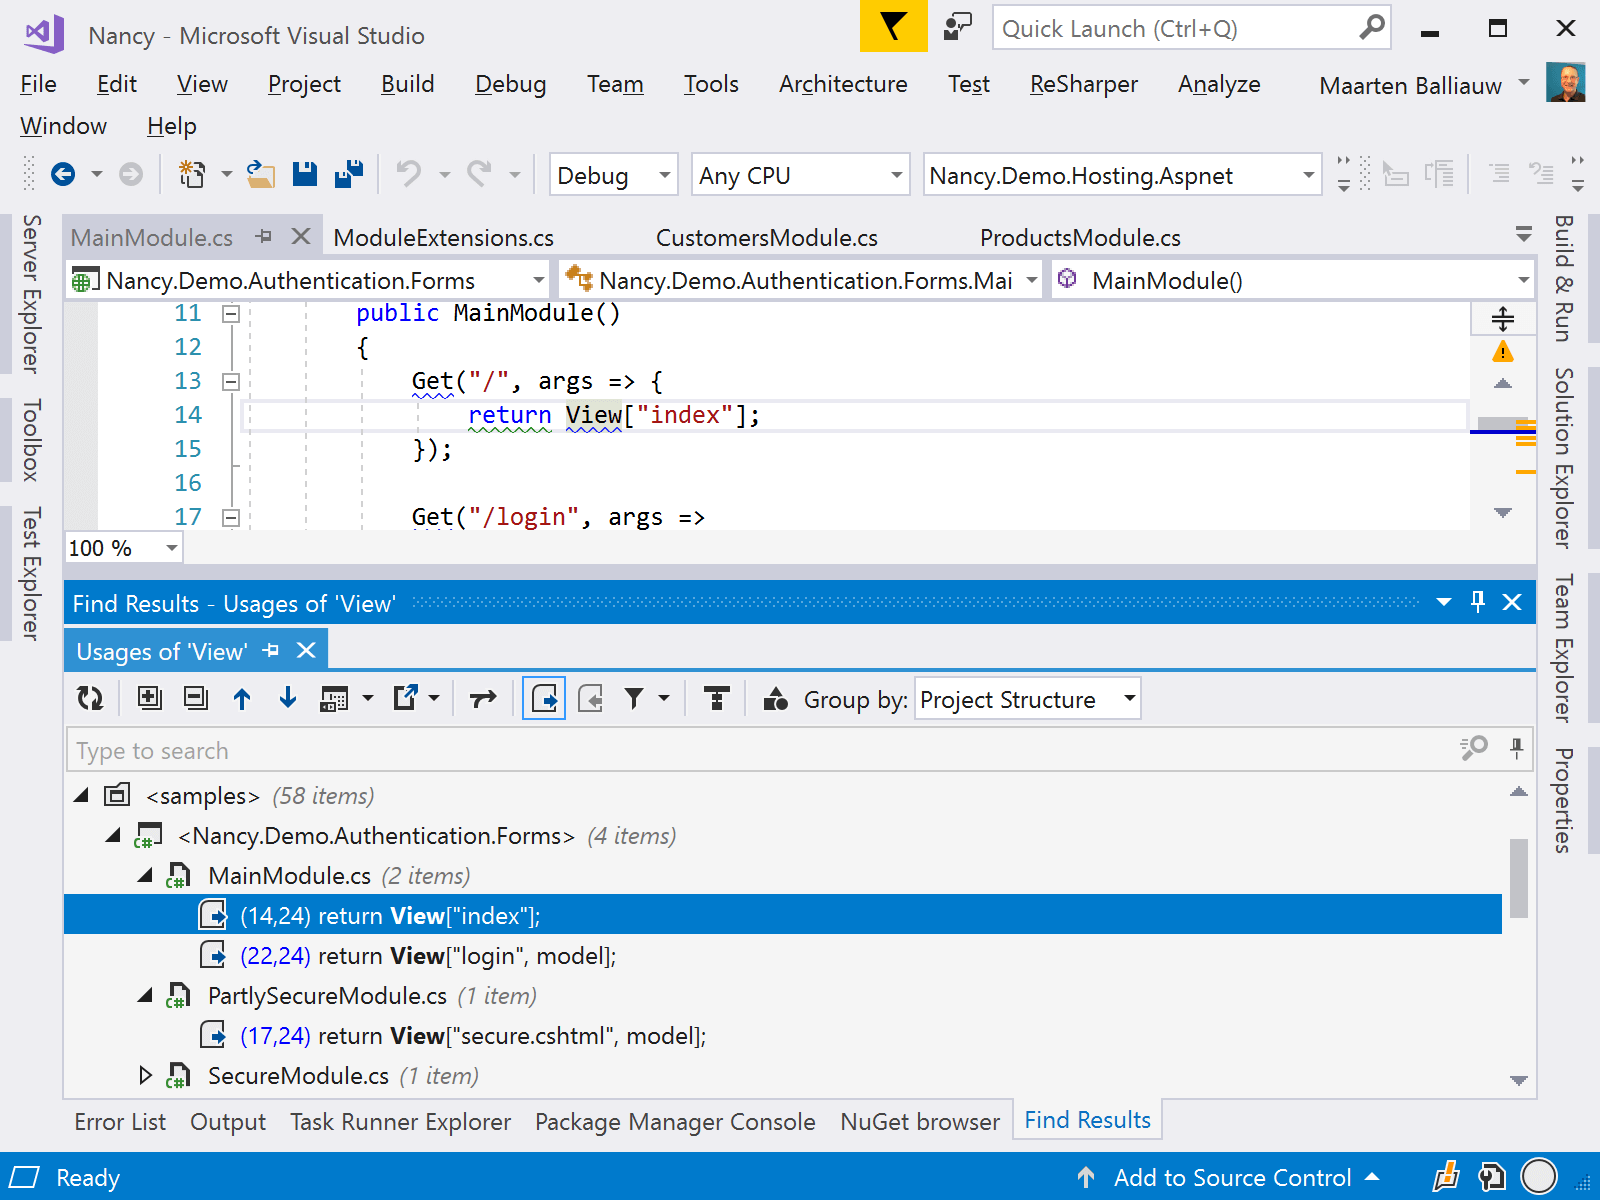
We typically have to open the editor and find the line of code where we want to set a breakpoint or tracepoint in our codebase. This latest ReSharper 2017.3 EAP adds the ability to create a breakpoint or tracepoint from the Find Results tool window.
When using Find Usages (Shift+F12) or another navigation like Go to Everything (Ctrl+T) or Go to Text (Ctrl+T,T,T), we can explore search results in the the Find Results tool window (Shift+Enter). The context menu allows us to set or remove a breakpoint, as well as create or remove a tracepoint.

Download ReSharper 2017.3 EAP and give it a try! We’d love to hear your feedback on the new ReSharper debugger tools!


