

.NET Tools
Essential productivity kit for .NET and game developers
Component composition, just-in-time-compilation, the UI thread – ReSharper performance series

In the previous post of our ReSharper performance series, we have seen that it makes a lot of sense to explore running it as a separate process. This brings many benefits: both Visual Studio and ReSharper would run in their own process, have their own thread pool, and their own memory space.
By itself, this is not the silver bullet that will fix performance, however. It is a big part, but there are additional areas that can be improved. In this post, we will look at improving startup of Visual Studio and ReSharper.
In this series:
- Introducing the ReSharper performance series
- Taking ReSharper out of process
- Component composition, just-in-time-compilation, the UI thread
- Performance improvements in ReSharper 2018.1 and 2018.1.1
Here we go!
Component composition
Visual Studio is essentially a combination of the Visual Studio Shell which provides common functionality and hosts modules defined in VSPackages, and a number of those VSPackages that provide C# editing, web tools, Azure tools, a WPF designer, refactoring tools, and more.
All of these components have to be loaded at some point, and often depend on other components. Visual Studio uses the Managed Extensibility Framework (MEF) to determine load order and specify component interdependencies.
ReSharper is one of those components, but also comes with its own component model. There are several reasons for having our own component model:
- We have a number of standalone products like dotPeek, dotMemory and dotTrace, as well as the ReSharper command-line tools, that all depend on and reuse components of ReSharper.
- Third-parties can implement additional functionality through extensions on top the ReSharper component model.
ReSharper’s component model is quite advanced. Components can be loaded when the host starts, when a solution is loaded, just-in-time when needed, … Components are registered using attributes in extension code, and then loaded at the appropriate time. ReSharper loads about 8100 components when Visual Studio starts, and around 2500 components per solution.
While all of that is powerful and allows for extensibility, it comes with a few downsides as well:
- Components have to be instantiated at some point. Either when the host process starts (which could be Visual Studio or one of our standalone tools like dotPeek), or when a solution is loaded or reloaded.
- All components have to be loaded in one chunk, to ensure interdependencies can be satisfied.
Visual Studio and ReSharper differ in their approach to component load and discovery. Visual Studio caches the component model (which is good but sometimes also needs a gentle nudge), whereas ReSharper transparently invalidates its component cache when any file changes.
The process of scanning components is quite fast, but there is one downside in the current ReSharper architecture: all components are created in a transaction on the main thread. That’s an issue… If scanning and initializing components takes 9 seconds on the main thread, there is a big chance Visual Studio will display the yellow notification bar stating ReSharper slowed down Visual Studio startup.
There is another issue here: Visual Studio lazily loads some of its own components. However, ReSharper sometimes has to force Visual Studio to load these, as a ReSharper component may have a dependency on it. We are working on making ReSharper also use lazy loading for many of these cases, to further reduce the initial startup time.
JetBrains is working on lifting the main thread requirement, so that components can be loaded on other threads. This will also make it possible to load components lazily, on-demand, which will further reduce startup time.
Just-in-Time – JIT compilation
The C# compiler usually does not compile directly to machine code, and instead compiles to Common Intermediate Language (CIL). When we then start a .NET application, that CIL code is compiled Just-in-Time (JIT) and executed by the .NET runtime.
This approach eliminates the need to distribute different executable files for different CPU types and platforms. It helps us ship a single ReSharper assembly, which can be run on a variety of Windows operating systems and even cross-platform as proven by Rider (which uses the ReSharper engine as well).
The process of JIT compilation is highly optimized: the .NET runtime only compiles the CIL code that is being executed, not entire assemblies.
Now let’s look back at ReSharper’s component composition we just talked about… On startup, a lot of assemblies are loaded, and because we have to determine if initialization work has to be done a lot of code has to be JIT-ed and compiled at startup. The fact that this all runs on the main thread also means the main thread is affected by this JIT compilation.
So how can we solve this? One approach would be to skip JIT and use explicit compilation by converting all of the CIL code to machine code ahead-of-time (AOT), for example using ngen.exe (Native Image Generator).
We have tried ngen.exe with ReSharper, but this was not practical for a number of reasons:
- If we run AOT compilation at JetBrains, installer size would become much larger because assemblies for different platforms would have to be shipped.
- If we run AOT compilation as part of installing ReSharper, installation would take longer to run and would require running with elevated privileges, which many of our customers don’t allow.
Instead of doing ahead-of-time compilation, we will be taking another approach which is somewhere between JIT and AOT compilation. Similar to using the ProfileOptimization class, instead of performing JIT on the main thread, we will ship a runtime profile with ReSharper (and other tools) so that the .NET runtime can perform JIT in a more efficient manner:
- The profile describes the classes and methods that will be accessed on load, instead of having to rely on late binding to discover which CIL code has to be compiled.
- Since we have that description, we can run the JIT compilation over multiple background threads, speeding up the entire process.
If we profile startup of dotPeek, our standalone decompiler that uses a number of components from ReSharper, we can see most of the JIT work normally happens on the main thread. On a 4 core/8 thread machine, starting dotPeek takes roughly 12 seconds.
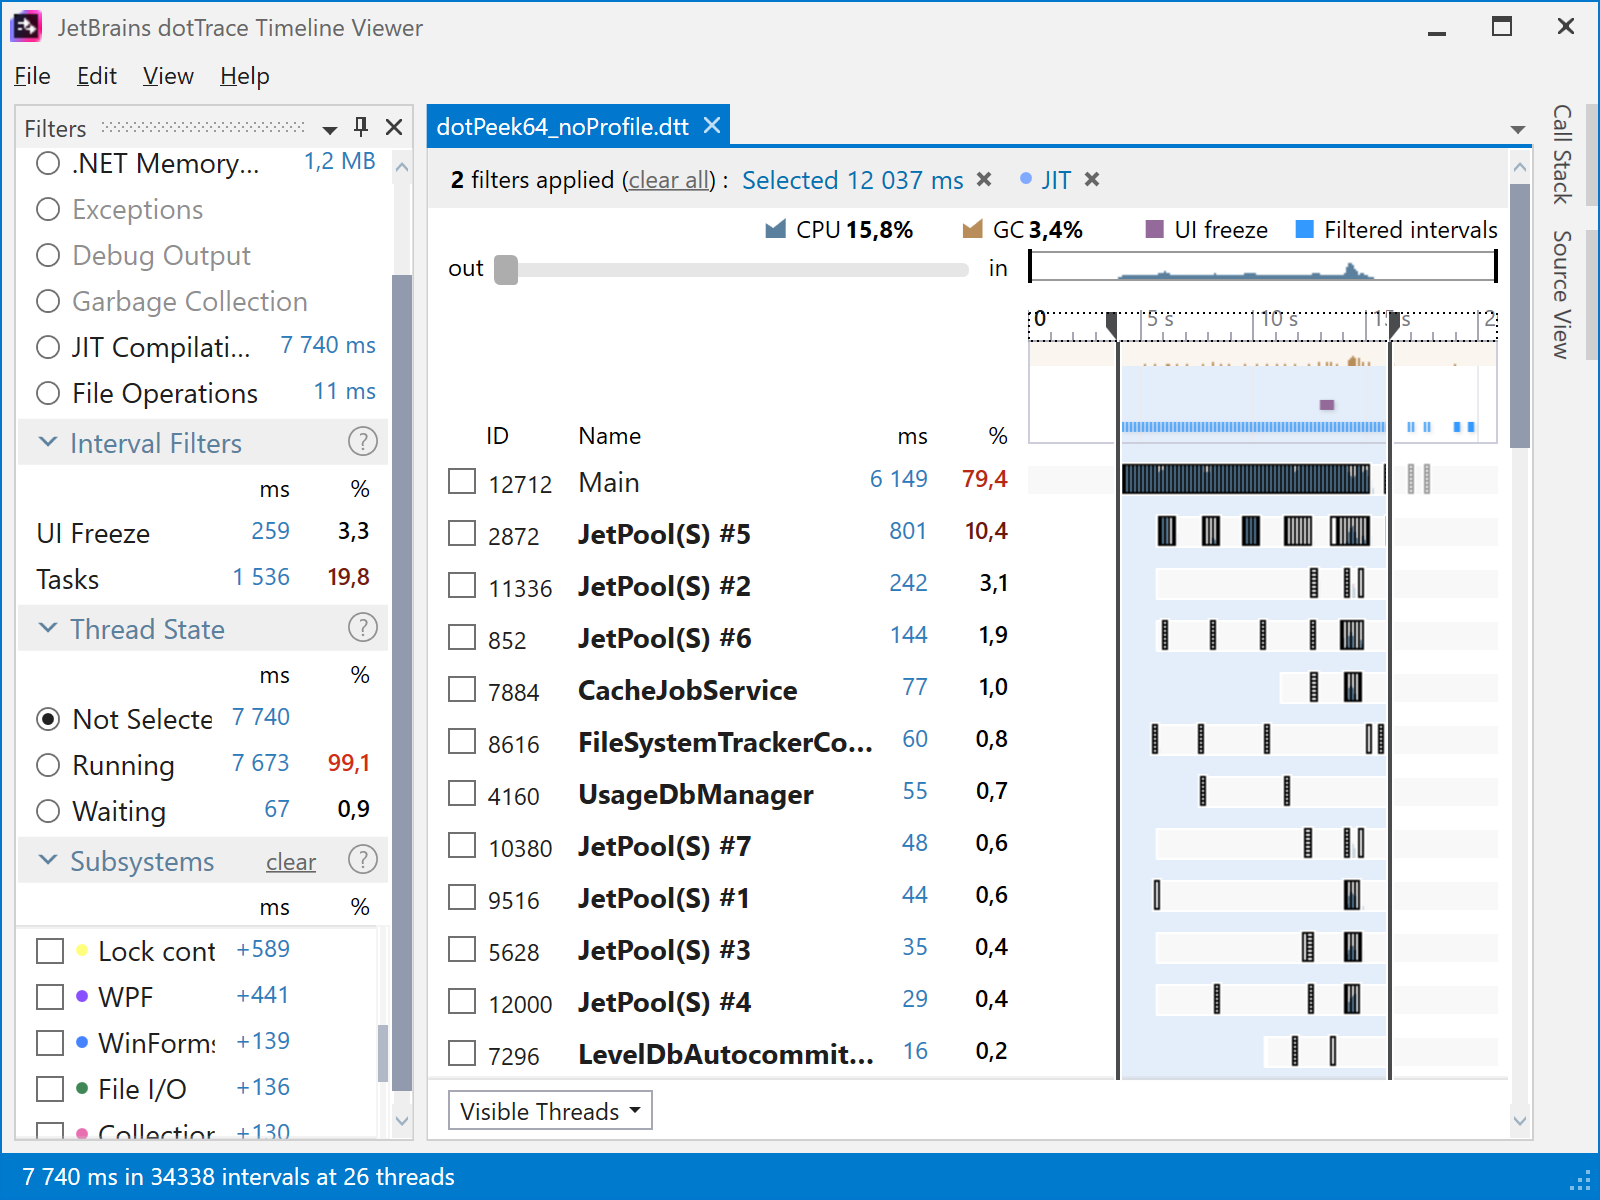
When making use of a JIT profile, things look different. The main thread is still very active during startup (it’s the main thread after all), but a lot of the JIT work is moved to separate threads (the CLR Worker threads in the below screenshot). On the same 4 core/8 thread machine, startup now only takes around 7 seconds.
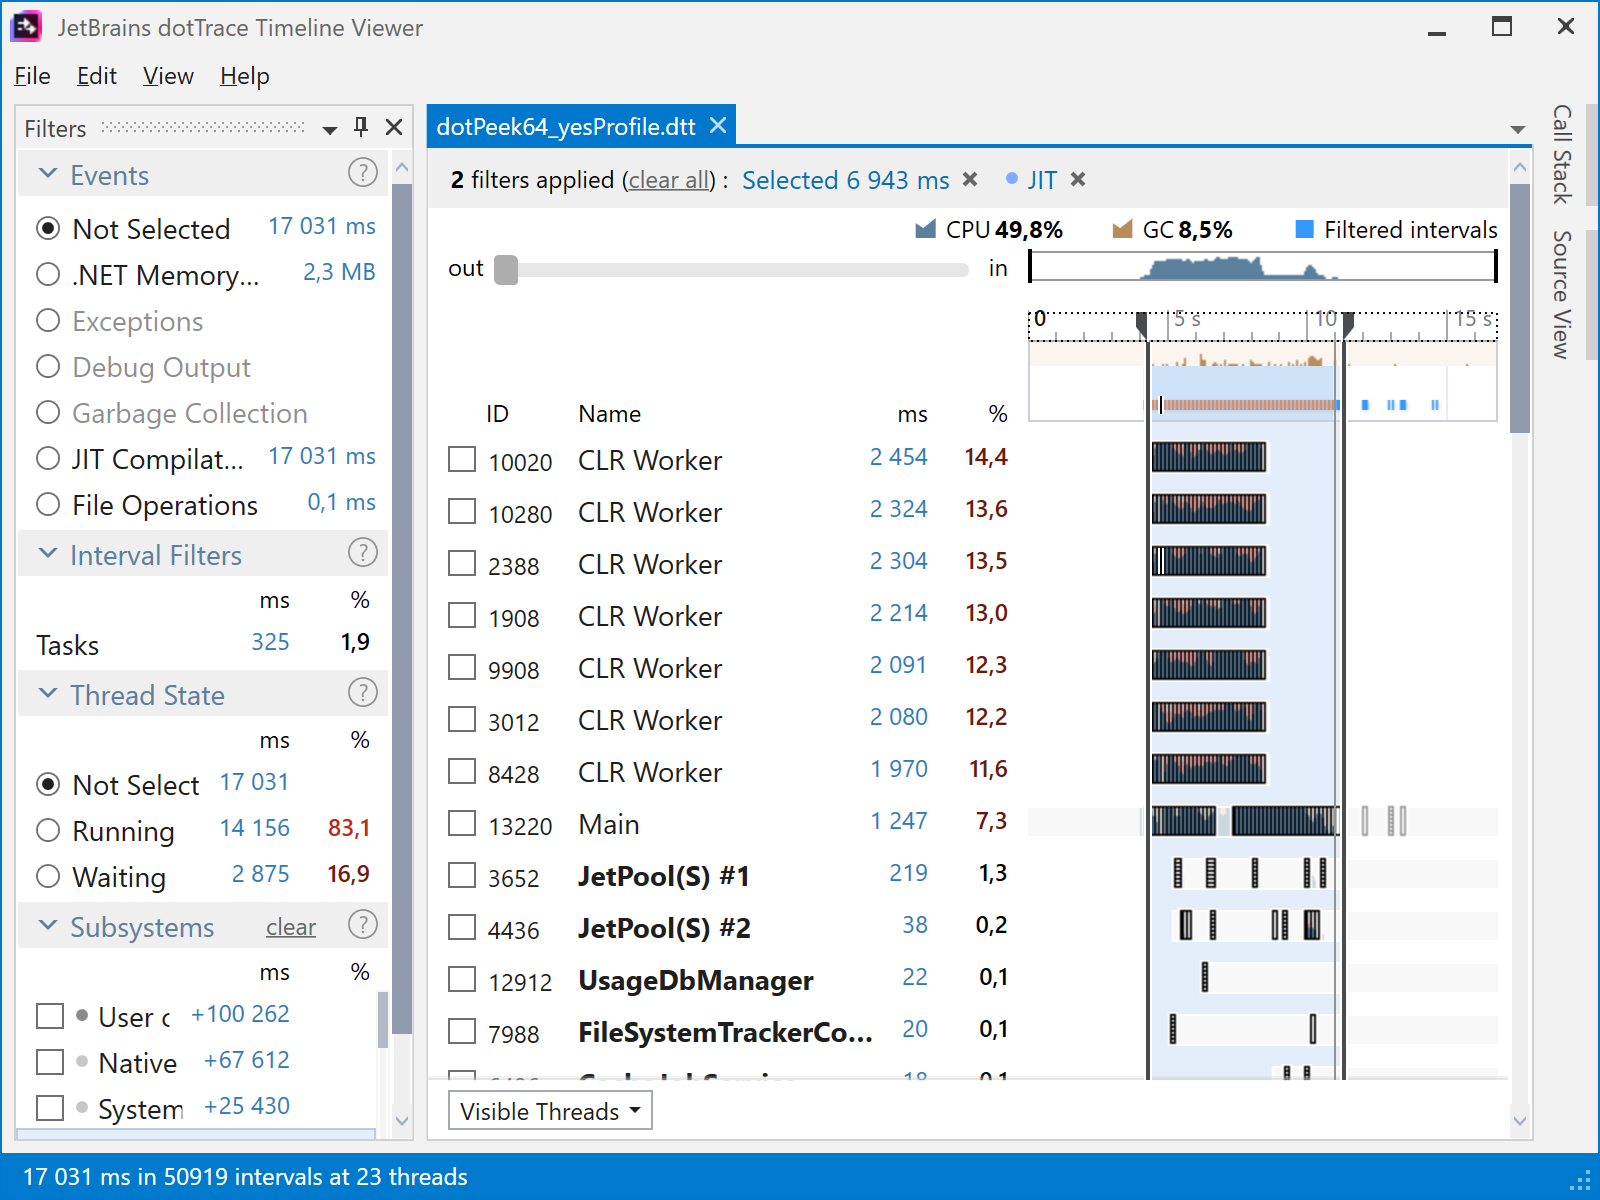
You may have noticed that the second snapshot does more JIT than the first snapshot (17 031 ms as opposed to 7 740 ms). If you caught this, great! The second, faster version is indeed doing much more JIT compilation at startup. This is due to the JIT profile we created, which contains more classes and methods than what we need to be available just after start. This gives the JIT compiler some additional work, but overall application load is faster, and having these extra methods “ready to be used” pays off during application usage.
With ReSharper, we’re seeing promising results where loading components using this technique takes ~5 seconds, instead of ~9 seconds on average right now. Work in progress!
JetBrains is working on improving Just-in-Time (JIT) compilation performance, as well as making it use multiple background threads. This will greatly reduce startup time.
Too much work on the UI thread
Previously, we looked at a performance snapshot of Visual Studio and determined quite a lot of garbage collection is happening. However, we skipped over another interesting item. Have a look at the main (UI) thread here:
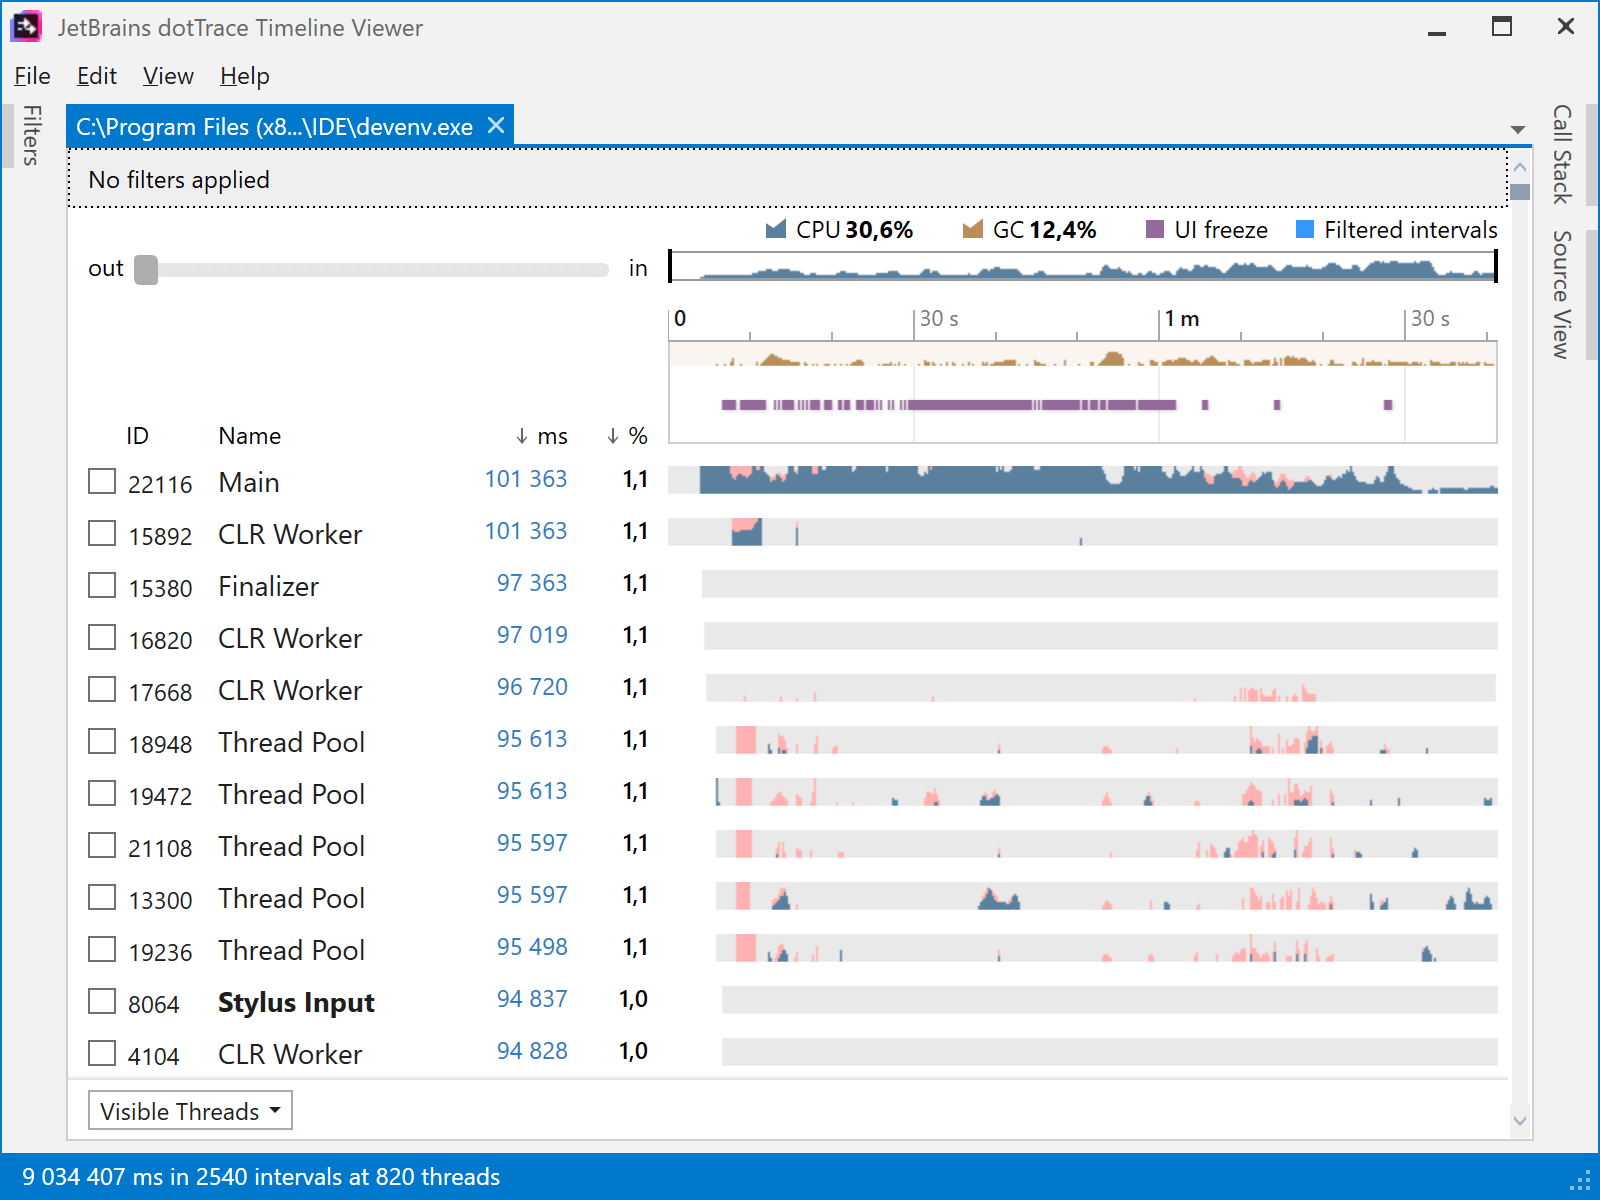
We have already seen that component composition in ReSharper is a cause of the yellow Visual Studio unresponsiveness notification, as well as Just-in-Time (JIT) compilation.
Being an active participant in your Visual Studio coding experience, ReSharper does have to send messages to the main/UI thread, e.g. to add a code analysis warning squiggle in the editor, or render additional elements in the UI. It turns out that if ReSharper is invoking any Visual Studio functionality that is unresponsive, ReSharper can be blamed for the unresponsiveness notification – even though it is not the real culprit.
This behaviour is described in the documentation:
A UI unresponsiveness or crash notification means only that one of the extension’s modules was on the stack when the UI was unresponsive or when the crash occurred. It does not necessarily mean that the extension itself was the culprit. It is possible that the extension called code which is part of Visual Studio, which in turn resulted in unresponsive UI or a crash.
So while the unresponsiveness notification is an indicator, it may not be 100% accurate. We’d like to get as much info as we can to improve ReSharper, so if you have a performance issue with Visual Studio and ReSharper, do collect a performance snapshot and send it to JetBrains! And let Microsoft know as well.
JetBrains is working on making sure ReSharper does not interrupt the UI message pump for too long, which will reduce false notifications. In combination with doing less work on the UI thread, this helps improve overall performance.
Conclusion
So far in this series about ReSharper performance, we covered a number of high-level improvements JetBrains is making in this area. Unfortunately, there is no silver bullet. A combination of efforts will have more effect, and that’s why:
- We are investigating making ReSharper a child process of Visual Studio, instead of being part of the main process.
- We are working on making it possible to load components on background threads.
- We are investigating the possibility to create components on-demand, further reducing startup time.
- We are working on improving Just-in-Time (JIT) compilation performance, as well as making it use multiple background threads.
- We are working on making sure ReSharper does not interrupt the UI thread and message pump for too long, which will reduce false unresponsiveness notifications.
All of these improvements are architectural in nature, and will start surfacing in the next versions of ReSharper and Rider.
There’s one type of performance issues we haven’t looked at yet: the smaller, local performance problems that tend to accumulate over time. These are often the type of issue that only becomes visible when software is used in varying environments.
In our next and final post of this series, we will look at a number of smaller performance improvements that were made in the latest ReSharper 2018.1 and Rider codebases. Keep an eye out for our next blog post!
Make sure to also check the Performance guide for Visual Studio (ReSharper 2017.3+) and our KB article Speeding up ReSharper (and Visual Studio) if you are experiencing performance issues. If you have a specific performance issue you can reproduce, we’d appreciate if you could collect a performance snapshot and send it over.

Subscribe to a monthly digest curated from the .NET Tools blog:


