

.NET Tools
Essential productivity kit for .NET and game developers
Rider 2018.3 assembly explorer and cross-platform .NET decompiler

Rider has had support for decompiling .NET assemblies for a while (including debugging), but it only allows decompiling assemblies referenced in our solution.
The latest Rider 2018.3 Early Access Preview (EAP) changes this, and comes with a built-in assembly explorer, which lets us drill into namespaces, types and type members for any assembly. Essentially, this makes Rider’s assembly explorer a cross-platform .NET decompiler that works on Windows, Mac OS X and Linux, based on dotPeek.
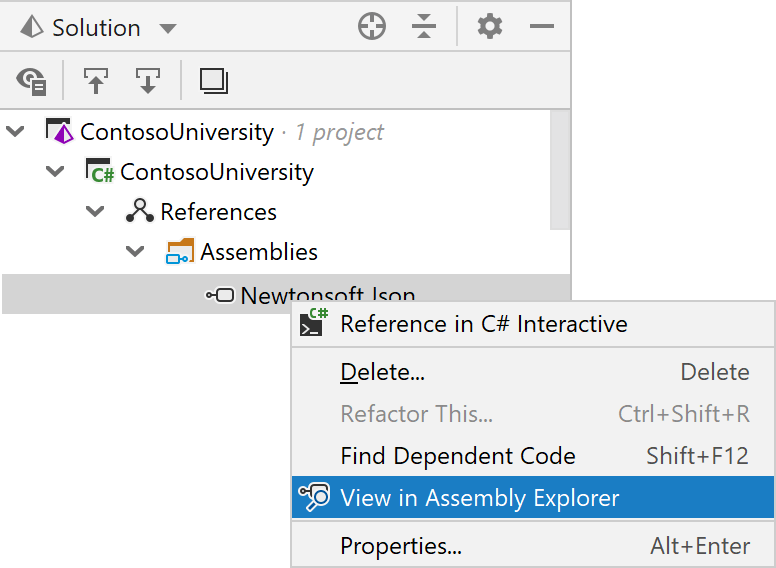
For referenced assemblies, we can use the View in Assembly Explorer context action to open the assembly explorer:
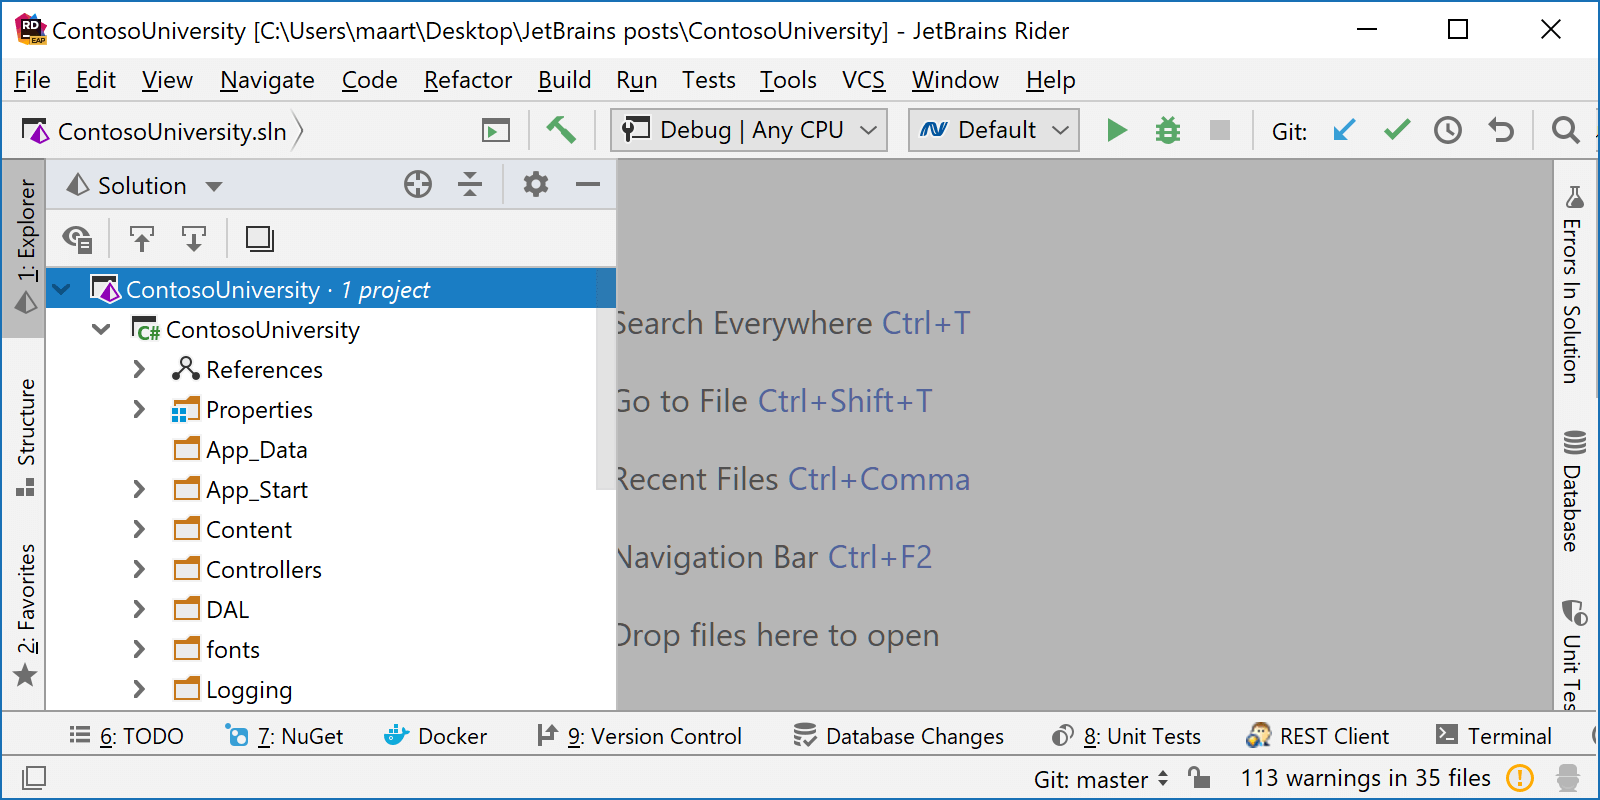
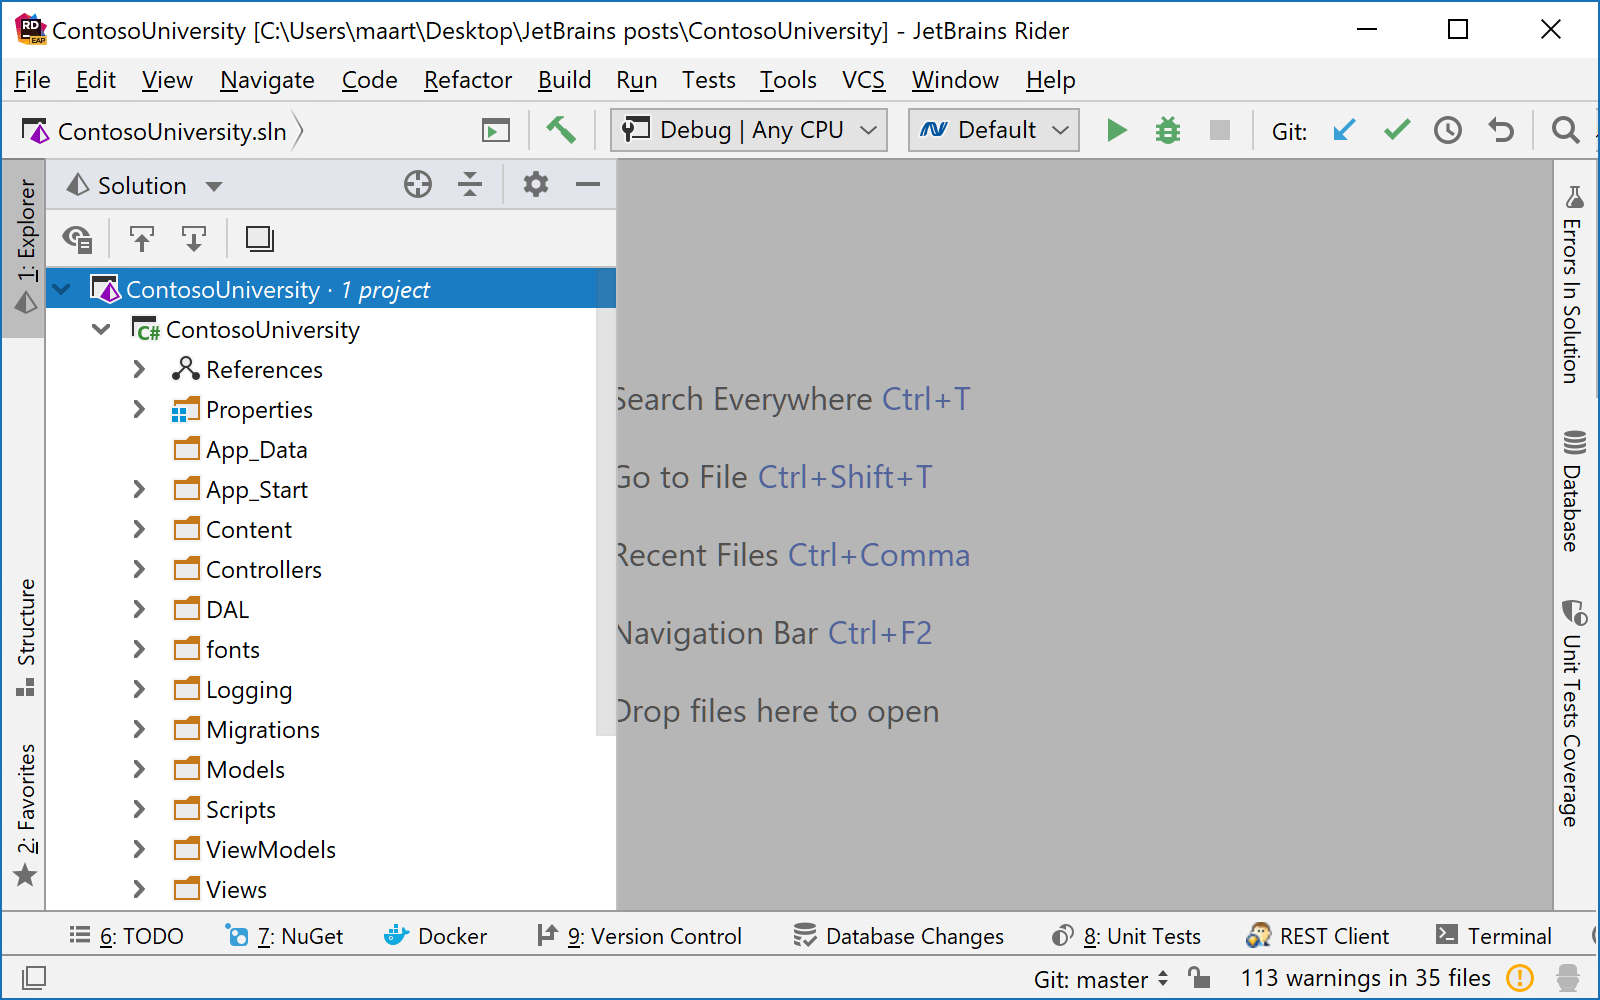
Another way to open it, is by changing the view of the Solution Explorer tool window – it’s more than just a Solution Explorer! From the title bar, we can explore our solution, the local file system, and assemblies. In the Visual Studio keyboard scheme, we can also use Alt+Left arrow/Right arrow to switch views.
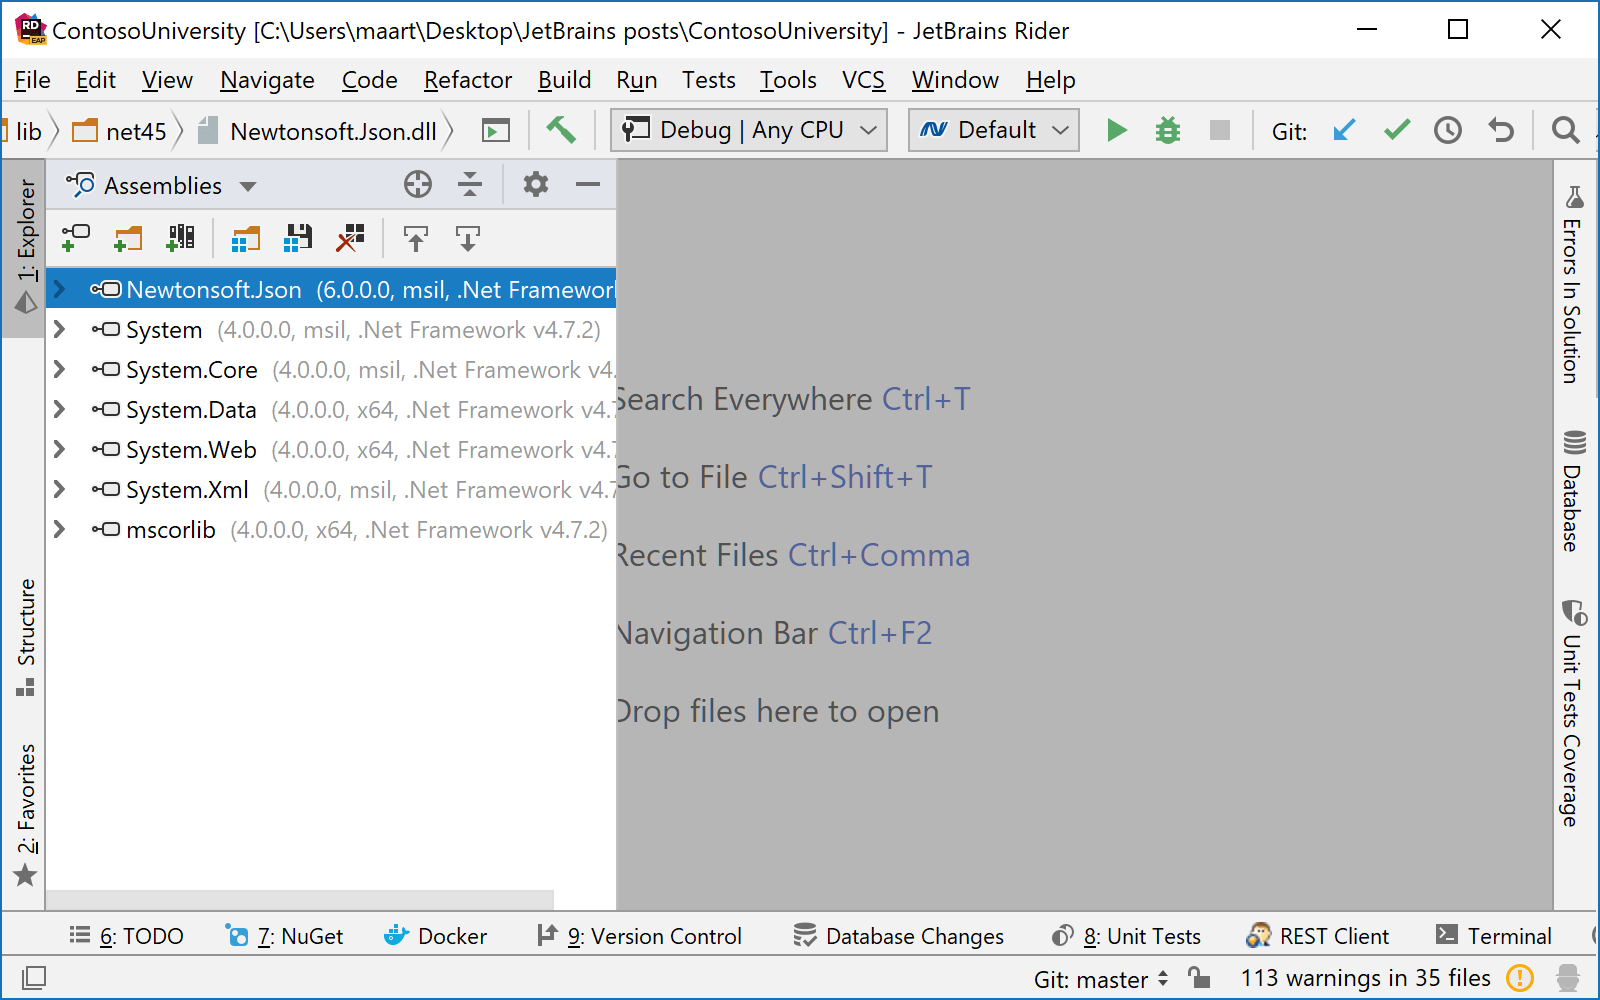
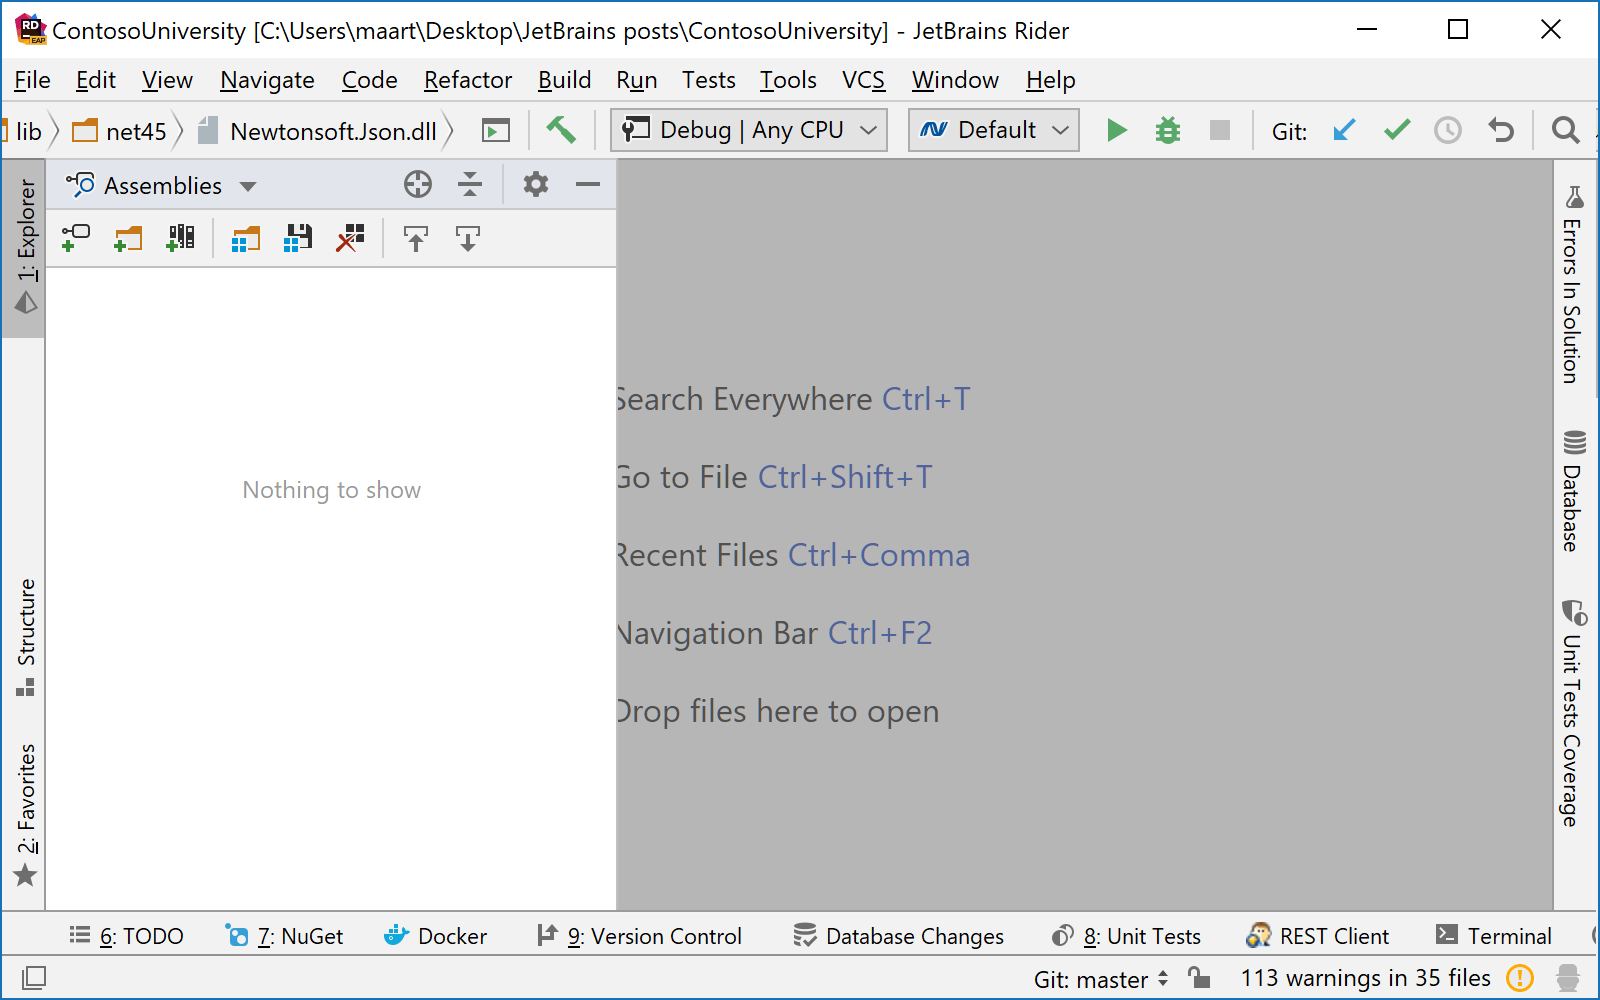
Once we’ve opened the assembly explorer, we can navigate through namespaces, types and type members, as well as embedded resource files. Double-clicking (or Enter when using the keyboard) will open the decompiled source code or the embedded resource:
Just like dotPeek (our standalone .NET decompiler for Windows), Rider lets us open individual assemblies from disk, explore folders, and open assemblies from the Global Assembly Cache (GAC). It also supports working with assembly lists, making it easier to switch between different sets of assemblies. Rider indexes all assemblies in our assembly list, as well as the assemblies they reference.
Tip: in Open from GAC as well as in many other tool windows in Rider, we can start typing to perform a wildcard search for items, and then use the arrow keys to cycle through search results.
Of course, we can use Search Everywhere (Ctrl+T or Double-shift) to navigate to the decompiler as well. Rider can navigate to classes and interfaces, as well as other symbols like properties and methods.
Tip: Rider also supports debugging and placing breakpoints in decompiled code, making it easy to debug third-party code.
Download Rider 2018.3 EAP and give it a try! We would love to hear your feedback on these updates!

Subscribe to a monthly digest curated from the .NET Tools blog:


