

.NET Tools
Essential productivity kit for .NET and game developers
Performance Profiling in Rider 2018.3. What’s New?

If you’re an active Rider 2018.3 user or just follow our blog, you probably know that Rider just got an integrated performance profiler based on JetBrains dotTrace. Though we’ve already reviewed the profiler features on the EAP stage, the release version brings some important changes, especially concerning profiling session configuration. Read this post to learn more about the changes.
Supported OSs and frameworks
Just to reiterate: in Rider 2018.3, the profiler supports only Windows + .NET Framework / .NET Core. We’re on the finish line with adding support for Mono and Mono Unity (as well as support for Linux and MacOS), but the feature still requires some polishing. It is highly likely that you will see it in early 2019.1 EAP builds.
What can you profile in Rider?
A quick reminder of what can be a profiling target:
- NET / .NET Core standalone applications
- ASP.NET / ASP.NET Core web applications (IIS Express only)
- Arbitrary .NET / .NET Core processes
- NUnit / xUnit / MSTest unit tests
In this post, we’ll take a quick look at how you can profile apps in Rider. For details on how to profile tests or arbitrary .NET processes, please refer to the Rider documentation. So, what has changed exactly in the release version of Rider 2018.3?
Configuring and starting a profiling session
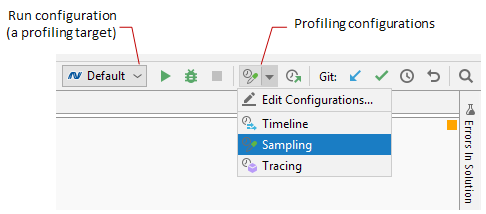
Session configuration has been affected the most as it is no longer part of run configuration:
- Profiling session configuration is a separate entity that is selected/edited right from the toolbar.
- Profiling target is always an executable specified in the currently selected run configuration. For example, if you profile a web app on IIS Express, the profiling target is
iisexpress.exethat runs this web app. Currently, you can profile the following run configuration types: - To start a session, simply select a profiling configuration and click the same control on the toolbar.
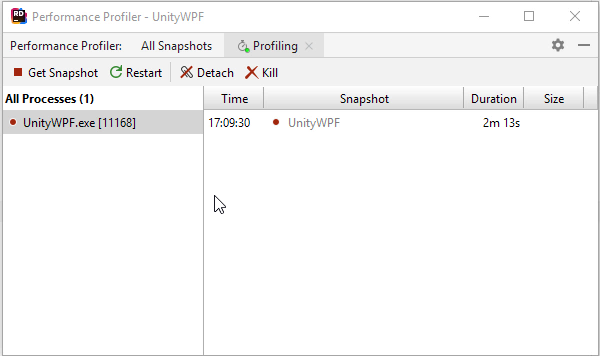
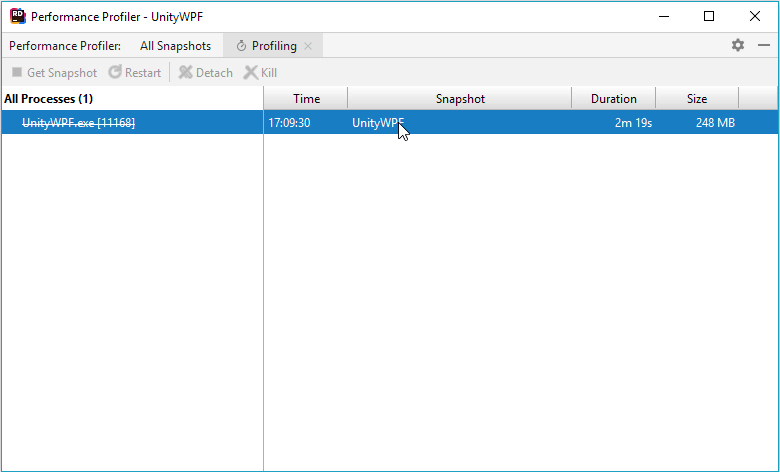
Getting snapshots
This part hasn’t changed much since the EAP stage. It’s quite straightforward: after the profiling session starts, do what you need to do in your application, and then click Get Snapshot.
Analyzing snapshots
Once you have a performance snapshot, use the Top Methods view and the Call Tree view to determine the cause of a performance bottleneck. The analysis workflow has changed somewhat after the EAP.
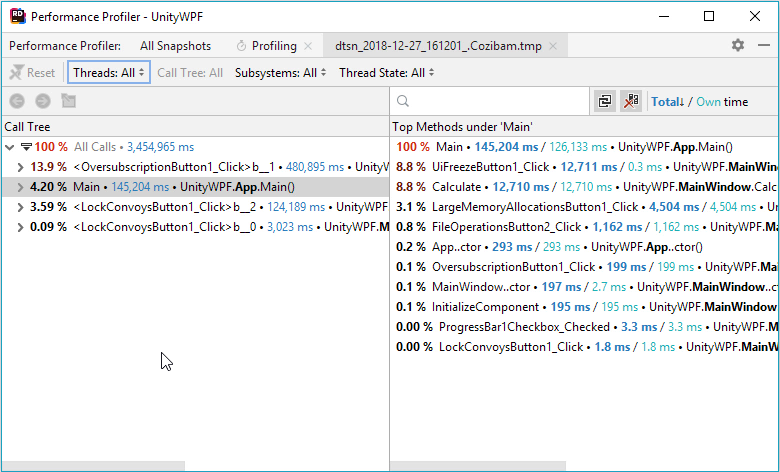
Combined Call Tree and Top Methods
First of all, the Top Methods and Call Tree views are now connected with each other. If ![]() Follow the selection is turned on, Top Methods shows methods only for the subtree that is currently selected in Call Tree.
Follow the selection is turned on, Top Methods shows methods only for the subtree that is currently selected in Call Tree.
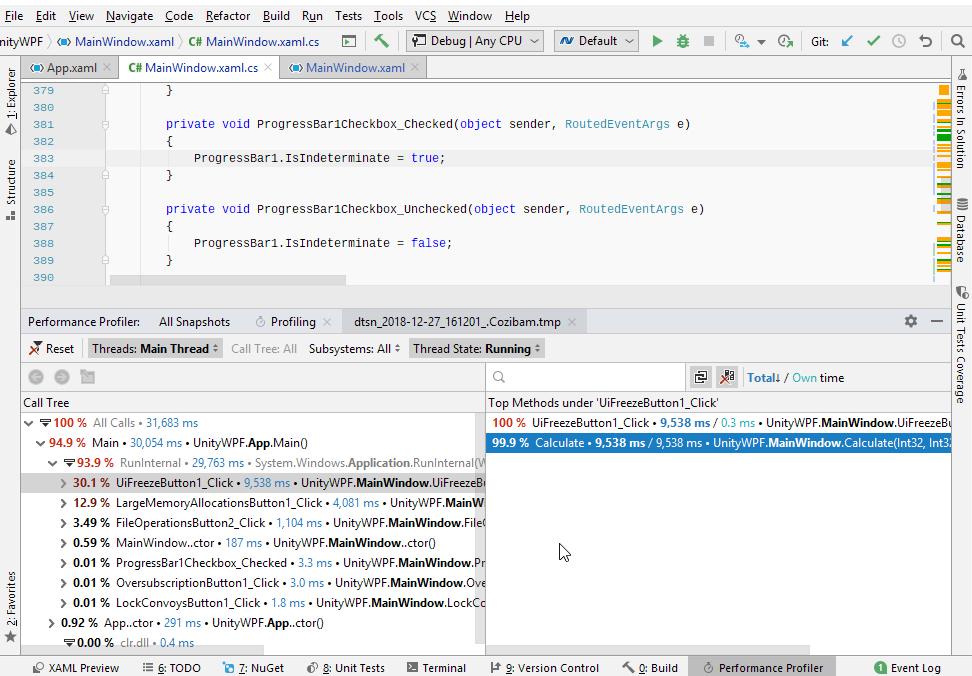
Filters for Timeline snapshots
The second improvement is related to Timeline profiling. We’ve added more filters comparing to the EAP. Now, you can use four basic filters:
- by thread,
- by thread state,
- by method, and
- by subsystem.
Improved navigation
The navigation capabilities are also improved. You can navigate:
- from a snapshot to code,
- from code to a snapshot,
- from Search Everywhere to a snapshot.
As always, we invite you to download the latest Rider to try its new profiling features in practice.


