.NET Tools
Essential productivity kit for .NET and game developers
Testing and Profiling ASP.NET Core REST API’s from Rider, part 2
We are continuing our series on testing ASP.NET Core Web API projects using Rider. We will be using the HTTP Client built into Rider’s IDE that will allow us to build the calls to our REST APIs developed in ASP.NET Core Web API.
In this part, we will look at executing the HTTP Client scripts and examining the results of the responses. We will be testing the GET, POST, PUT and DELETE HTTP request verbs. We will also look at how we can compare the history of the responses that have taken place against our APIs over time.
In this series:
- Testing and Profiling ASP.NET Core REST API’s from Rider, part 1
- Testing and Profiling ASP.NET Core REST API’s from Rider, part 2
Executing and Analyzing the HTTP Response
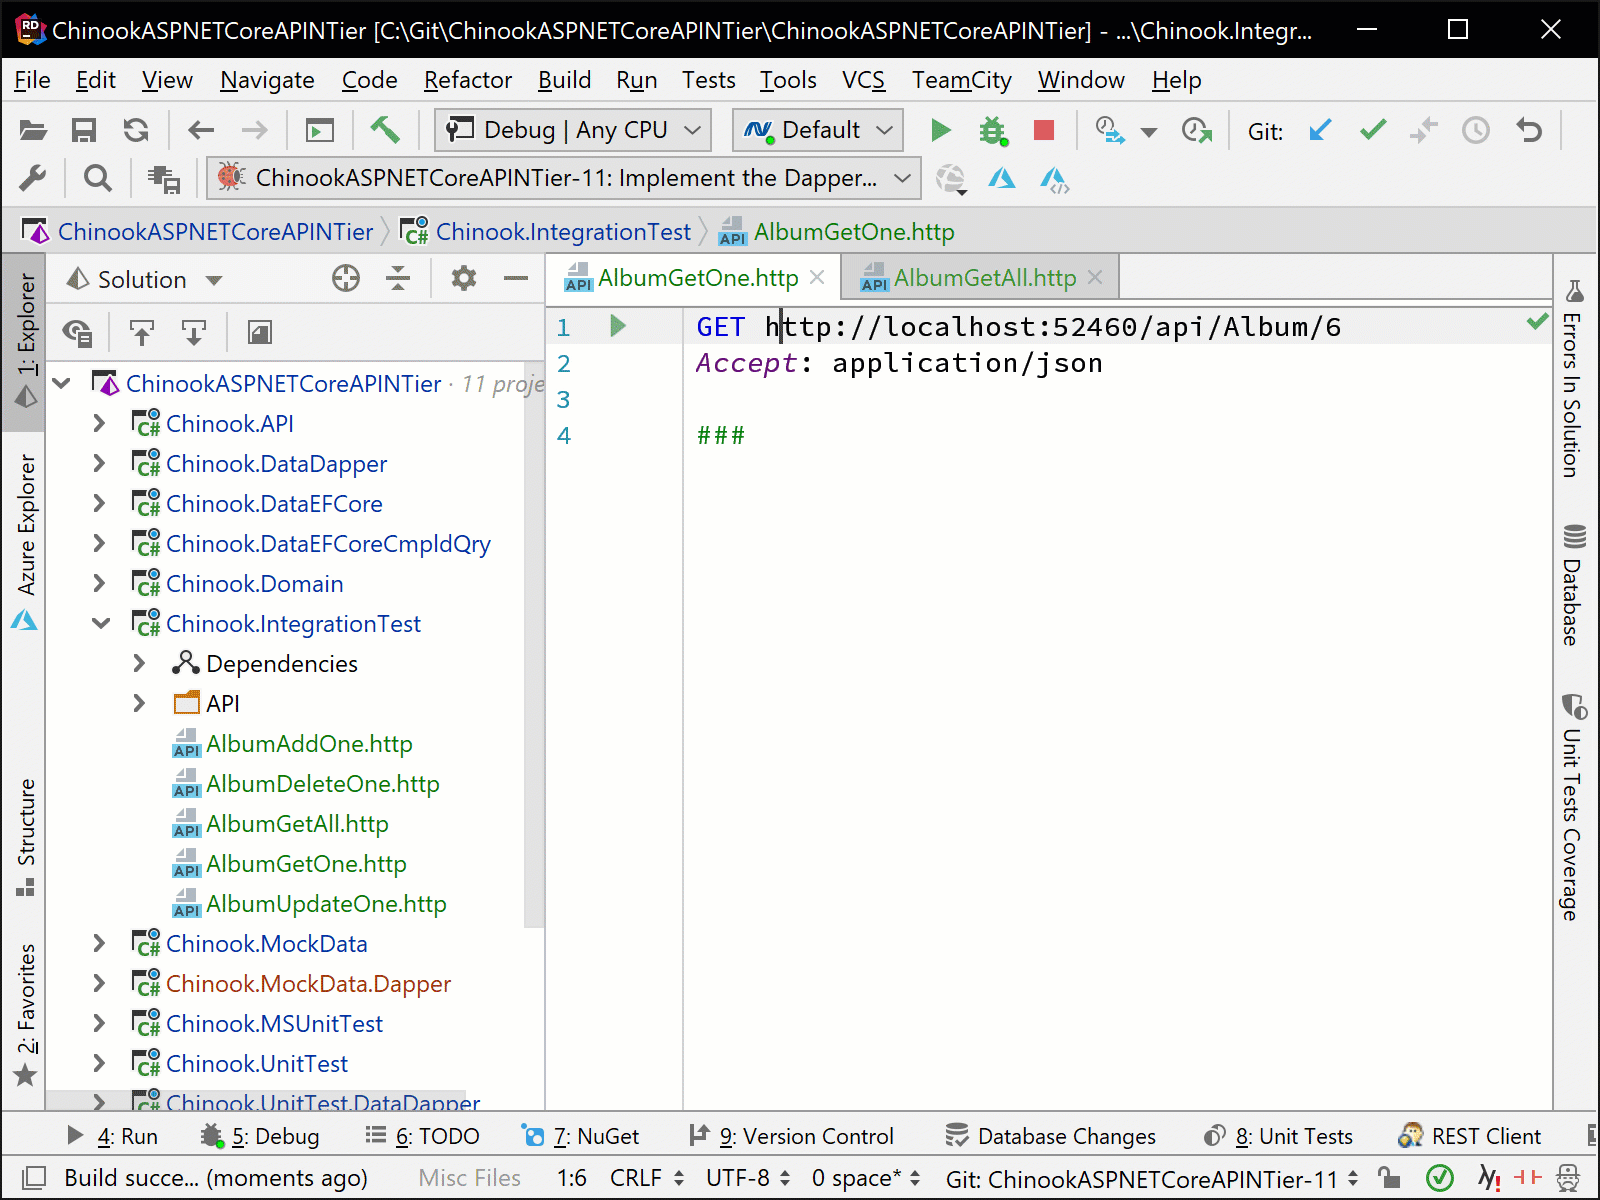
With our ASP.NET Core Web API solutions deployed and running, we can begin to execute the HTTP Client requests that we have composed in the previous blog post in the series. We can execute a script in three ways. The first is to use the Alt+Enter shortcut while the editor caret is on the request.
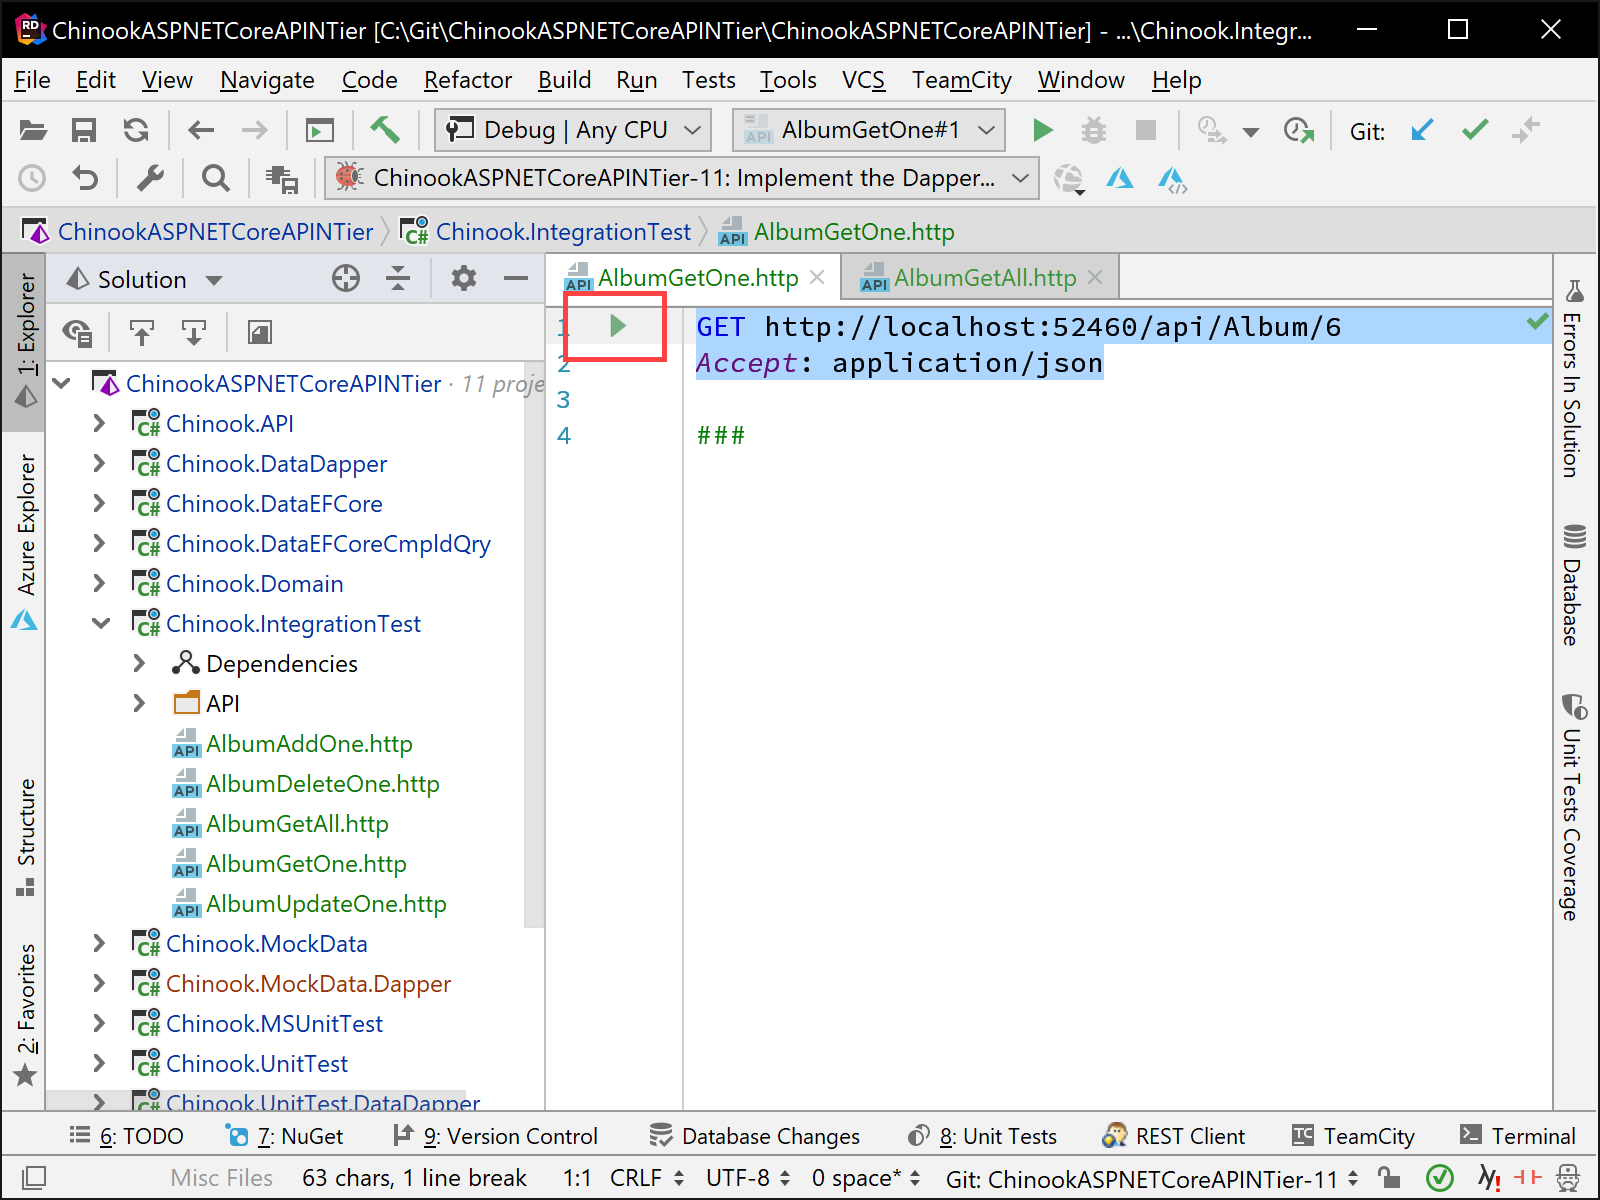
The second way to run a script is from the run icon in the editor gutter as shown below.
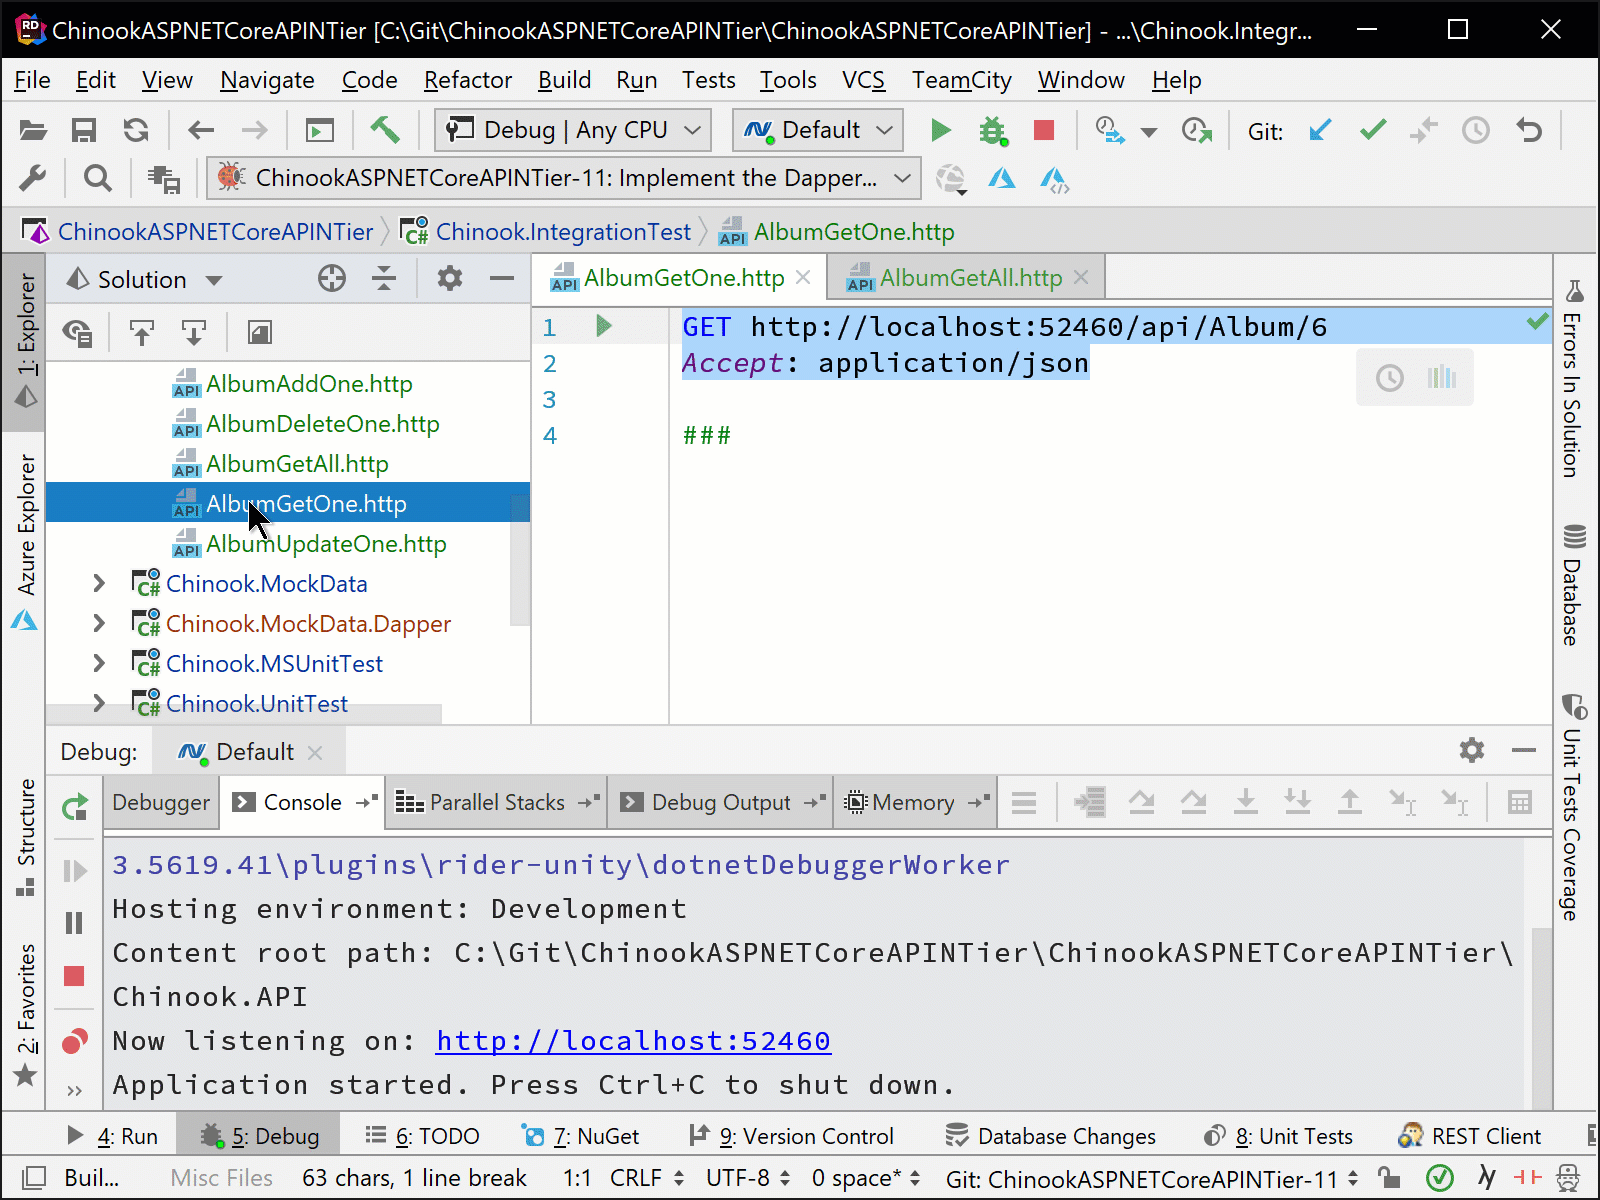
The last way to run an HTTP Client script is from right-clicking on the file in the Explorer window and running the script.
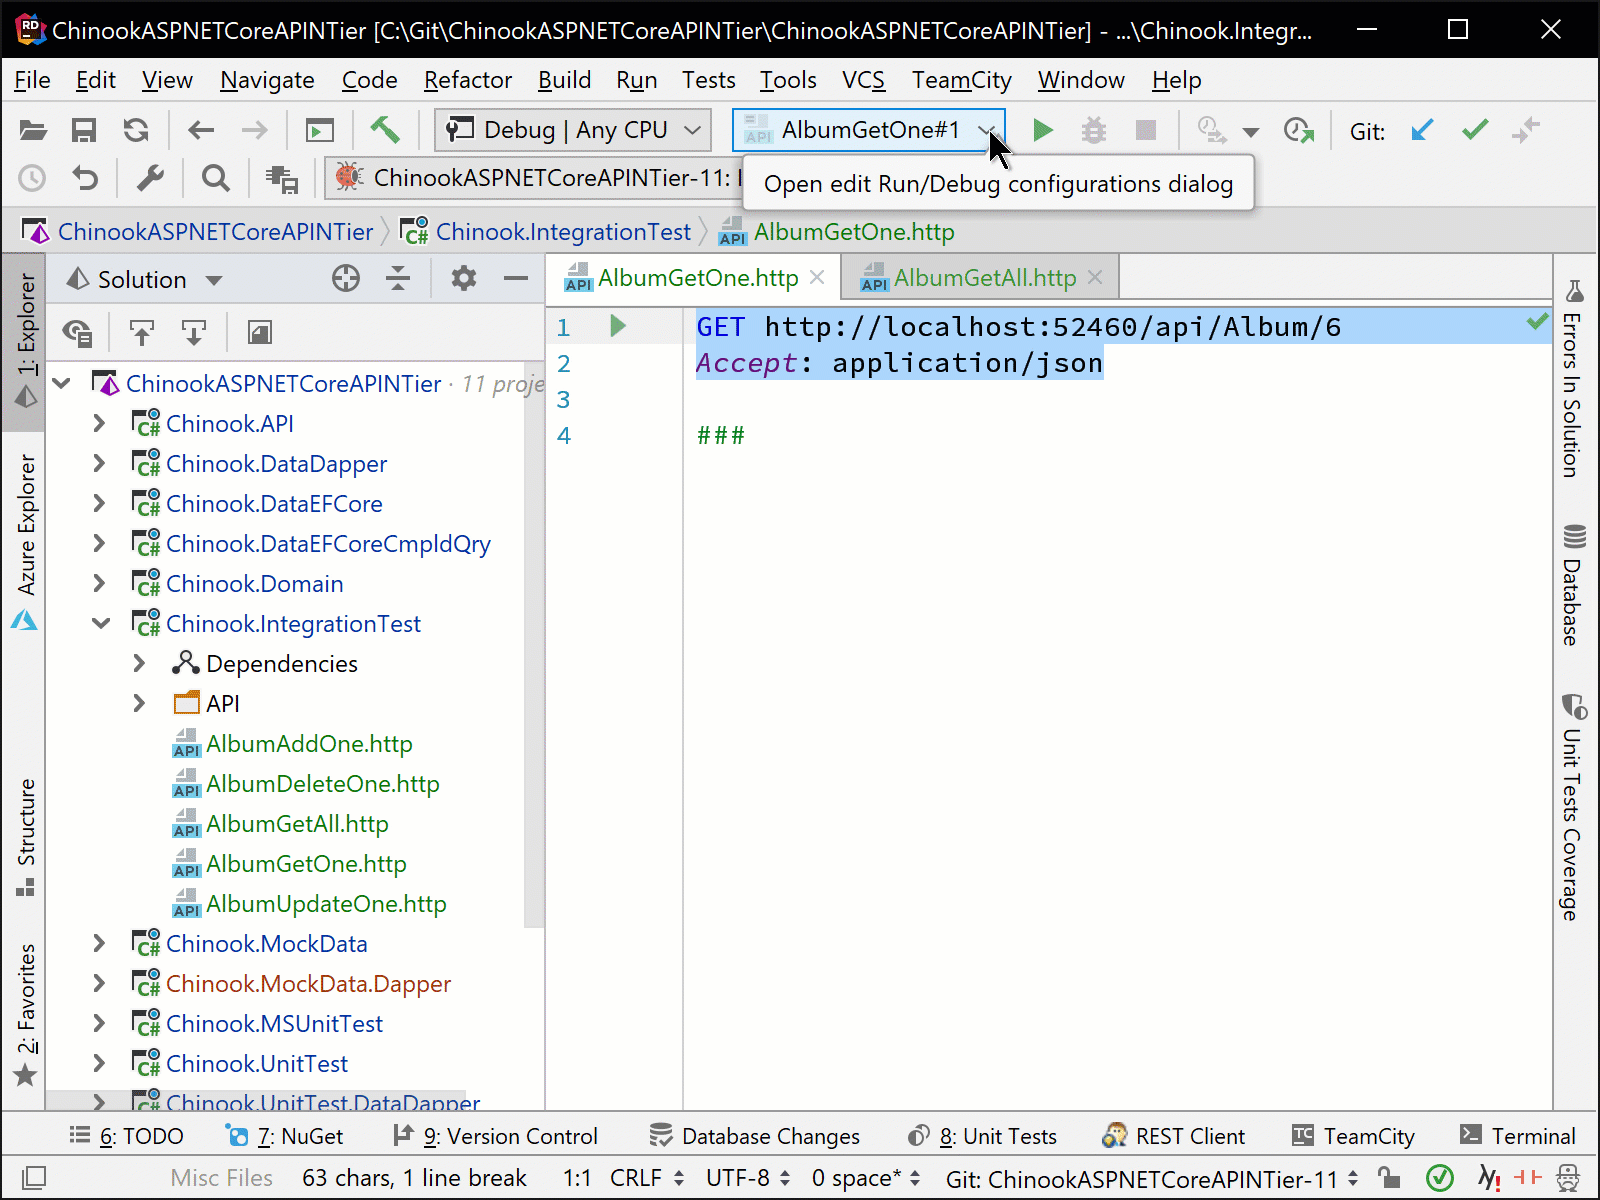
An easy way to make sure that the ASP.NET Core Web API solution is running is to edit the configuration of the HTTP Client scripts to before launching the script to run the .NET Project Configuration as shown below. We can set this up on all of our scripts to make things easier.
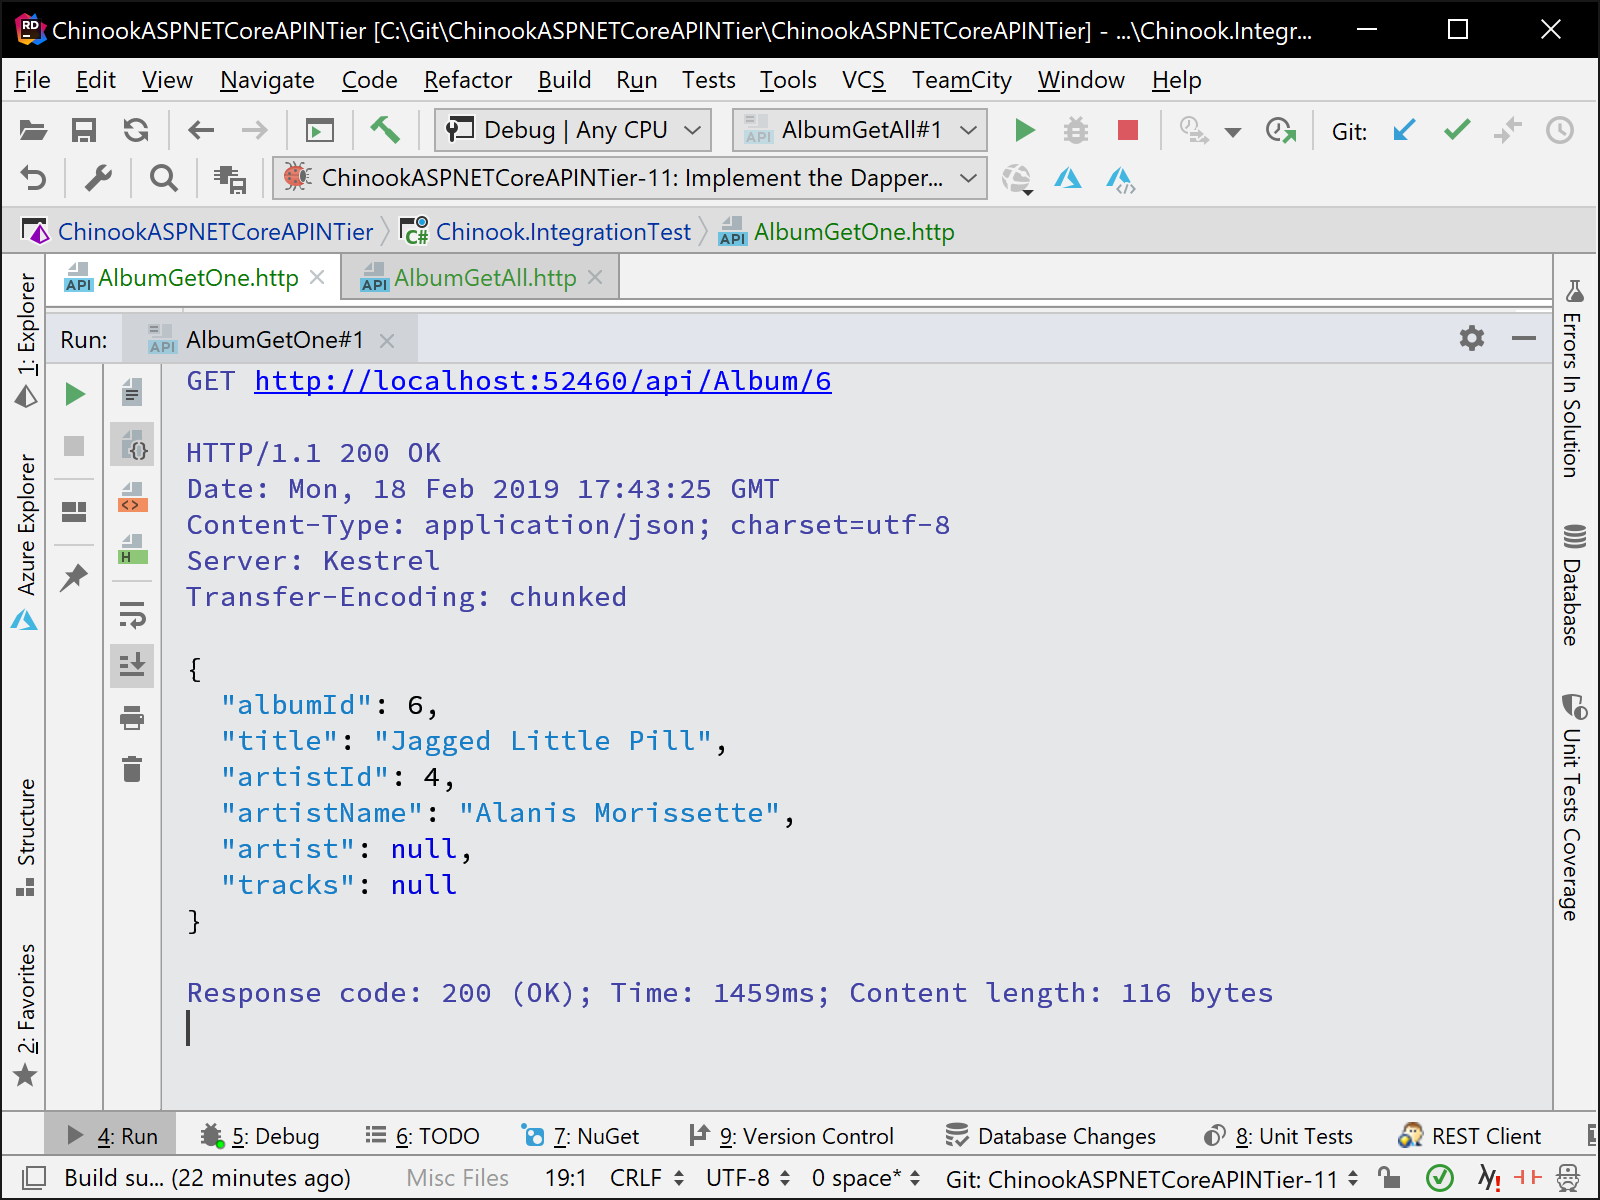
The results and execution details from the script will be shown in the Run tool window. The HTTP response will be given along with the contents of the HTTP response body. In addition, we will get the Response Code, execution time and content length of the HTTP response for our information.
Looking at the History of our HTTP Requests and Responses
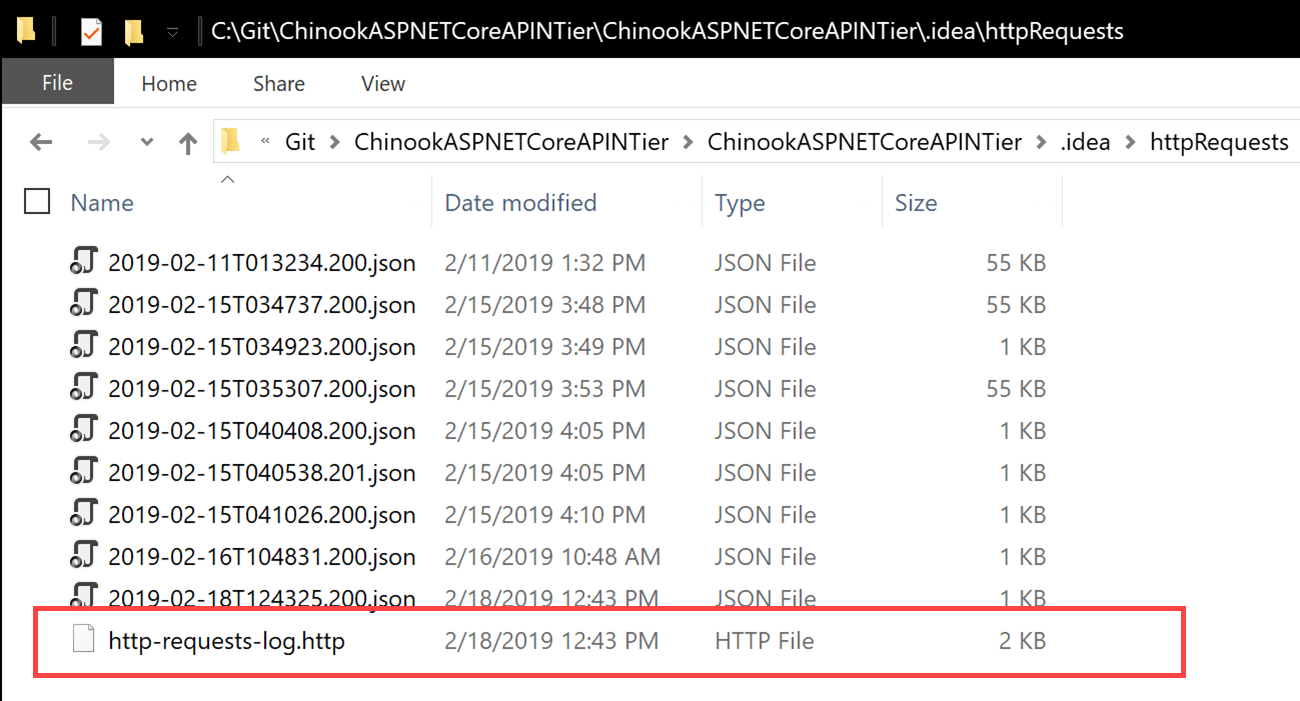
The data for all previous executions of HTTP Client scripts can be found in the http-requests-log.http file located in the \.idea\httpRequests folder for our solution.
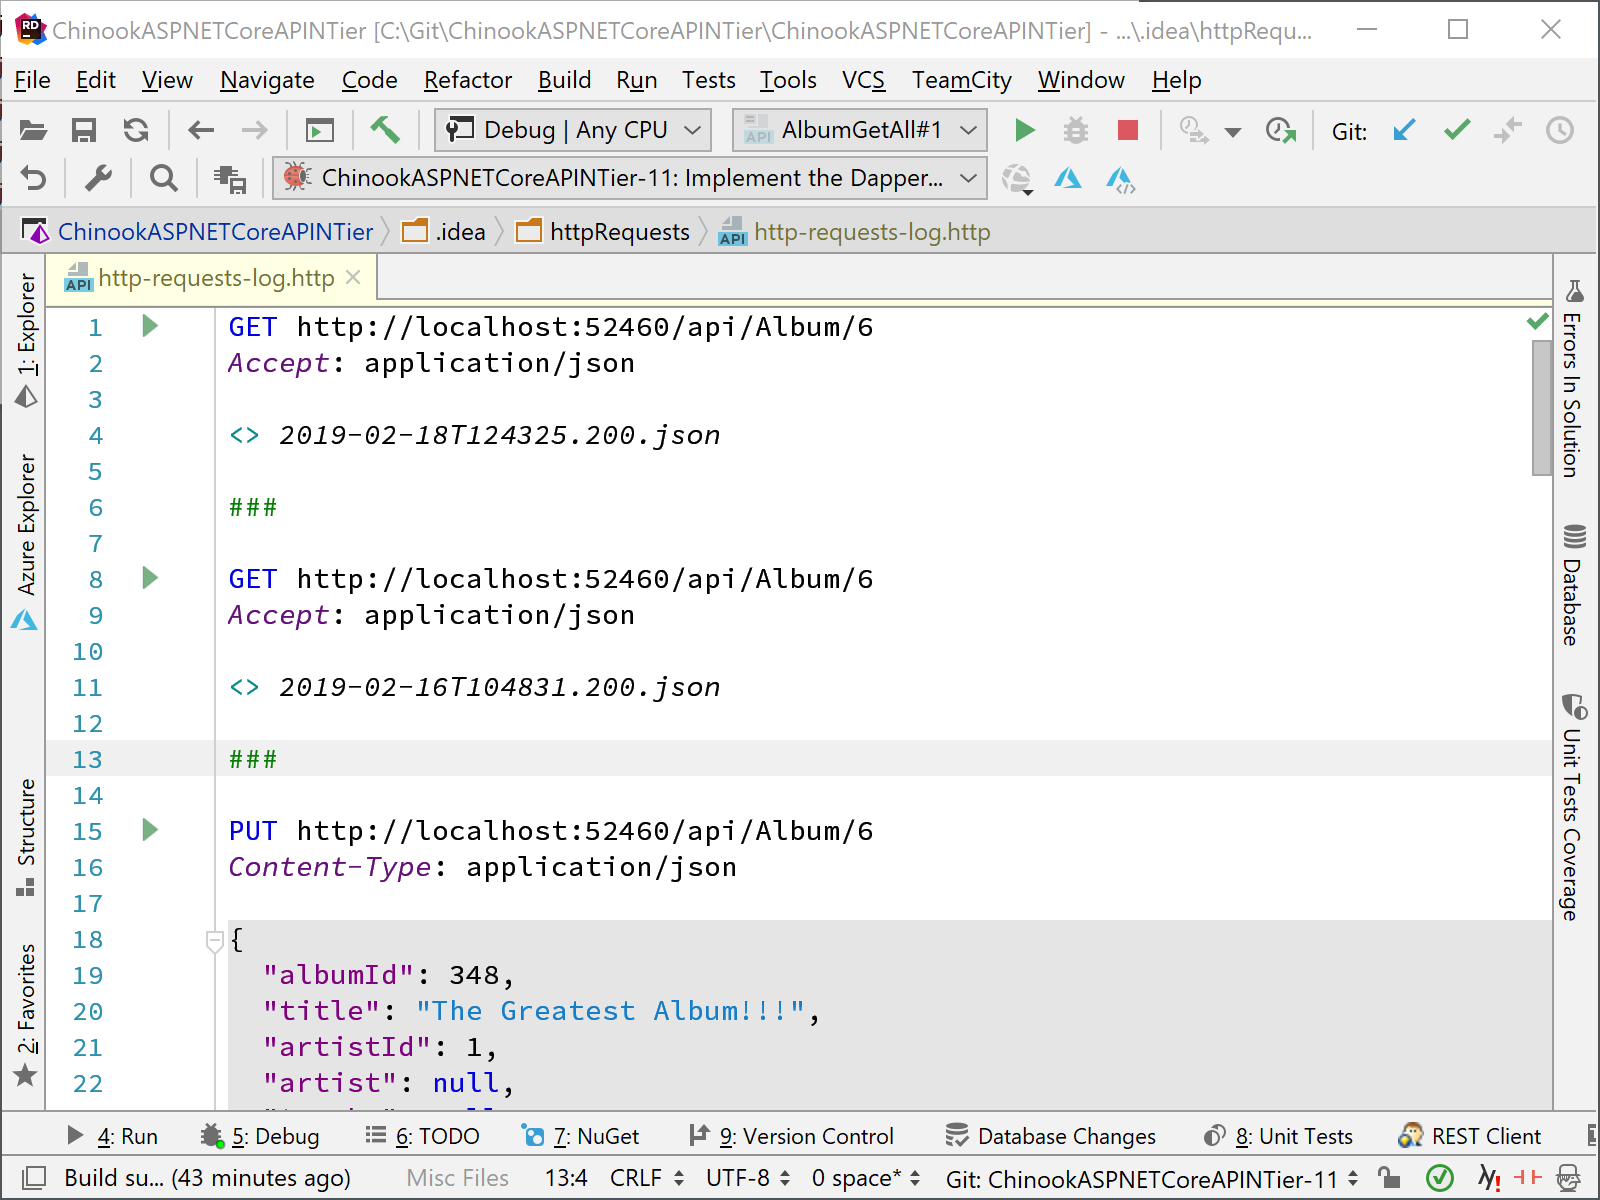
We can also open the http-requests-log.http file from the Tools | HTTP Client | Show HTTP Requests History menu selection or from the clock icon shown in each script file in the editor.

The http-requests-log.http will contain all results from the Run tool window concatenated based on the datetime of the script execution.
Note that the scripts that we have written for the HTTP Client can be stored with the rest of our solution code locally and in source control for later execution and analysis.
As we have seen in this two-part series, we have a very easy way to test our ASP.NET Core Web API projects. Download Rider 2018.3.3 and give it a try! We’d love to hear your feedback!
Subscribe to a monthly digest curated from the .NET Tools blog:


