

.NET Tools
Essential productivity kit for .NET and game developers
Smart Step Into Enabled by Default and More Debugger Updates in Rider 2020.1

Rider 2020.1 has a lot of excellent features in store for you! In this post, we will look at how Smart Step Into lets us step into methods we’re actually interested in, some UI updates that help reduce mental context switches while debugging, and more!
Smart Step Into is enabled by default
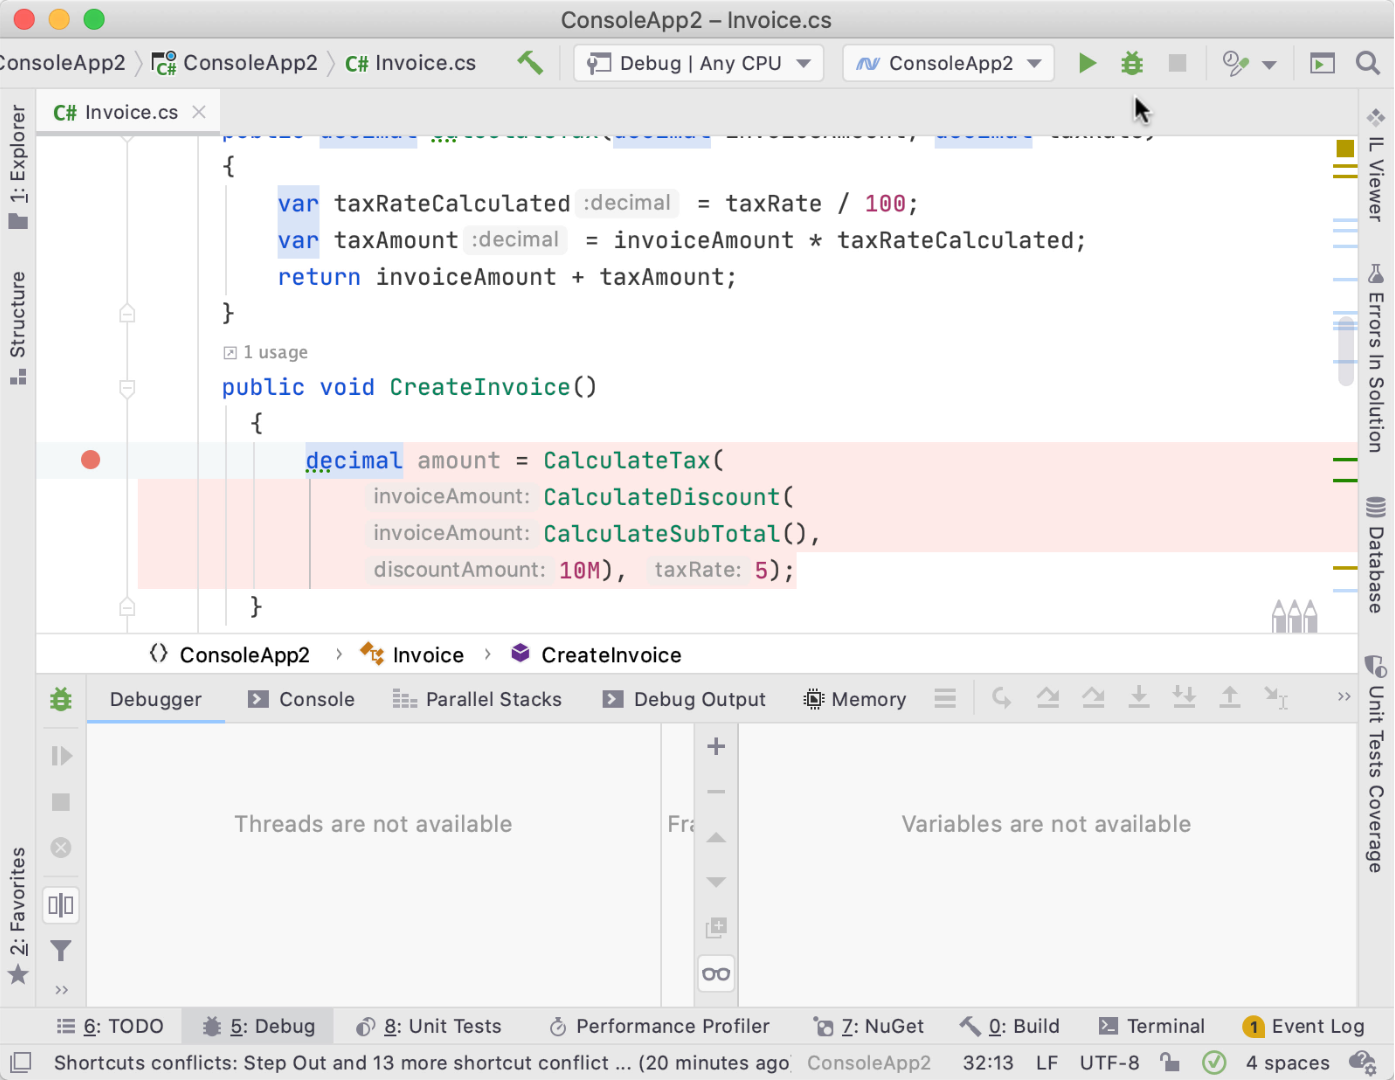
Debugging is hard. But Rider’s Smart Step Into feature makes it easier! Often, when debugging, we have multiple expressions in a single line of code, and it’s hard to tell which statement is executing and when.
Smart Step Into allows you to debug expressions while remaining on a line of code, without having to leave that line to see what’s going on. This is now enabled by default!
Note this setting is configurable at Build, Execution, Deployment | Debugger | Stepping | .NET Languages | Always do Smart Step Into.
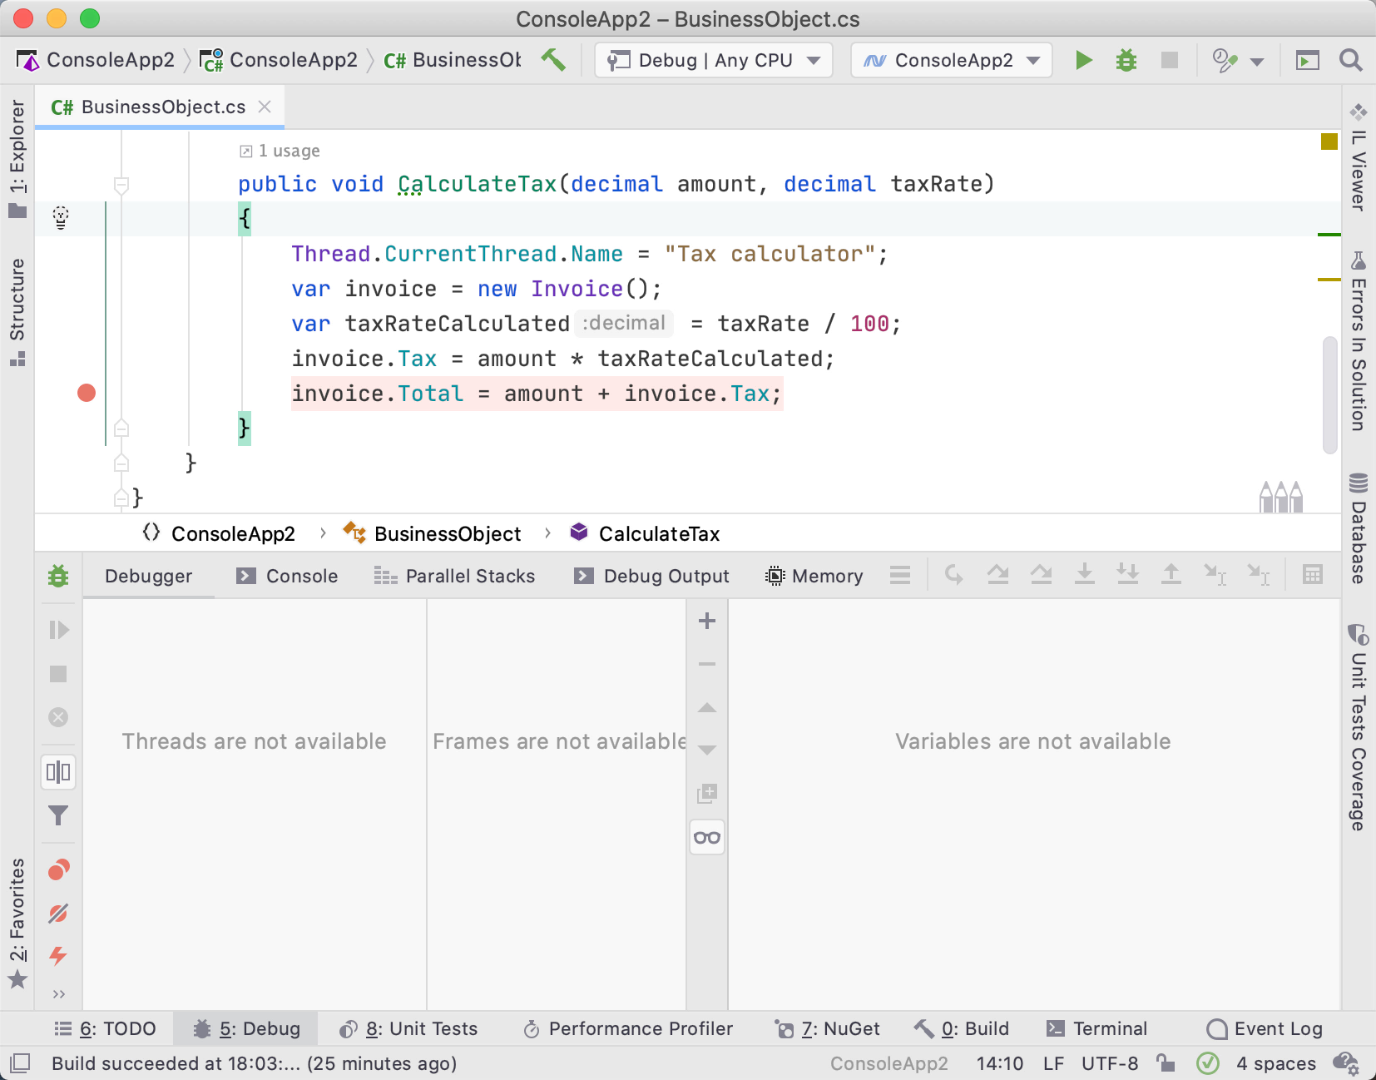
Method breakpoints
Rider now offers Method Breakpoints so you can break at the first execution of a method, with options to suspend, log, stack trace, and more. Use Ctrl+Alt+B/⌘+⌥+B to show breakpoints, then Ctrl+N/Cmd+N to add a method breakpoint (or any kind).
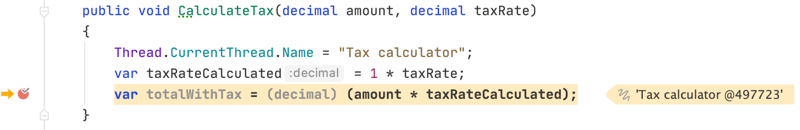
Thread name display
Though you use easy-to-read and descriptive variable names, it doesn’t help much when thread variable names don’t show up in debugging or analysis tools. For those writing multi-threaded code, you can now easily check out which thread is displayed on the execution line.
Threads are assigned a number by default, but those who set the name of their threads will welcome that it’s now easy to see which thread is currently executing.
Debugger window changes
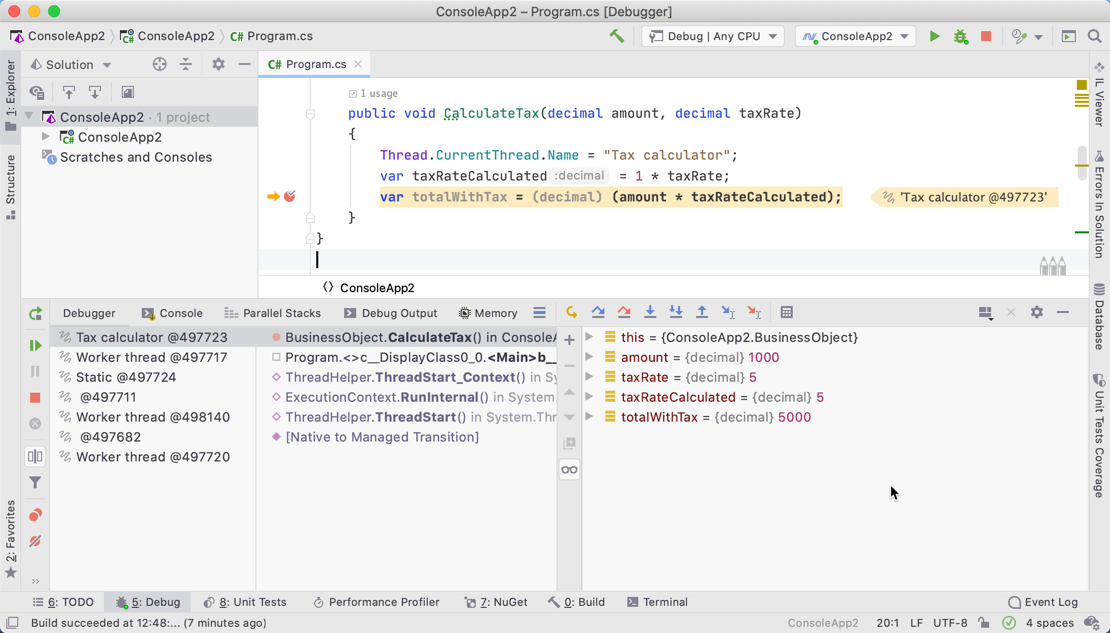
There have been a few changes made to the Debugger tool window. As you can see in the following image, threads have been incorporated into the window in a more seamless manner. If threads are named, the names show in addition to the thread’s id.
Instead of showing a separate tab for threads, there is a quick access button along the left side for toggling the threads view, rather than threads view being visualized in a separate tab. Additionally, there’s a tool button located on the left side for detaching from processes, and a filter to hide or show frames.
Check out these other great features
Rider now has the ability to detach from processes initially started with the debugger, without terminating the app (RIDER-3800). This way, we don’t have to restart our application when we just wanted to detach the debugger.
You can now also execute the Skip to Here/Cursor action after stopping the debug session on an exception.
Some other updates:
- It’s possible to disable service messages in Debug Output (RIDER-16641).
- Fixed – stepping into explicitly implemented methods (RIDER-10014).
- The debugger supports the .NET Core x86 runtime.
- Minor bug fixes and enhancements.
We know some of you have been patiently waiting for Data Breakpoints. We’re expecting Data Breakpoints for .NET Core to be available in version 2020.2.
If you want to try out all these great debugging features, Rider 2020.1 is here, download it now!


