

.NET Tools
Essential productivity kit for .NET and game developers
Memory profiling on Linux and macOS with dotMemory 2020.2

Version 2020.2 EAP01 finally brings dotMemory to Linux and macOS! For these systems, dotMemory is currently available only as a command-line tool. The tool is free and lets you take and save memory snapshots. To analyze the snapshots, you still need the standalone version of dotMemory, which is only available on Windows.
What you can profile
Here’s the dotMemory compatibility list for Linux and macOS:

How it is distributed
The command-line tool is distributed in two forms:
- A .tar.gz archive (macOS | Linux): Download it from the JetBrains website, unpack, and run
dotMemory.shwith the required arguments. - A NuGet package at nuget.org (macOS | Linux): Using this could be more convenient in automation scenarios (e.g. on a CI/CD server): reference the package in your project, and run
nuget restoreto get the tool on your server.
How to use it
If you have already used the dotMemory command-line profiler on Windows, you will find almost no differences (the only difference is the reduced set of commands, as some types of apps like IIS are not available on Linux and macOS). For those who haven’t, let’s go through the basics.
Get a snapshot of a running .NET Core app
The fastest way to get a snapshot of a running process is to use the get-snapshot command. For example, this command takes gets a snapshot of the process with ID 5589:
./dotMemory.sh get-snapshot 5589
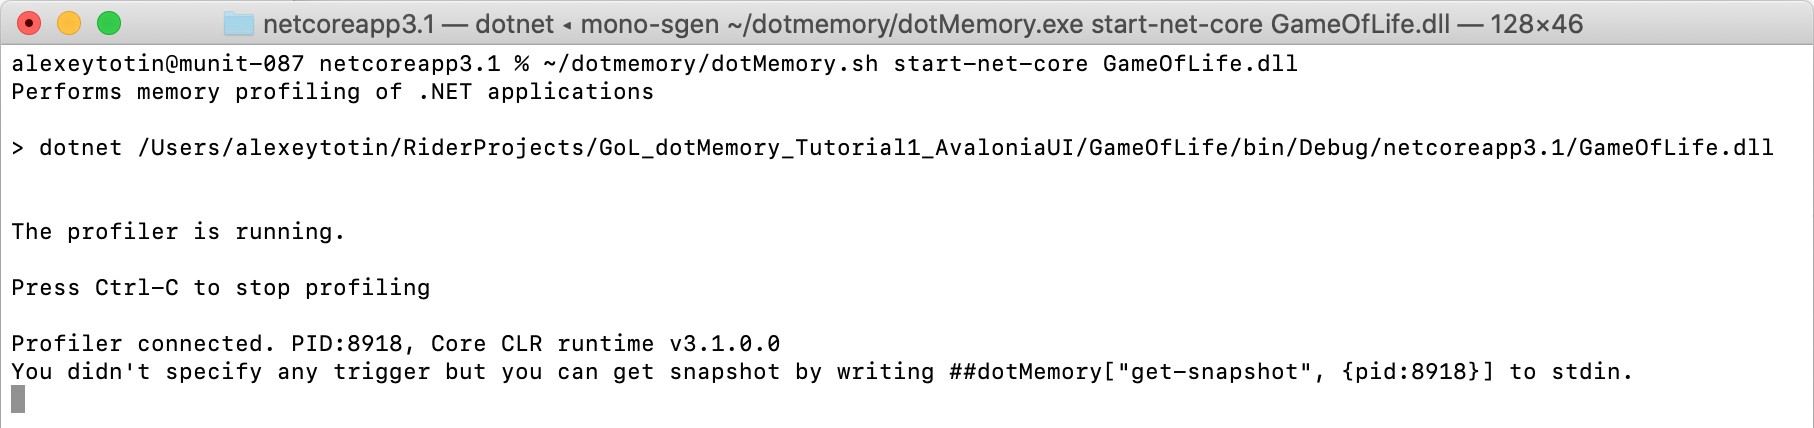
Run a .NET Core app under profiling
Note that to perform get-snapshot, dotMemory has to attach to the process, and therefore it has the same limitations as the attach command: it’s applicable only to processes that use .NET Core version 3.0 or later on Linux or .NET 5 on macOS. So, to profile an app that uses .NET Core 2.2 or earlier, you should run this application under profiling with the start-net-core command. For example:
./dotMemory.sh start-net-core MyKestrelAspApp.dll
But how can you get snapshots? One of the ways is to send commands to dotMemory’s stdin. For example, to get a snapshot, send:
##dotMemory["get-snapshot"]
Another way to get a snapshot is to set a condition for taking the snapshot. This can be great for monitoring applications. For example:
./dotMemory.sh start-net-core --trigger-timer=10h MyKestrelAspApp.dll
This will start MyKestrelAspApp.dll and take snapshots every 10 hours../dotMemory.sh start-net-core --trigger-mem-inc=50% --trigger-delay=5s MyKestrelAspApp.dll
This will start MyKestrelAspApp.dll and take snapshots when memory consumption increases by 50% compared to when the profiling session started. The 5-second delay is used to ignore the application’s startup activities.
We invite you to download the tool and try it on Linux and macOS for yourself. As always, your comments are greatly appreciated.
P.S. If you are looking at other possibilities for profiling your code, take a look at dotMemory self-profiling API. It lets you profile your application right from the source code, is distributed as a NuGet package, and works on all platforms.


