

.NET Tools
Essential productivity kit for .NET and game developers
Introducing Pausepoints for Unity in Rider 2020.2

We’ve only just started the EAP for Rider 2020.2, but it’s already got plenty of goodies for Unity development. For example, we’ve done a huge amount of work to reduce memory overhead when parsing your assets, and Rider will now find usages and show Inspector values of more types, methods and fields, even inside prefab modifications!
But today I’d like to introduce a new feature that we’re really excited about, a feature that you never knew you needed, but we think you’re going to love!
We’re calling it a “pausepoint” and it’s a special kind of breakpoint that doesn’t stop the debugger in Rider. Instead, when it’s hit, it will switch the Unity Editor into pause mode, allowing you to inspect your game, make modifications and resume when ready.
Let’s back up a little.
What’s the problem we’re trying to solve?
Developing in Unity, you need to live in two worlds – the Unity Editor and your C# editor. If you want to debug your game, you need to set breakpoints in your C# script files. When hit, the entire Unity Editor environment is stopped – the native game engine as well as the managed C# scripts running both your game and the editor itself.
You can then use the debugger to inspect your call stack, look at and change values of fields and variables and even evaluate expressions. But your game is still suspended, as is the Editor – you can’t use the Editor to select or move game objects, or look at and change values in the Inspector.
What if you could get the best of both worlds? Say hello to pausepoints.
Set a pausepoint in code, and when hit, it puts the Unity Editor into pause mode at the end of the current frame. The Editor is still fully responsive. You can’t look at values in Rider’s debugger, but you can now use the Unity Editor to select game objects, view the Inspector, change values and move objects around. When you’re done, just click the pause button in the Editor to continue playing.
Of course, you could just hit the pause button in Unity and get this at any time, but a pausepoint allows you to do this as part of your debugging workflow. Got a piece of code, and you don’t know what’s going on when it gets executed? Set a pausepoint, and the game will automatically pause and you get to examine the state of the game in the Inspector. Most importantly, the game will pause at the end of the frame that is currently being executed.
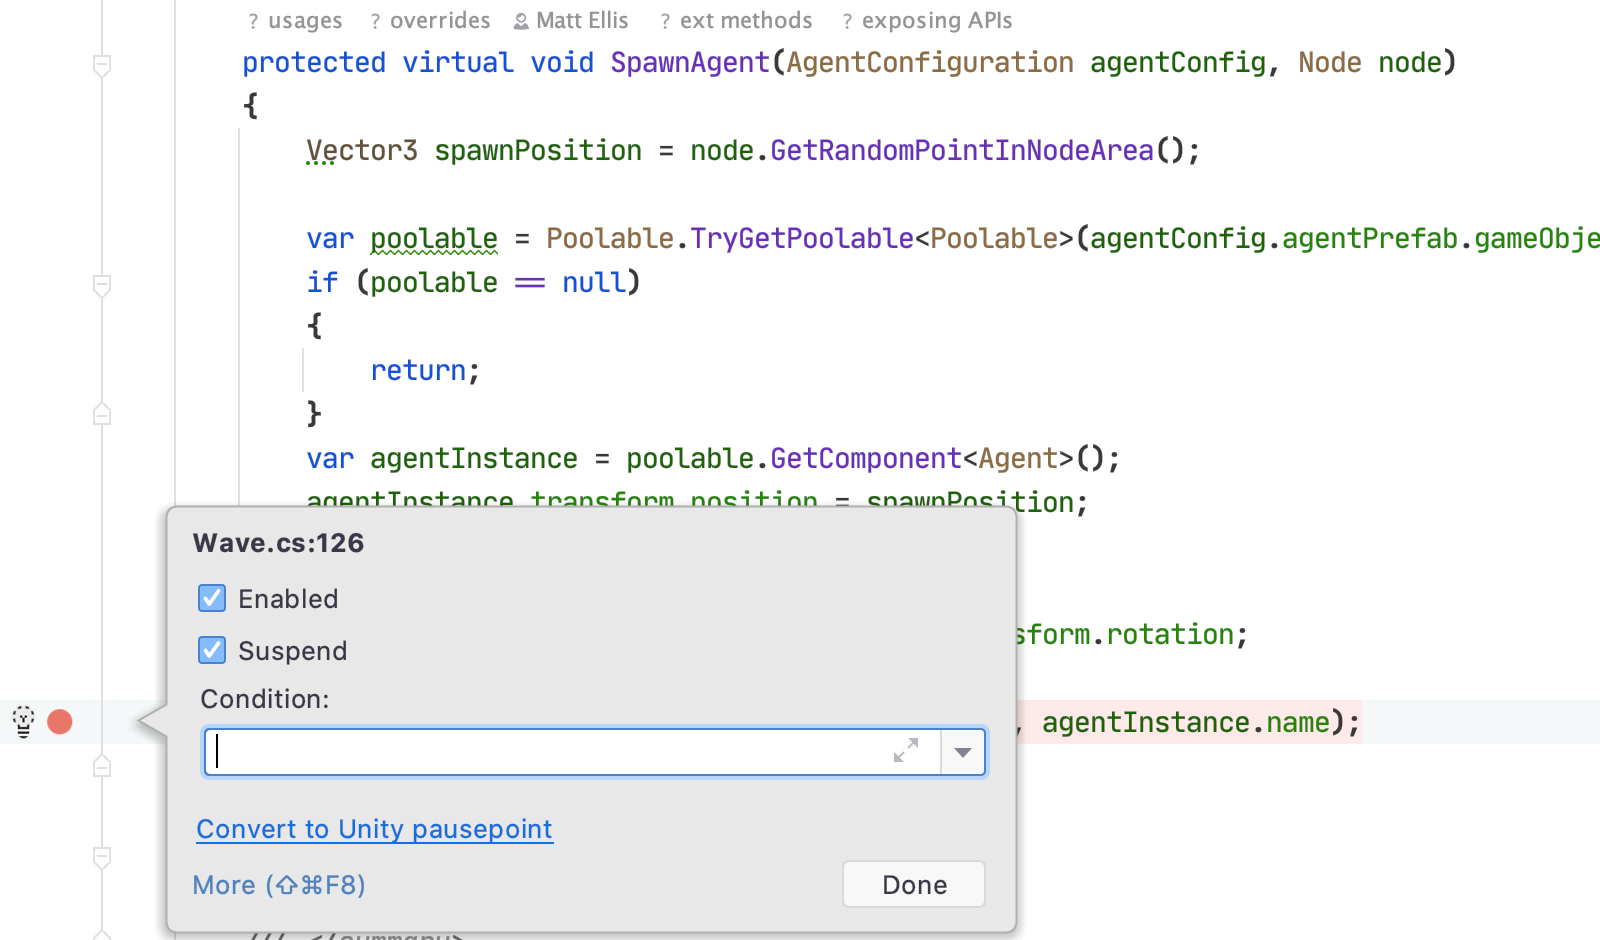
So how do you create a pausepoint? First, set a breakpoint, as normal, by clicking in the gutter next to a line of code. Then right click on the icon to show the options popup. From here you can enable/disable the breakpoint, log a message when it’s hit, set a hit count and more. For Unity projects, you’ll also get a Convert to Unity pausepoint link. Click this and you’re good to go! Whenever this breakpoint is hit, Unity will switch to pause mode.
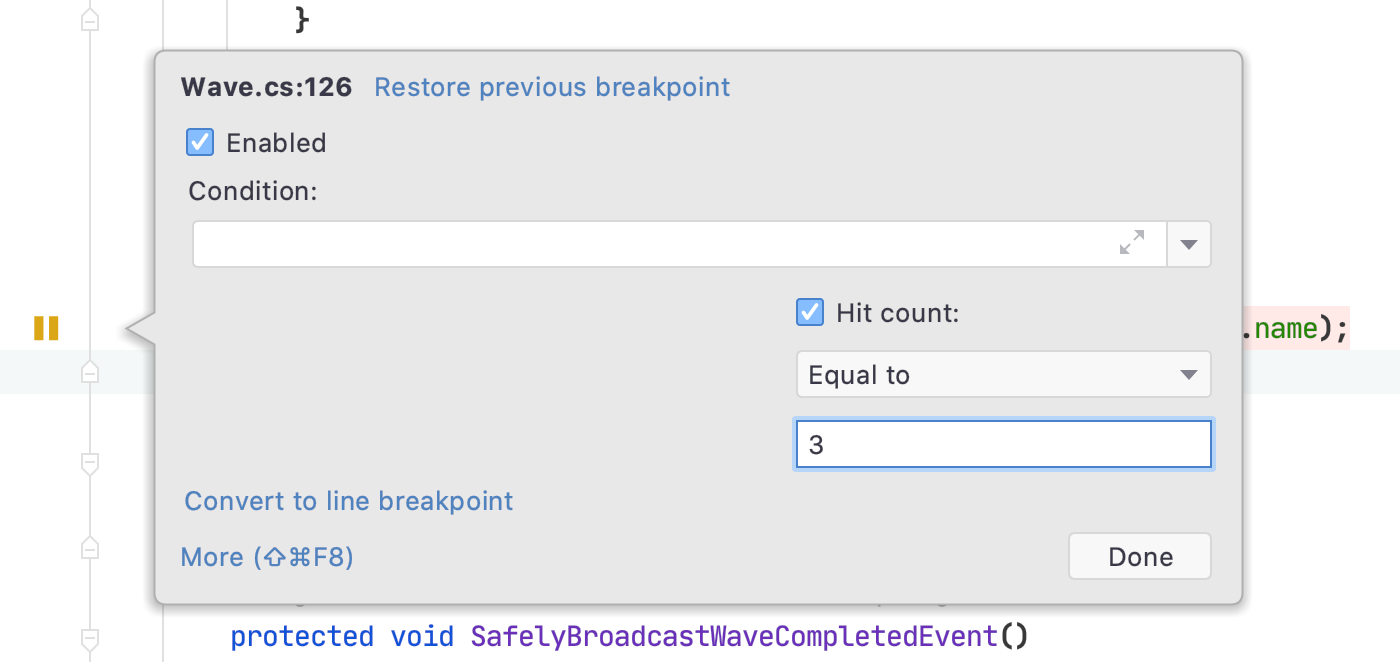
Things get more interesting when you combine this with conditions, hit counts and dependent breakpoints. In the movie above, you can see that the pausepoint is set up with a hit count of three – this allows us to do something fun. What if we want the third enemy in a wave to be stronger, faster or flying? Set the pausepoint in the wave spawner class, set a hit count of three and run the game. When the third enemy is spawned, the game automatically pauses. We can then select the newly created enemy object, go into the Inspector and modify values. We can even move the game object around!
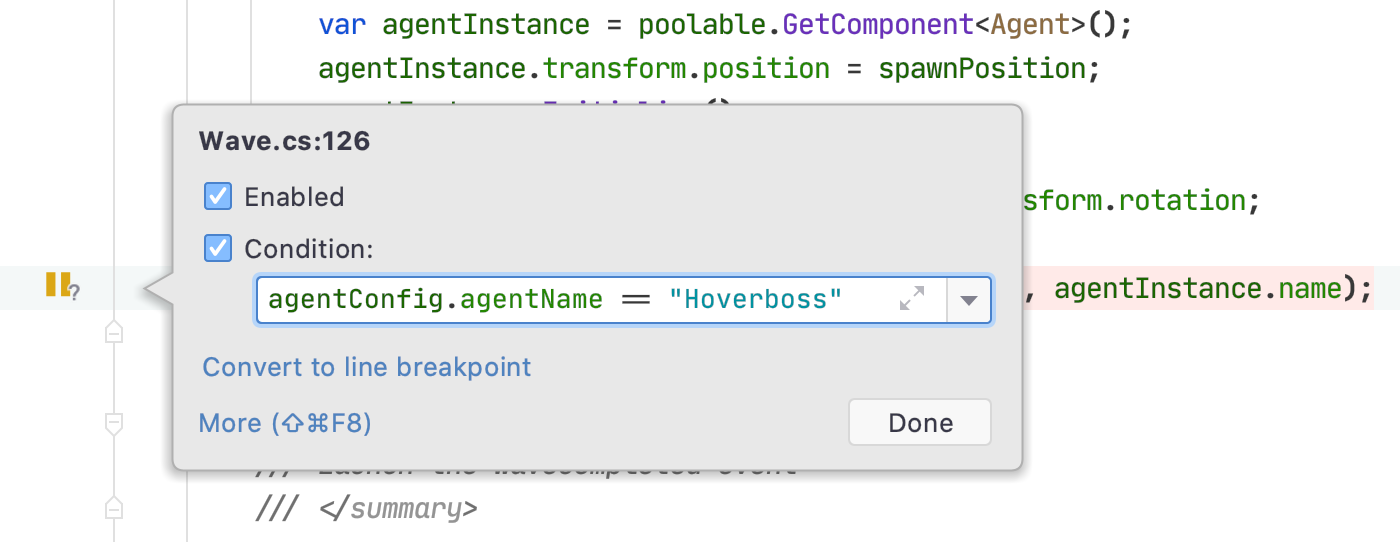
We can do similar things with a conditional pausepoint. Add an expression, and the pausepoint will only pause the Unity Editor when that expression evaluates to true. Perhaps we want to pause when the “hoverboss” enemy is randomly spawned:
And we can even combine this with dependent breakpoints. This is a fantastic feature for advanced debugging. We often find ourselves wanting to debug some code that is called frequently throughout the lifetime of the game, but we’re only interested in it after some other event has happened. Let’s say we want to debug the “take damage” routines, but only after a shield has expired. Because we take damage at all points during the game, this can be very hard or frustrating to debug. Dependent breakpoints make this much easier.
We can set a breakpoint (an actual breakpoint, not a pausepoint) in the “shield expired” method. Use the advanced options to uncheck Suspend – when this breakpoint is hit, nothing actually happens in the debugger. Sounds weird, but stick with me.
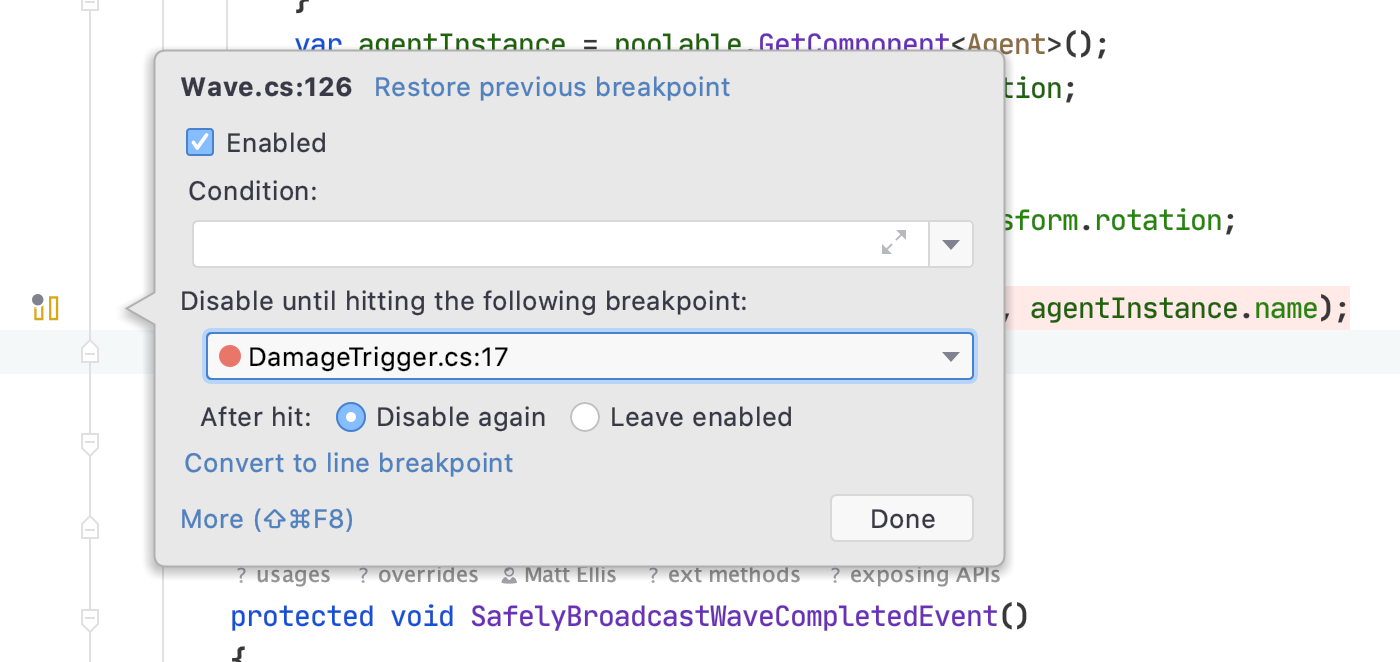
We then create another breakpoint in the “take damage” method. Right click and select the More link to show advanced options. Convert it to a pausepoint and then select the “shield expired” breakpoint we just set in the Disable until hitting the following breakpoint drop down list.
When we run the game, the pausepoint in “take damage” is disabled until the breakpoint in “shield expired” is hit. This means we can play the game and take damage without being interrupted by any breakpoints or pausepoints. But once we’ve collected a shield, and it’s expired, the “shield expired” breakpoint is hit. The debugger does not suspend, but keeps running – only now the pausepoint is enabled. The next time we “take damage”, the pausepoint is hit, and Rider switches the Unity Editor into pause mode.
We’re very excited to introduce this feature. We think it’s going to be a great addition to the way you debug your projects. We’re also very interested to hear what you think. Download the EAP today, try out pausepoints and let us know how you get on! You can leave us a comment here, or create an issue in YouTrack.


