.NET Tools
Essential productivity kit for .NET and game developers
dotCover 2020.3 Improvements And Updates

Time to get excited: dotCover 2020.3 is here! Get ready for quality-of-life improvements such as coverage filtering by target framework, different build modes for continuous testing, updates to provide better coverage highlighting, command-line tooling enhancements, and more! Let’s have a look.
Filter Coverage Results By Target Framework
With the release of .NET 5 (and .NET 6 around the corner), developers have more target frameworks than ever. We may find ourselves needing to support more than one target framework as we transition to a single target framework (TFM). We can choose to run dotCover for all defined TFMs, or selectively run our code coverage analysis on a specific TFM.
In the following example, we are targeting both net5.0 and netcoreapp3.1 TFMs.
<TargetFrameworks>net5.0;netcoreapp3.1</TargetFrameworks>
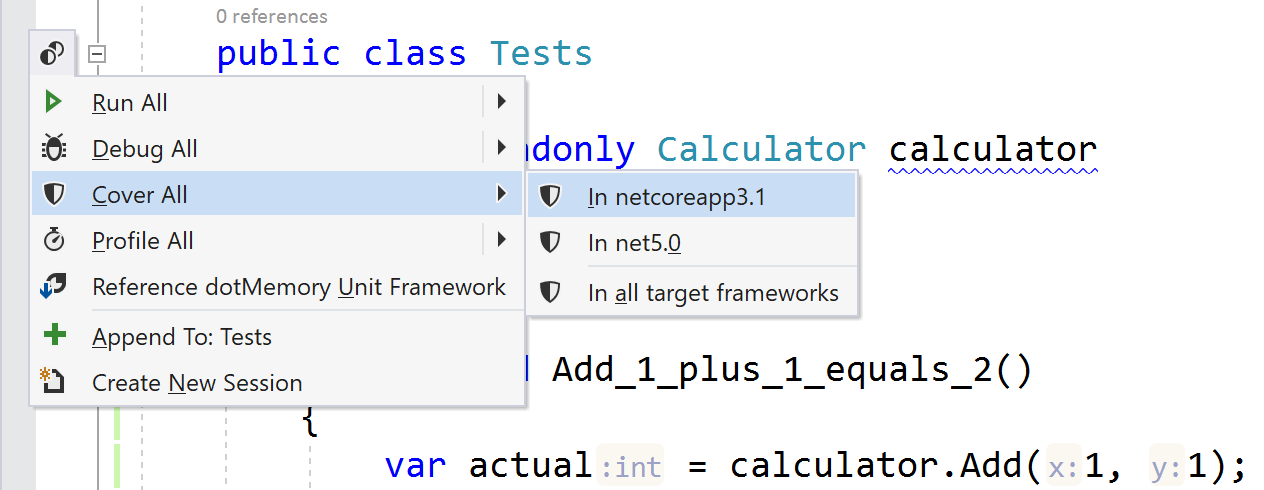
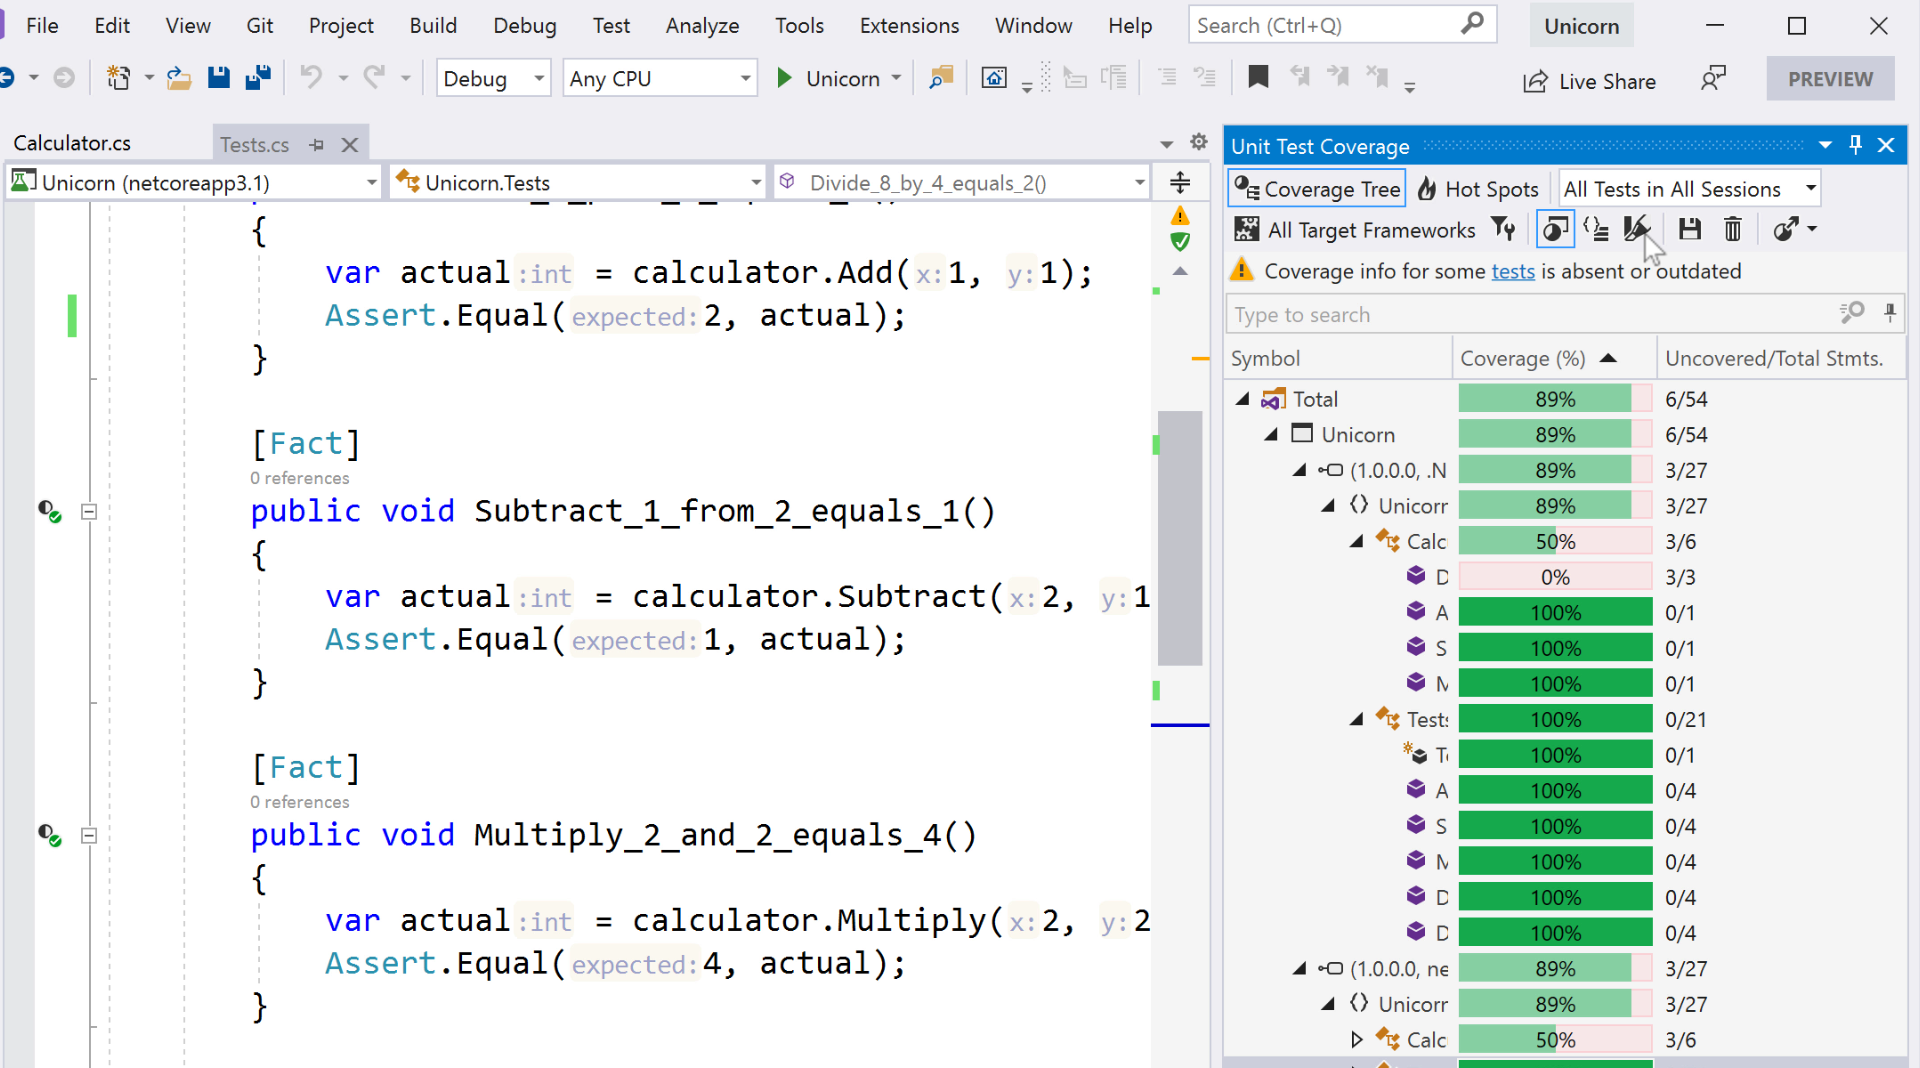
Within the Unit Test Coverage tool window, we can choose between All Target Frameworks, .NETCoreApp 3.1, and .NETCoreApp 5.0.

We can also select the same setting from the gutter next to our test classes.
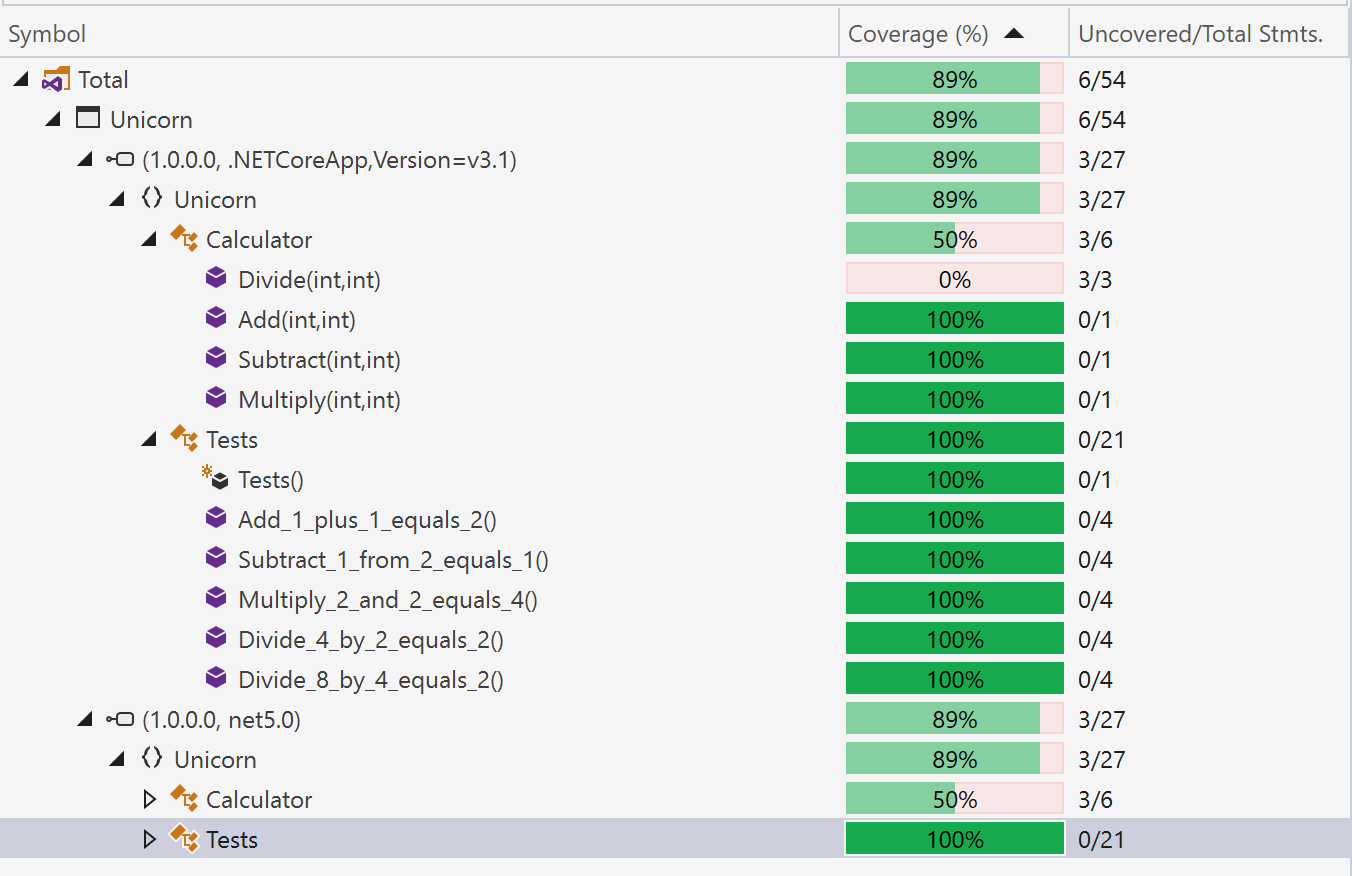
The Unit Tests coverage results display each TFM results under the columns Symbol, Coverage (%), and Uncovered/Total Stmts. Results will vary depending on our usage of preprocessor directives and TFM specific features. While everyone benefits from this feature, we imagine folks targeting multiple platforms and operating systems will see the most benefits.
Continuous Testing Build Modes
We’re introducing new Continuous Testing Build Modes in dotCover 2020.3. Folks can now run their unit tests along with code coverage analysis in the following scenarios:
- Run All Tests
- Run New and Outdated Tests
- Cover New and Outdated Tests

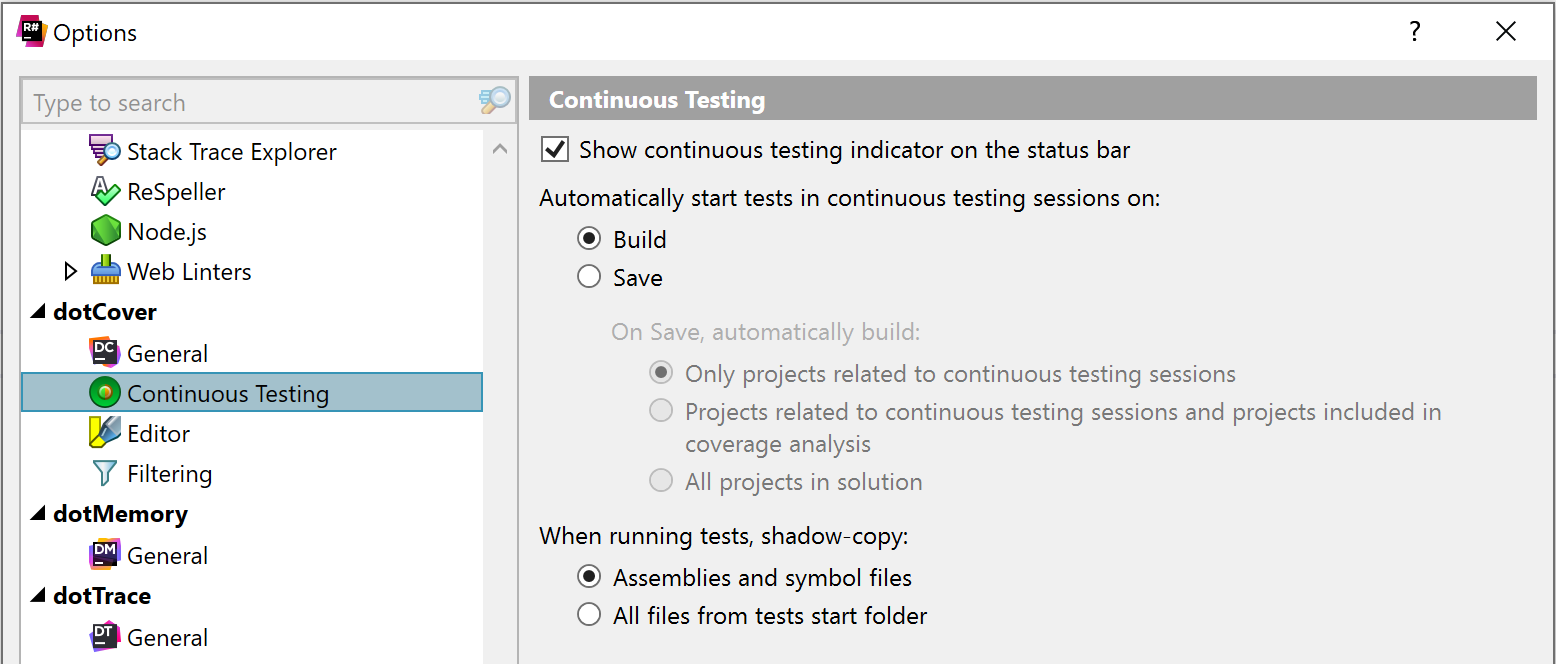
In the Continuous Testing preferences, developers can choose when to run tests. Tests can execute when developers build their solution, or for folks looking for a tighter feedback loop, we can configure our coverage tests to run on every file save.
Drop Coverage Data
Working in a distributed environment with team members can invalidate our code coverage results in a blink of an eye. Pulling down new features and bug fixes can contribute churn to our local development process. When we suspect code results are no longer relevant, we can utilize the drop coverage data to reset our coverage tree. The action can be found in the Unit Test Coverage pane.

Outdated Coverage
Coding and Testing are part of a virtuous loop, but our code coverage may lag a bit behind in that loop. dotCover now warns us about coverage results that may be outdated since the last run. A friendly reminder that the coverage results we see in the gutters, code tree, and highlighting may not represent our application’s current coverage.
Here’s an example of code tree dulling coverage results that may be effected by code changes.
Additionally, here are the gutters in our code warning us that coverage results may not be current.
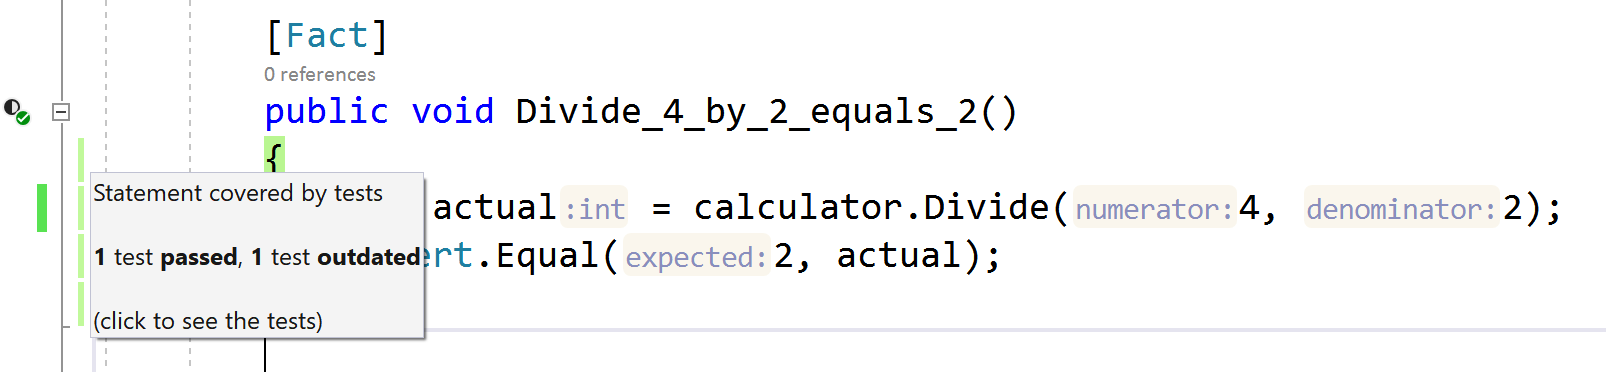
The outdated warnings are useful for folks not taking advantage of the continuous testing options in the previous section.
Console Path Patterns
dotCover isn’t only a tool used in your favorite IDE. dotCover also supports command line scenarios, especially helpful for reproducing coverage reports in continuous integration environments. We recommend reading the dotCover documentation on how to get started with command-line tooling.
As a quick-start, .NET Core and .NET 5 users can add the JetBrains.dotCover.DotNetCliTool package to their unit testing projects with the following csproj XML.
<PackageReference Include="JetBrains.dotCover.DotNetCliTool" Version="2020.3.0-eap08">
    <PrivateAssets>all</PrivateAssets>
    <IncludeAssets>runtime; build; native; contentfiles; analyzers</IncludeAssets>
</PackageReference>
From here, folks can run dotnet cover test from the unit test project directory.
With the release of 2020.3, command-line tool users can now use path patterns in their calls to merge, delete, and list commands. Helpful when dealing with multiple unit test projects that are part of one solution. Existing merge.xml configuration files may look like the following:
<?xml version="1.0" encoding="utf-8"?>
<MergeParams>
    <Source>Snapshot1.dcvr</Source>
    <Source>Snapshot2.dcvr</Source>
    <Source>Snapshot3.dcvr</Source>
    <Output>MergedSnapshots.dcvr</Output>
</MergeParams>
Now users can condense these files to:
<?xml version="1.0" encoding="utf-8"?>
<MergeParams>
    <Source>Snapshot*.dcvr</Source>
    <Output>MergedSnapshots.dcvr</Output>
</MergeParams>
For solutions with many test projects this helps ease the burden of adding new entries. Read more about covering multiple projects at our official documentation.
Highlighting Settings
Highlighting overlooked areas in our code coverage is excellent when planning what tests to write next. We also want developers to jump quickly back into coding distraction-free. dotCover now provides multiple places that developers can toggle highlighting and gutter marks.
For Rider users, the pencils menu provides the ability to toggle dotCover display hints features.
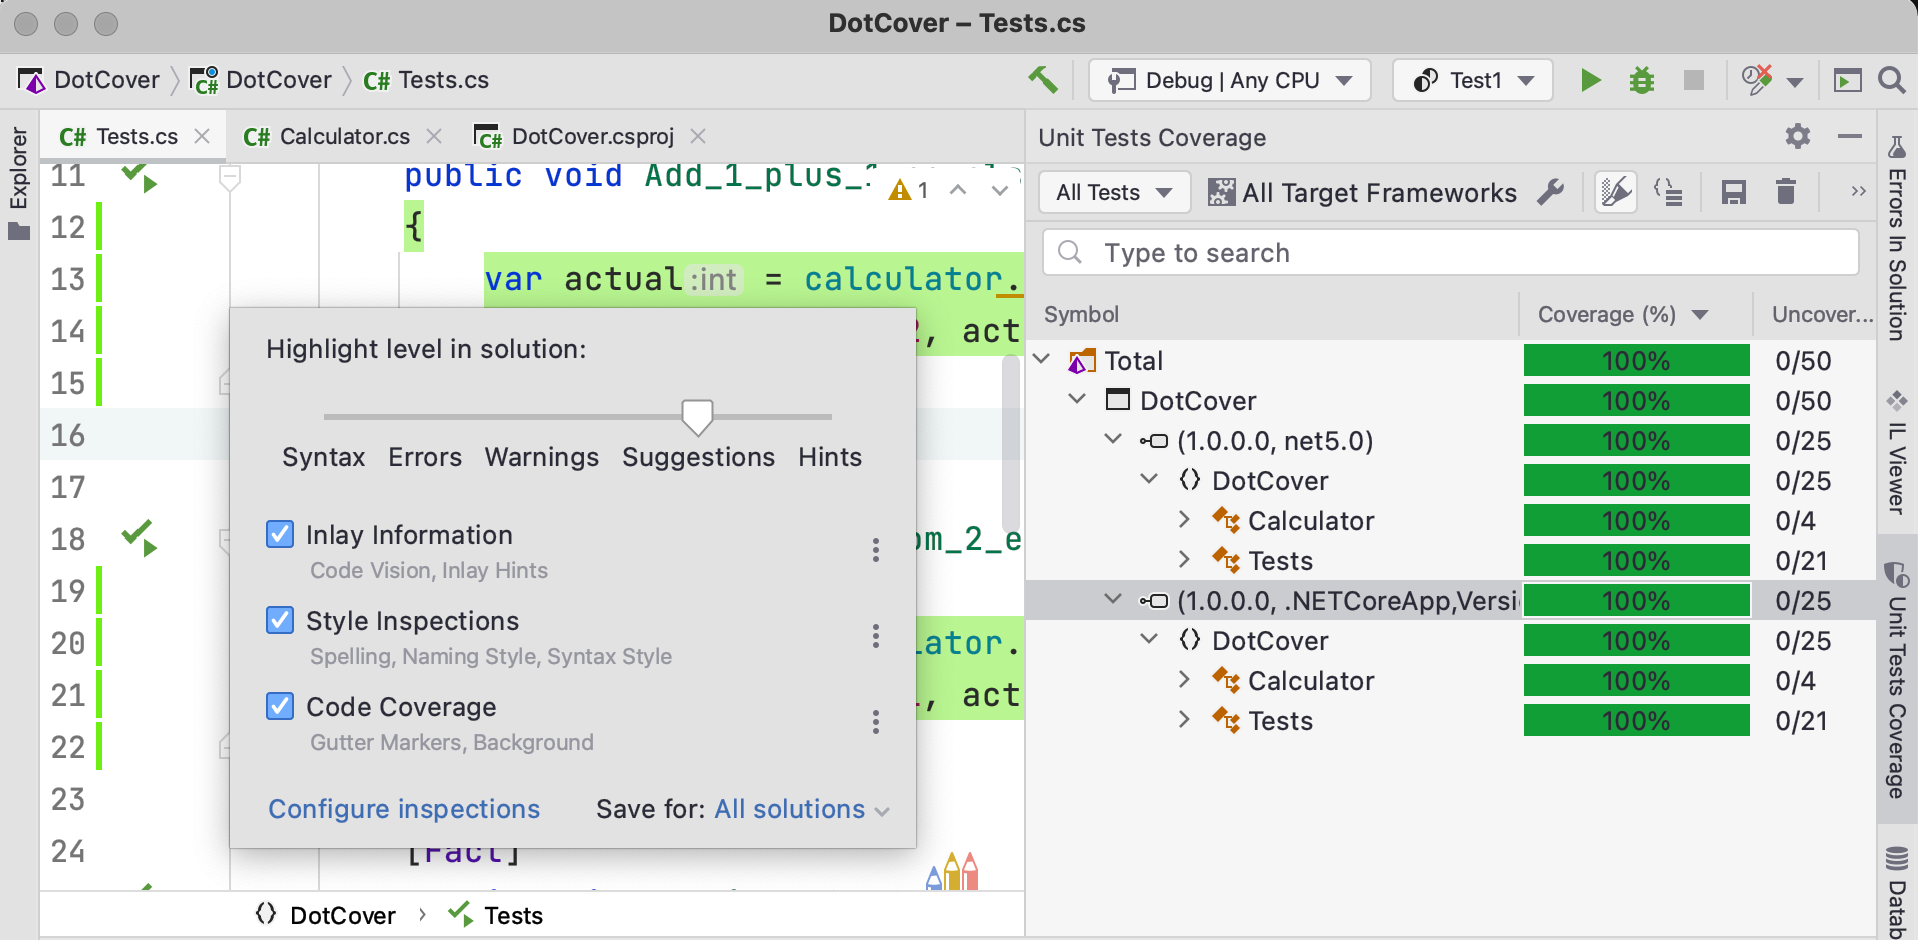
Both ReSharper and Rider users can toggle highlight settings in the Unit Test Coverage window using the highlight icon. In the preview below, we’ve enabled line background highlighting.
Conclusion
Code coverage is an integral part of any unit testing strategy, giving us ideas for improving our test fixtures’ quality. We hope that you find these features helpful on your unit testing journey and the ultimate goal of delivering high-quality solutions to your users. Please leave a comment below, and thank you as always!
Download dotCover 2020.3 and give it a try!