.NET Tools
Essential productivity kit for .NET and game developers
Sherlock Holmes and the case of a crashing devenv.exe

One of our customers was seeing crashes of Visual Studio and ReSharper, because of what looked like an out of memory situation. Visual Studio with ReSharper would crash loading a large solution. We expected a memory leak, or fragmentation of the Large Object Heap (LOH). But that was not the case.
In this post, let’s look at an interesting issue that we investigated (and resolved) during the past release cycle. Grab your Sherlock Holmes coat and hat, and follow along for this story from the development team! 🔍
Looking at the crime scene…
The bug report we received contained the following information:
After an update of ReSharper, I’m seeing Visual Studio crash after a few seconds. This happens in a Visual Studio solution with about 210 mixed (VB/C#) projects, and in a smaller solution with only 15 projects.
The solution is loaded, and after a few seconds, devenv.exe crashes.
We started looking into the issue, and asked if our customer could provide us with a memory snapshot and/or crash dump. They were very helpful, and provided us with several of them.
A large part of Visual Studio and ReSharper is written in .NET, and we expected the crash dump to make it crystal clear why this was happening. We expected to see a managed exception in the crash dump, or a very visible object set in the included memory dump.
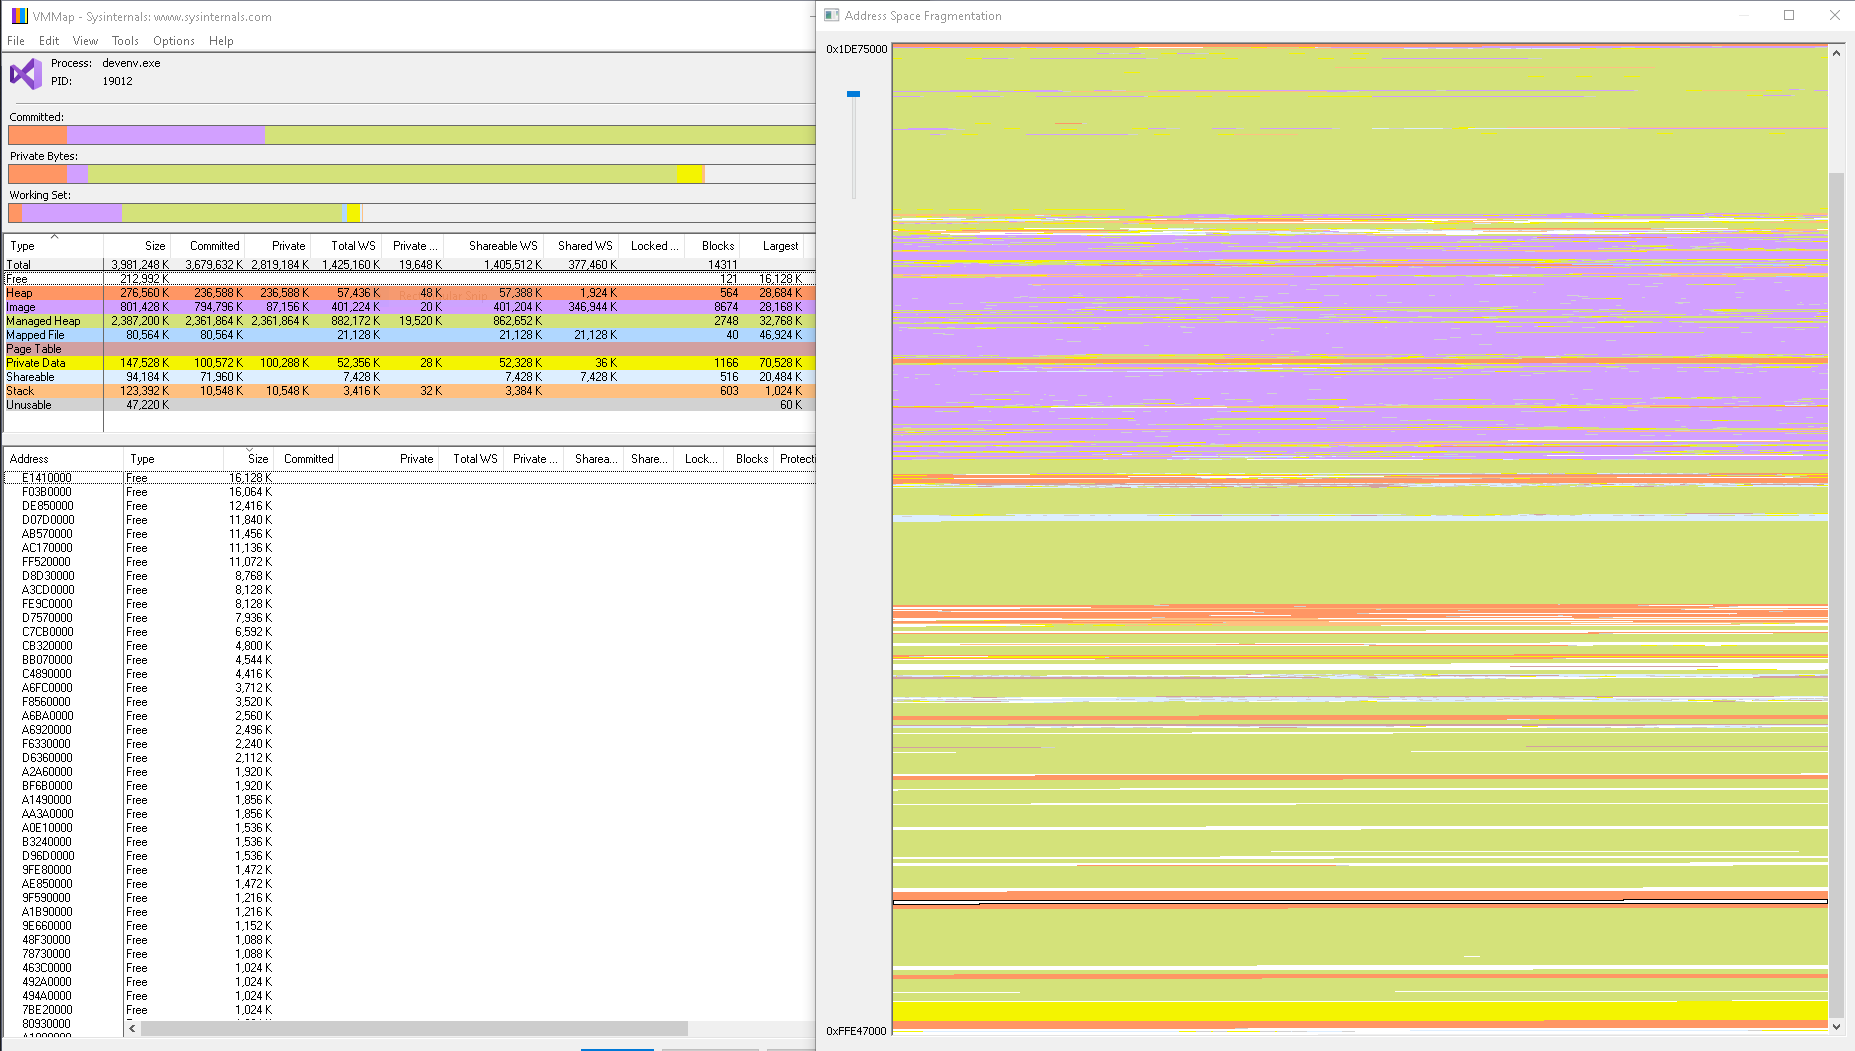
We were surprised when we saw the memory dump did not give away any clues. Both managed and unmanaged memory usage seemed normal. Fragmentation of memory was also normal. Big enough contiguous blocks of memory were being used, so fragmentation did not seem a likely cause of this crash either.
The good news was that the crash dumps all shared the following stack trace in native code:
KERNELBASE!RaiseException+0x62
leveldb!_CxxThrowException+0x66
leveldb!__scrt_throw_std_bad_alloc+0x1c
WARNING: Frame IP not in any known module. Following frames may be wrong.
0x3de8f694
leveldb!std::allocator<char>::allocate+0x1f
leveldb!std::basic_string<char,std::char_traits<char>,std::allocator<char> >::append+0xa5
leveldb!leveldb::BlockBuilder::Add+0xc1
leveldb!leveldb::TableBuilder::Add+0x125
leveldb!leveldb::BuildTable+0x161
leveldb!leveldb::DBImpl::WriteLevel0Table+0x15d
leveldb!leveldb::DBImpl::CompactMemTable+0x67
leveldb!leveldb::DBImpl::BackgroundCompaction+0x45
leveldb!leveldb::DBImpl::BackgroundCall+0x63
leveldb!leveldb::`anonymous namespace'::WindowsEnv::BGThread+0x10e
leveldb!std::_LaunchPad<std::unique_ptr<std::tuple<void (__thiscall leveldb::`anonymous namespace'::WindowsEnv::*)(void),leveldb::A0x817e9933::WindowsEnv >,std::default_delete<std::tuple<void (__thiscall leveldb::`anonymous namespace'::WindowsEnv::)(void),leveldb::A0x817e9933::WindowsEnv *> > > >::_Go+0x8a
leveldb!std::_Pad::_Call_func+0xa
leveldb!thread_start<unsigned int (__stdcall*)(void *)>+0x58
kernel32!BaseThreadInitThunk+0x19
ntdll!__RtlUserThreadStart+0x2f
ntdll!_RtlUserThreadStart+0x1b
All of the crash dumps were created when something was going on in libleveldb.dll, the LevelDB library we’re using in ReSharper. At least we now knew where to look!
What is LevelDB and how is ReSharper using it?
LevelDB is a fast key-value storage library written at Google, that provides an ordered mapping from string keys to string values. It’s widely used, for example, to power IndexedDB in the Chrome browser, a MariaDB storage engine based on LevelDB, and more.
As a database engine, LevelDB is fairly simple. Keys and values can be byte arrays, and are written to disk. Interaction with the database works with only three operations (get, put, and delete), and they are atomic.
In ReSharper, we rely on LevelDB for storing caches and indexes. Whenever you press Ctrl+T, and search for a type or symbol, ReSharper checks the LevelDB database for results. Searching for text? Go to Text helps you find text more quickly because all text is indexed. Other caches contain information about unit tests in your solution, file names, and more.
The keys in ReSharper are typically used to identify a certain data point, and values can be of different types, depending on the type of data we want to store. This can be a simple key/value map, a string that we need to store, or an n-gram data structure that powers textual search.
LevelDB internals
As mentioned earlier, LevelDB writes its data to disk. But it doesn’t do this directly when making a change to the database. LevelDB keeps a chunk of memory that is used to buffer updates, and is flushed to disk periodically. To ensure atomic updates, it also writes a log of changes to the disk immediately, so that changes that were not yet persisted can be replayed if needed for recovery.
As part of flushing the LevelDB memory to disk, compaction is performed in a background thread. Compaction typically merges smaller files on disk in larger files, and removes entries that were removed (or have old data that is now overwritten). The LevelDB docs have a good article that goes into more detail.
When LevelDB starts writing to disk, a new memory buffer is allocated. When writing finishes, the old memory buffer is discarded. This is all handled by one background thread, that processes pending writes (and compaction) sequentially.
Interviewing witnesses
Back to our memory crime scene investigation. We knew at this point that the crash originated from LevelDB’s background thread, so we decided to make a ReSharper build to log diagnostic data.
The LevelDB API exposes data about current memory usage in the aptly-named approximate-memory-usage property. We decided to log this information periodically, and ask our customer to try our custom ReSharper build. In the meanwhile, we also managed to reproduce the issue on some solutions, but not always, but this proved helpful in discovering trends.
In the logs we got back from the customer, we now saw our newly added logging in action, with statistics about LevelDB usage in terms of number of files on disk, and (mega)bytes being read and written.
08:44:18.502 |V| VsEventRecordsProvider | JetPool(S) #7:55 |
Category=memory, Name=SolutionCaches,
Bytes=105712050, Stats= Compactions
Level Files Size(MB) Time(sec) Read(MB) Write(MB)
--------------------------------------------------
    0     1       13         1        0      453
    1     0        0         1      478      177
    2    27       61         1      337      259
To our surprise, a lot of data was being written to LevelDB! As you can see in the last column above, we were seeing 450+ MB writes going from ReSharper to LevelDB. Keep in mind the metric is named approximate-memory-usage, and later troubleshooting revealed it’s indeed very approximate — it’s off by almost a factor 10 in the above example. But still, we were surprised.
If you remember from the internals section above, LevelDB flushes out data to disk and allocates new chunks of memory for its buffers. With these larger values, LevelDB would try to allocate additional buffers to hold data in memory, waiting for the background thread to flush them to disk. In one of the logs, we found this is where the crash originated: a std::bad_alloc while trying to allocate a new block of memory. Memory space in Visual Studio is limited (it’s a 32-bit process), and these allocations could fail because there’s insufficient memory, or memory is fragmented.
With this knowledge, we set out to find why and where we were writing this amount of data to our caches.
It was the butler
To troubleshoot the issue, we added more logging around writing values to caches. With another custom build, we were still able to reproduce the issue in some situations, but luckily, our customer offered to help as they could reproduce the crash on a particular solution.
With the help of some additional memory dumps, and additional logging, we found where the issue was coming from. We found two cases where ReSharper was caching a lot of data that would have to be written to disk.
The first case was in how we store unit tests that are discovered. We want to have this data available so we can show it in the UI of our test runner, but also to provide navigation, group tests in categories, and all that. For most solutions, even our ReSharper solution with over 140,000 tests, this data fits memory. But if you’re using test categories, which a lot of our users do when using test frameworks like NUnit and MSTest, the data structure we used grew more quickly. As a result, ReSharper needed to write this larger data structure to LevelDB, which in term needed more memory buffers.
A second case was in how we index NuGet packages. ReSharper gives you quick-fixes to reference NuGet packages, and keeps track of types and assemblies in NuGet packages. Our customer had a lot of package references, and a couple of them had lots of files inside the NuGet package, again requiring ReSharper to write a lot of data to LevelDB, which in turn would need more buffer space while flushing and compacting its database.
Fixing the issue
With the source of the issue discovered, and us trying to brute-force this situation in more places where we write data to LevelDB, we set out to work on a fix. We’re revisiting the data structure we write to LevelDB, so less data has to be flushed out.
In the case of unit test discovery, the metadata we stored was XML-based. A simple schema, but all those elements, attributes and brackets take up bytes on disk (and in memory buffers), so we’re optimizing that. We’re also compressing some data we flush into the LevelDB cache, to make sure we don’t need excess buffer space. We’re also reducing the size of data that is cached, using a smaller binary format.
Luckily, not every customer of ReSharper would run into this. It was a specific solution that caused the issue, but the resulting fixes and optimizations we’ve made will benefit every ReSharper customer.
Thanks for reading!

Subscribe to a monthly digest curated from the .NET Tools blog: