.NET Tools
Essential productivity kit for .NET and game developers
Updated Debugging Experience, UWP Apps, and Debug Windows Docker containers in Rider 2021.3

For Rider, 2021 is the year of debugging, debugging, debugging! In July’s 2021.2 EAP release, we’ve made several Blazor debugging updates. Now we’re following up with even more excellent debugging improvements in our current 2021.3 Early Access Preview (EAP) release.
It includes an updated UI for the debugger tool window, debugging of UWP applications, and the ability to debug applications running in Windows Docker containers.
Debugger UI Update
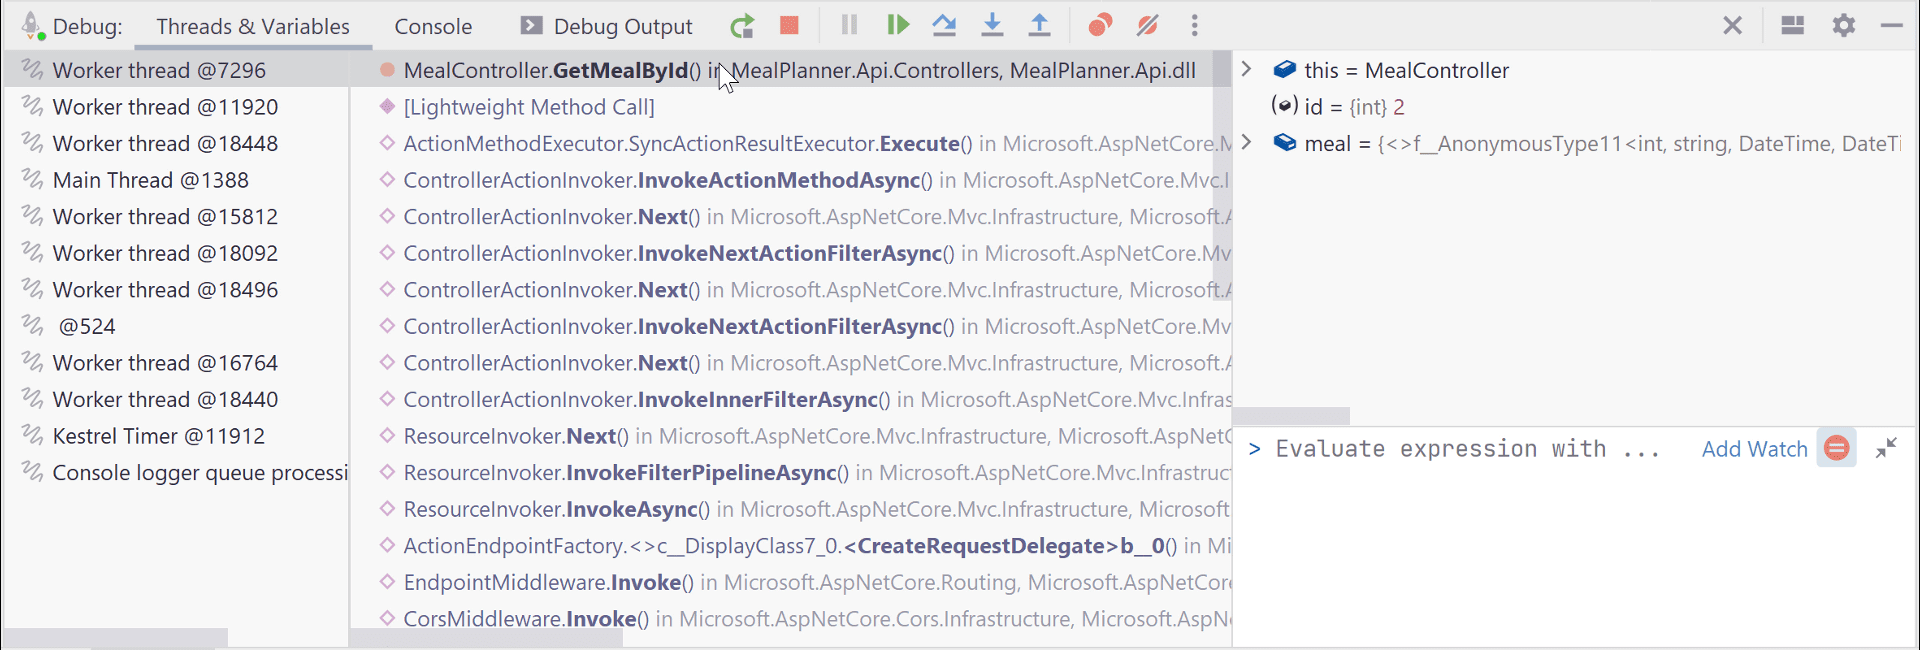
It is absolutely essential that developers have a good debugging experience. So we’ve done a bit of work and updated the Debug tool window so that it’s sleek and trim.
The Debug tool window displays the most accessed commands across the top of the tab, and direct access to less-used features context menus. By default, the Threads & Variables, Console, and Debug Output tabs are displayed, and other tabs can be revealed from the Options menu. Commands previously located on the left side have been merged with the Debug tool window’s top menu, or converted to contextual menu items.
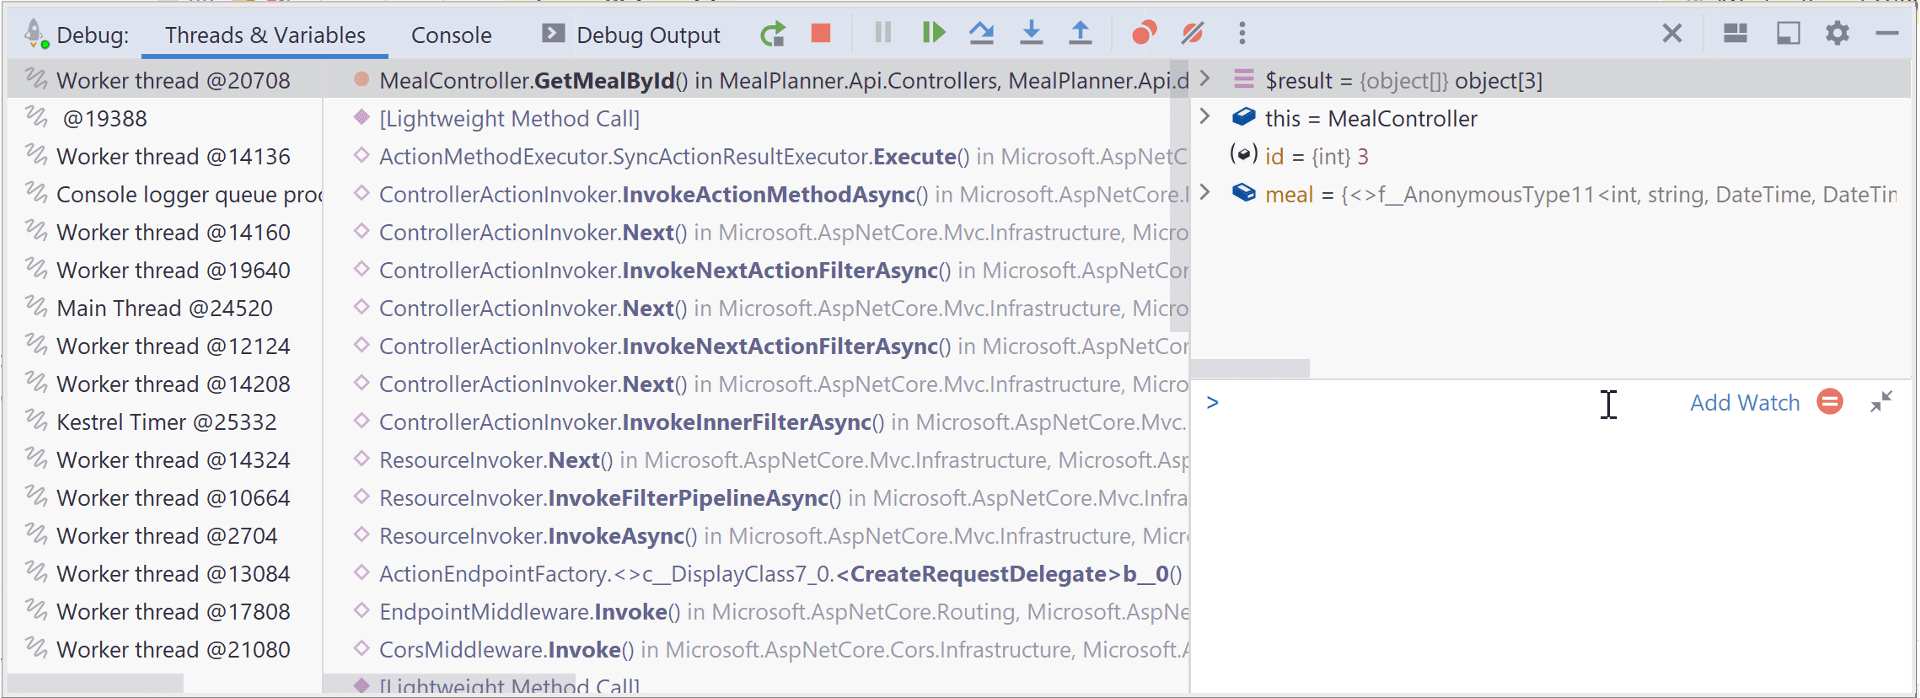
One detail that stands out is that Add Watch has been moved from the Variables view to the toolbar of the Immediate Window. Enter a watch expression by using the Add Watch action (Ctrl+Shift+Enter), or clicking Add Watch. Of course, you can still use the Immediate Window to reveal full details about an object as well as command history from this debugging session.
Common debugger settings are now found in the More | Settings drop-down for easier access (but they are also still available in the settings, under Build, Execution, Deployment | Debugger).
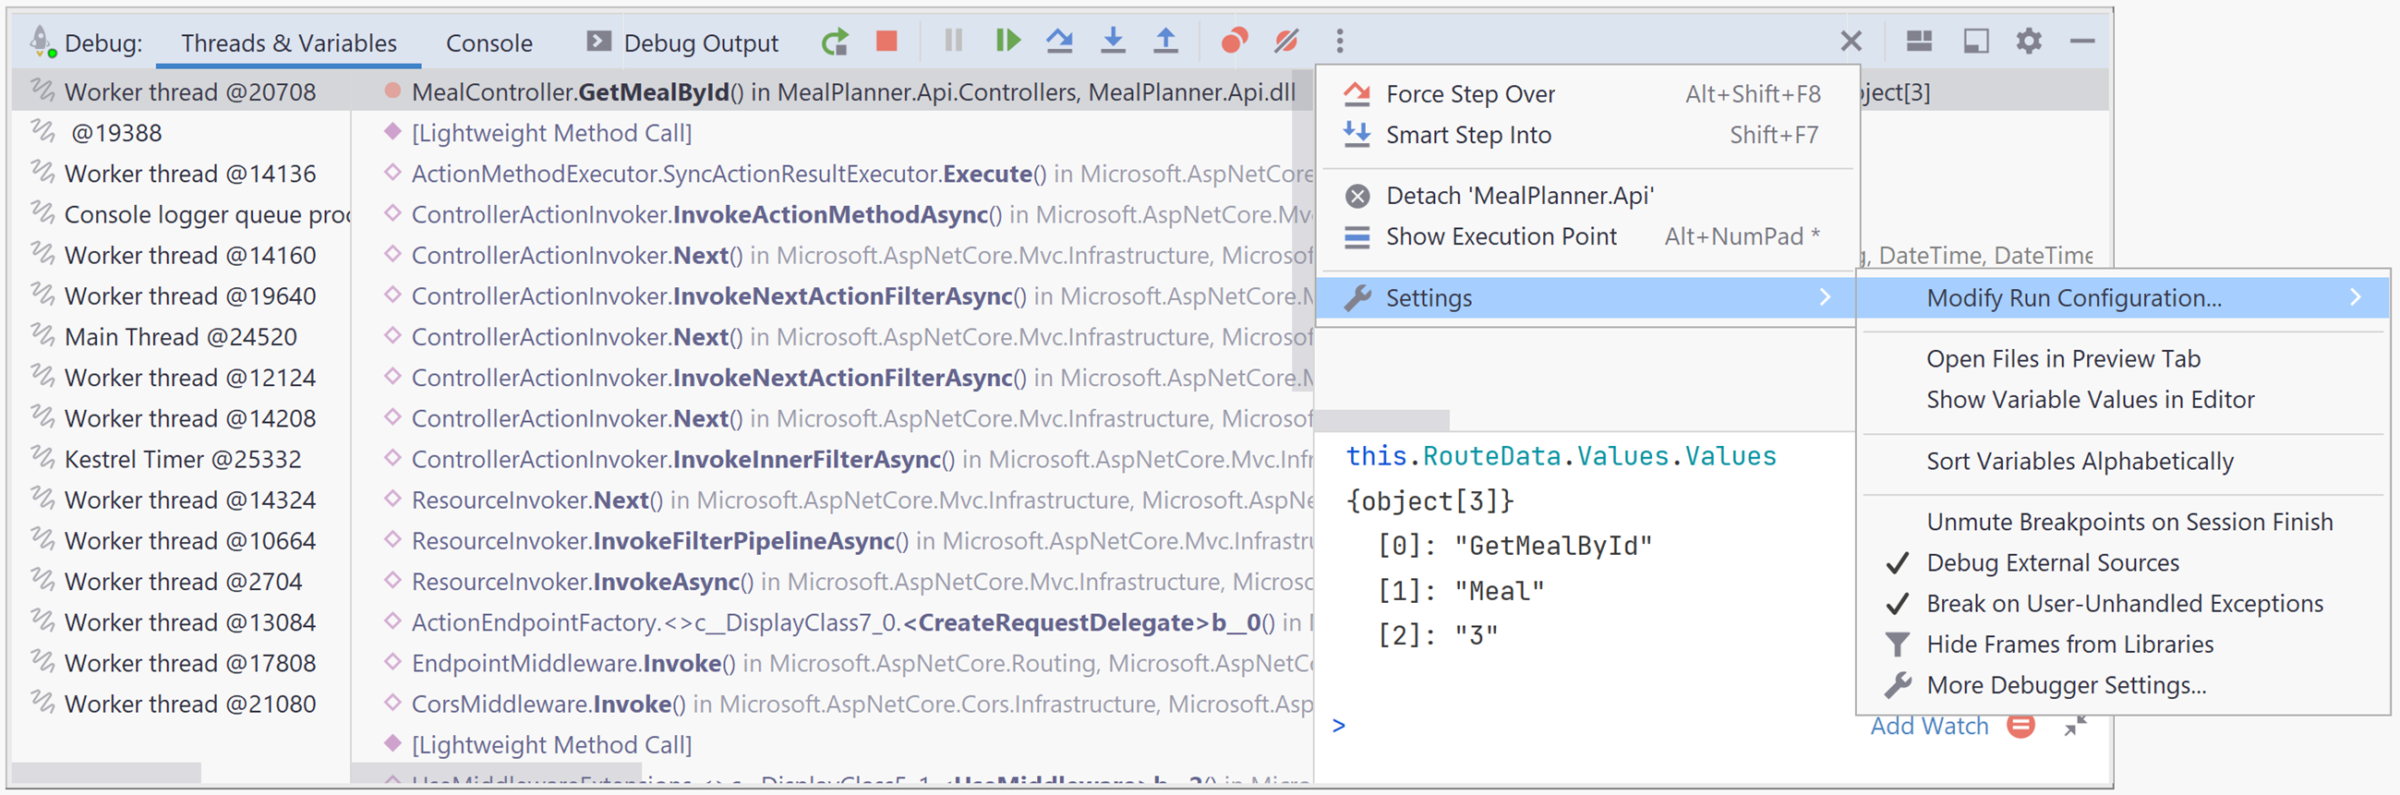
We’ve added a new debugging option, Stop on Breakpoints. This forces the evaluating process to stop on the breakpoints while evaluating an expression. Disabling the option will allow the evaluating process to ignore the breakpoints.
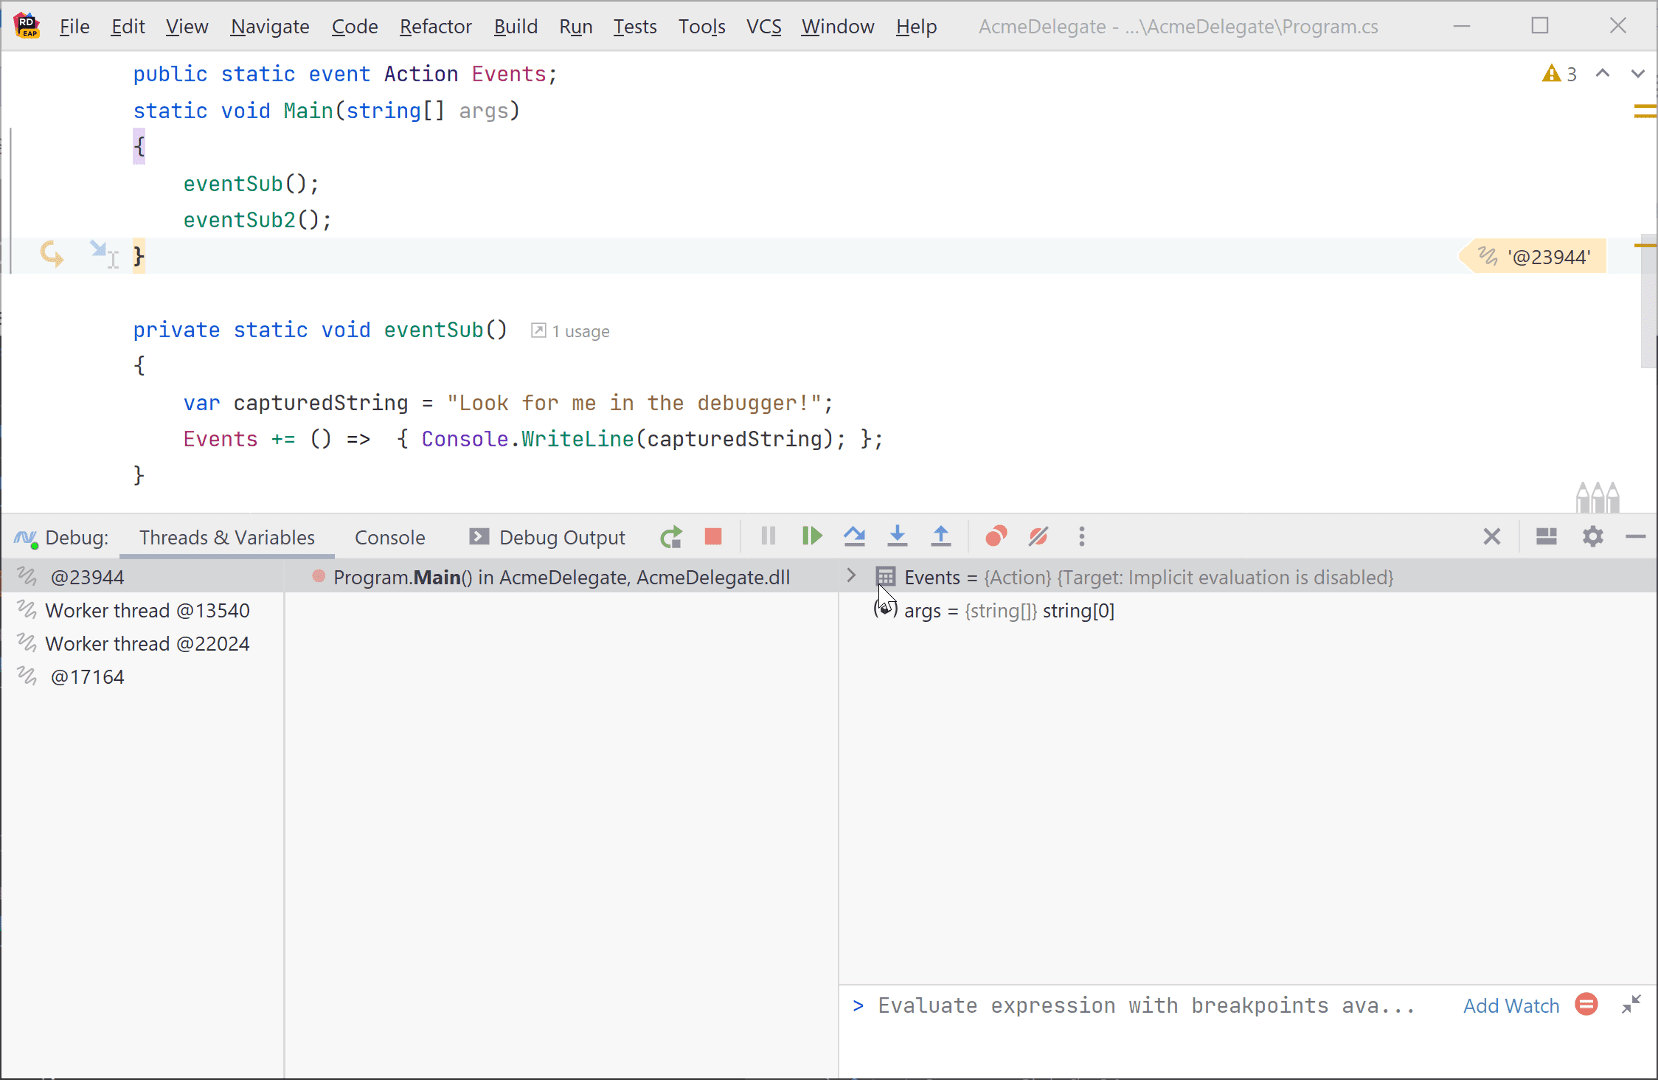
Visualizer for Delegate Subscribers
When you create an event handler (delegate) using a lambda expression, you can now more closely investigate the subscribers and captured objects with Rider’s newest visualizer.
Debug UWP Apps
Prior to 2021.3, it was necessary to attach the debugger to the running process to debug UWP apps. Now, there is no need. Simply start a debugging session as you normally would (Alt+F5, Run | Debug, Bug toolbar icon ) to launch the debugger for UWP apps.
Debug Windows Docker Containers
You can now debug both .NET Core and .NET Framework apps in local Windows Docker containers. Previously, the debugger functioned only with .NET Core apps in Linux Docker containers. Visit Debugging ASP.NET Core apps in a local Docker container to learn how to debug containerized Docker apps.
Download Rider 2021.3 EAP and give it a try! Let us know how you like to use the debugging tools. We’d love to hear your feedback.