.NET Tools
Essential productivity kit for .NET and game developers
Meet Rider 2021.3’s New Problems View
One of Rider’s goals is to help you quickly find and navigate to problems in your solution, fixing problems as you type, without having to stop and compile all the time. Rider 2021.3 introduces the Problems View tool window, to give you an easy way to see warnings and errors, for the current file, the whole solution, and also problems with missing tooling and broken environment configuration.
Problems in the Current File
Rider, like ReSharper before it, has an inspections widget in the top right corner of a file editor. This gives you an at-a-glance view of all of the issues in the current file, showing a count of errors, warnings and suggestions, and provides simple buttons to navigate between them.
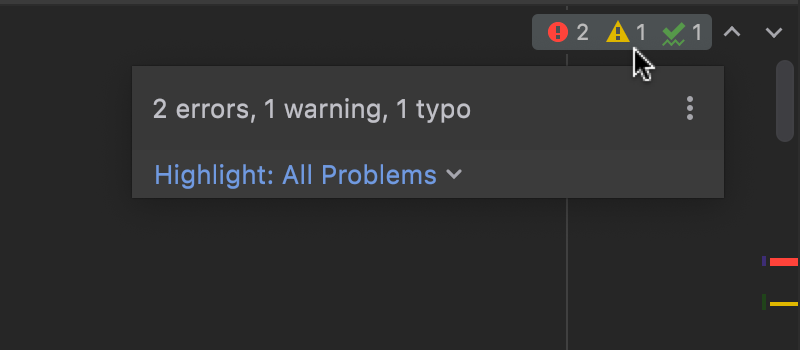
(Use the “⋮” button to switch to a compact view, and to decide if the “Next Highlighted Error” keyboard shortcut will cycle through each issue in turn, or jump to high priority errors first.)
This view is great to check your progress towards a clean, green file, but it doesn’t give you any details. Clicking the inspections widget, or using the Alt+6 keyboard shortcut (CMD+6 for us Mac users), you’ll open the Problems View tool window.
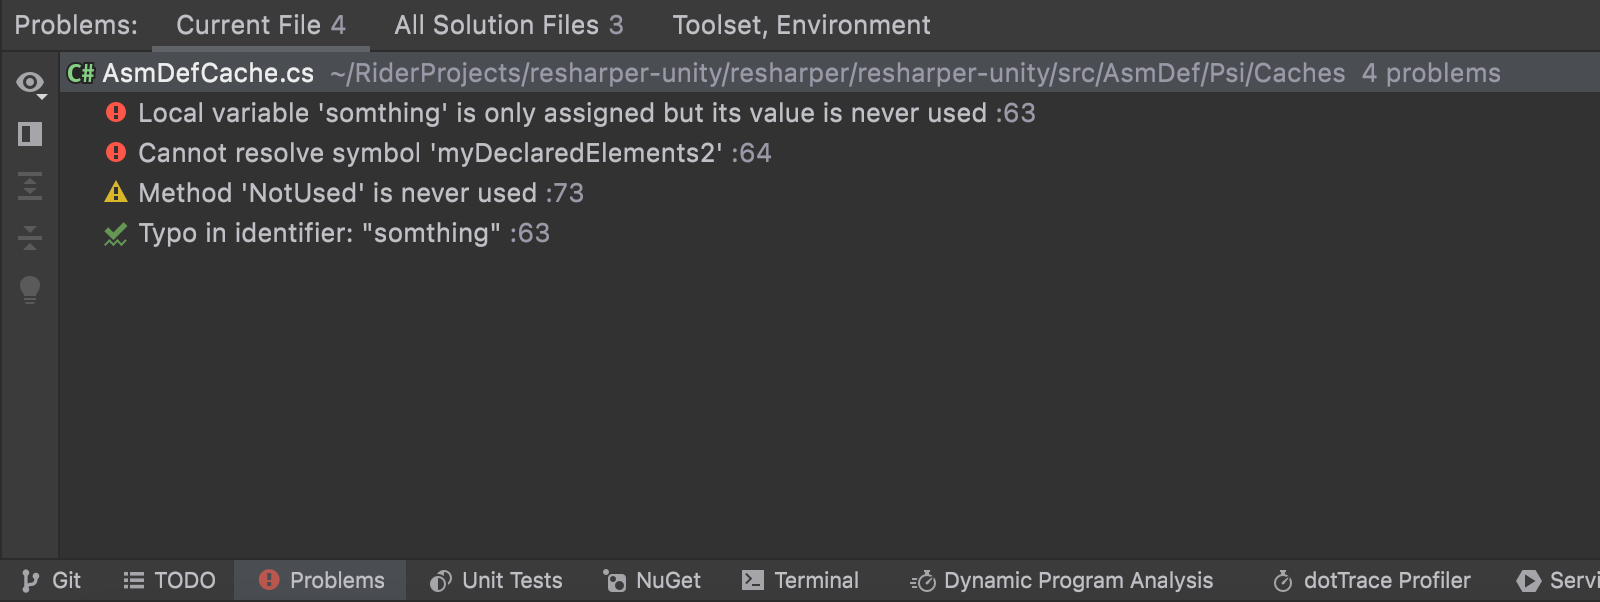
This tool window lists all of the issues found in the current file, and the “Next Highlighted Error” shortcut (F2 in the IntelliJ and Rider keymaps, Ctrl+Shift+Down for Visual Studio) will cycle through them. There’s also a preview window so that you can see the problems without having to open the source file in the editor.
Solution Errors All Solution Files
Some of you might already be familiar with Rider’s Solution Errors tool window. This is where Rider shows the results of Solution Wide Error Analysis, which is a great feature that can find errors across the whole solution, as you type.
For example, if you change the name of a method without using the rename refactoring, Solution-Wide Error Analysis (SWEA) will instantly list all of the places where the old name was being used, and where you now have a lot of red code and compiler errors. You can use the “Highlight Next Error” and “Highlight Previous Error” actions and shortcuts to quickly cycle through all errors in the solution.
Starting with 2021.3, we’ve moved the Solution Errors tool window to be part of the Problems View, as the All Solution Files tab.
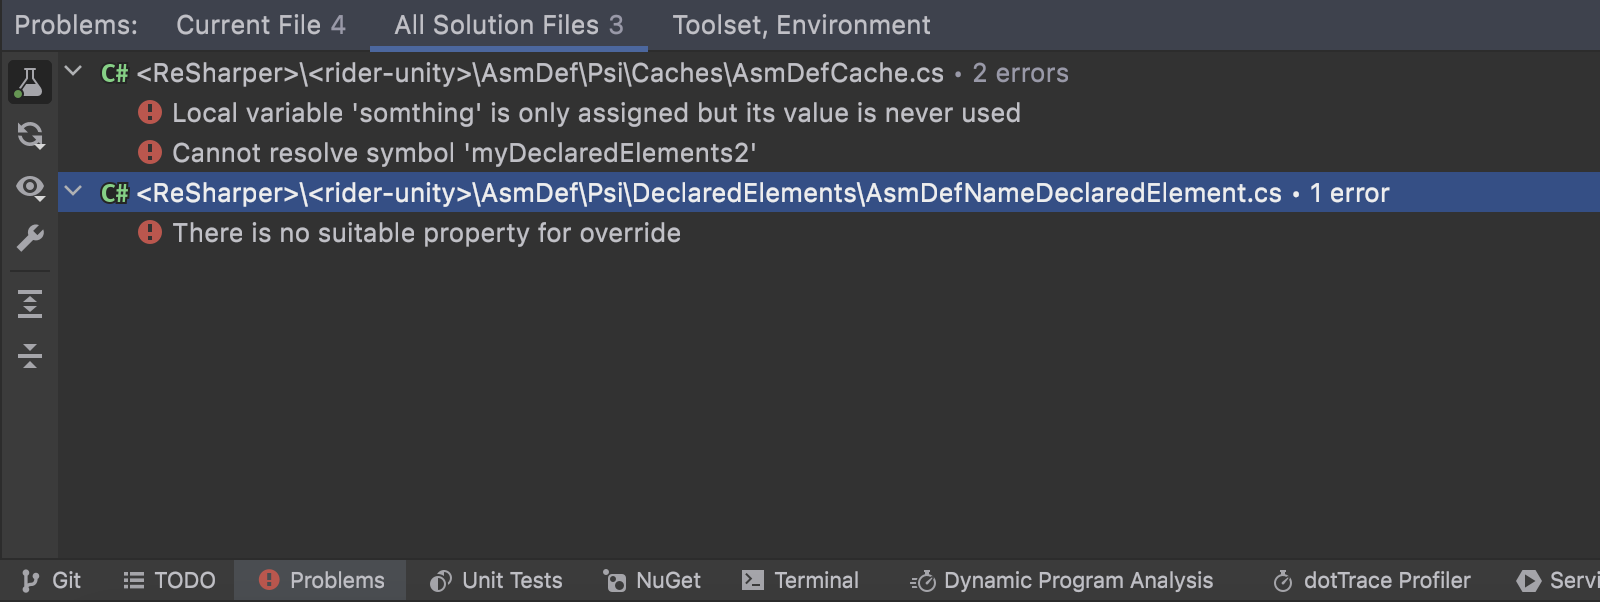
The functionality is just the same – you’ll get a list of all the errors in the solution, grouped by file, but with the new tool window, you also get a preview, so you can see what’s going on without having to navigate to the file. As before, you have toolbar buttons to turn SWEA on and off and you can quickly open the settings dialog to fine tune Inspections Settings and enable, disable or change the severity level of inspections.
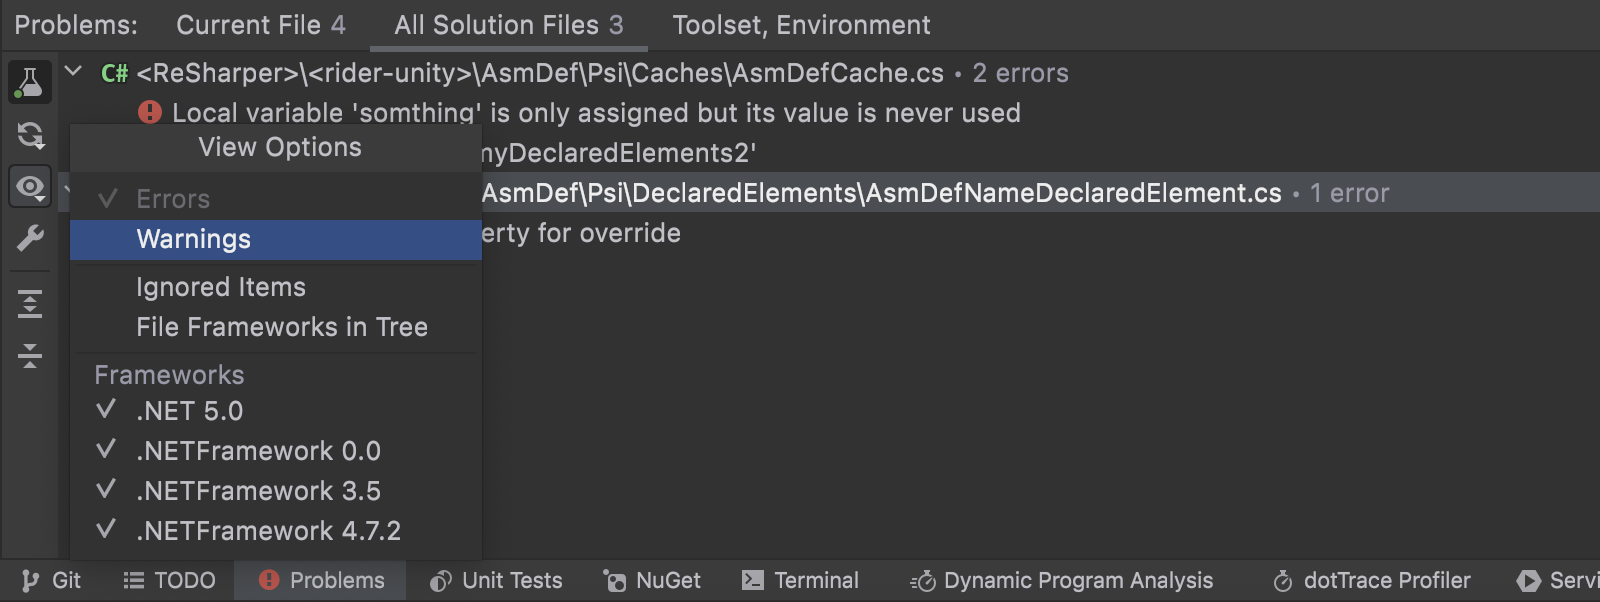
The “eye” icon lets you choose what you want to see. The first item is “Warnings”. By default, Solution Wide Error Analysis shows, well, errors. This is most useful for quickly finding broken code and fixing it. But you can also configure the analysis to show warnings, which is great if you’re aiming to “code to green” and work to get rid of all suggestions, like this blog post describes.
Another useful feature is the “Ignored Items” option. You can right-click on any list item and select “Ignore” (Shift+Click or Ctrl+Click to select more than one item). This doesn’t get rid of the error in the code, but it does hide it in the list, which is handy to make the list more manageable while solving a particular problem. Once hidden, you can use the “Ignored Items” menu item to show them again.
Finally, there are options to include target frameworks in the results tree, and also to show or hide specific frameworks. Again, a useful way to filter the results if you’re multi-targeting.
One thing to point out – if there are any errors in the solution, the icon for the Problems tool window changes to red, to highlight problems, and you’ve still got the SWEA status indicator in the status bar, showing current progress as well as state.

Toolset and Environment
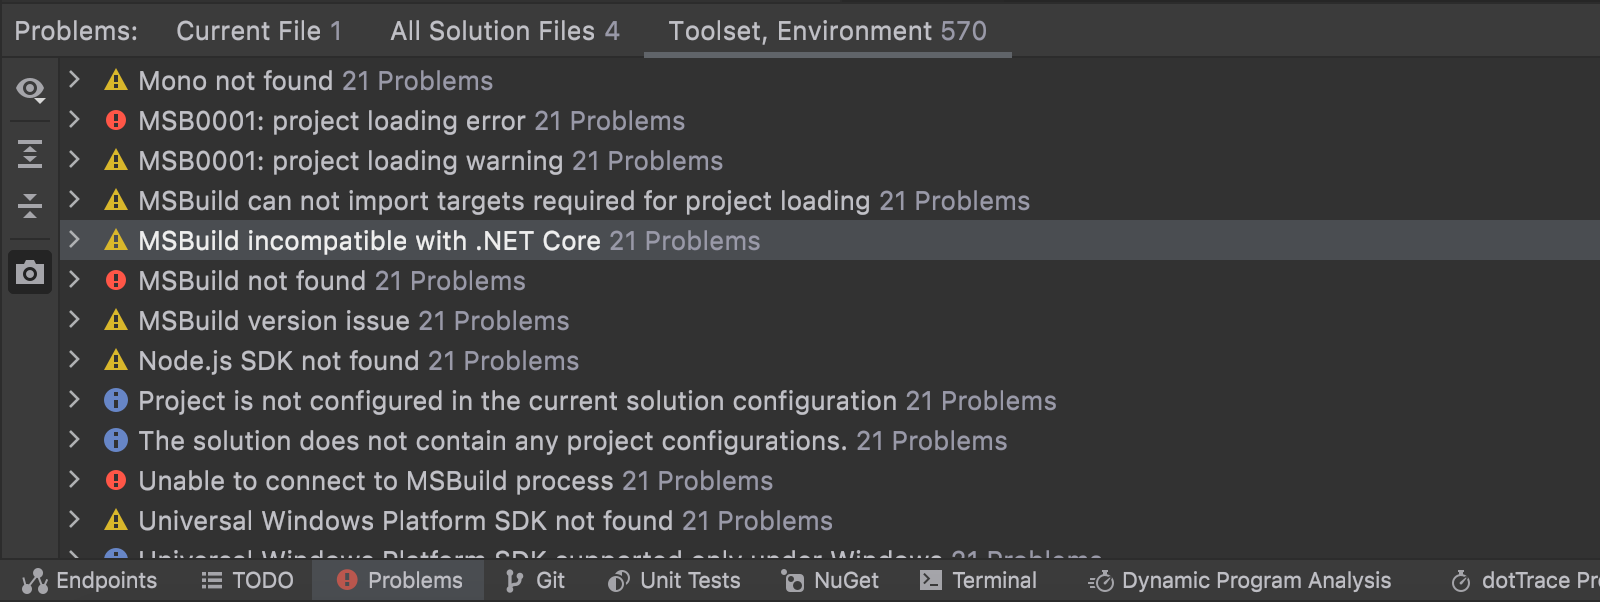
Saving the best till last, the most exciting part of the new Problems View is the Toolset and Environment tab. This is a new tab, giving Rider a single place to show issues that don’t have a related source file.

Rider can report useful warnings here, from missing .NET SDKs, MSBuild, Mono, Xamarin or Xcode, to failing to load a project, wrong versions of MSBuild or the .NET SDK, missing NuGet dependencies, and more.
Each warning and error has a description of what’s going wrong, and most also have action links to help you fix the issue.

For example, if Rider can’t find the .NET SDK, the warning shown will provide a couple of links – “Install .NET SDK” and “Specify .NET CLI path”. Clicking the install link will open Rider’s Environment settings page, which checks for installed SDKs and offers a single click to install or upgrade missing or outdated versions.
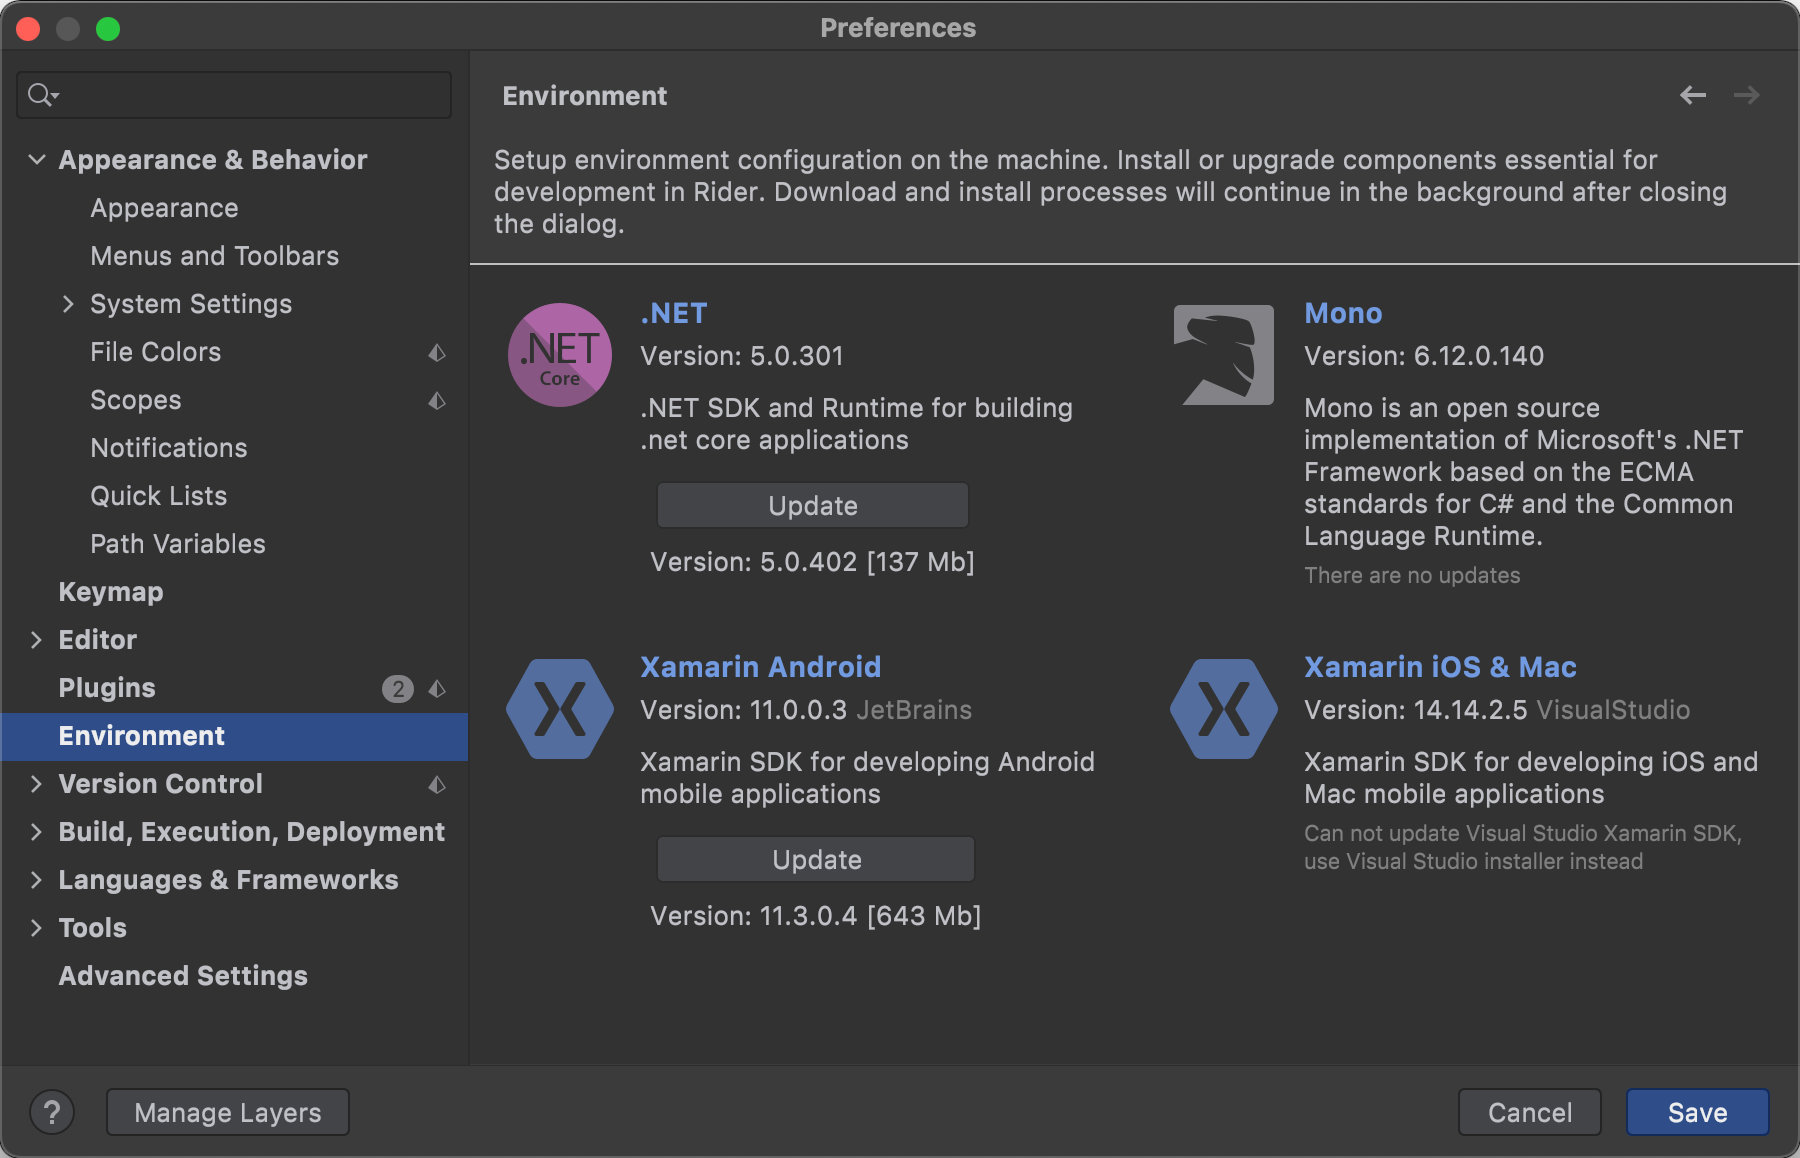
Alternatively, clicking the “Specify .NET CLI path” link will open a different settings page, allowing you to specify a path to the .NET CLI if you’ve installed it to a location that Rider doesn’t expect.
Another example is that Rider will check for the Android SDK, to see if the project’s current target API level is installed, or if the SDK is missing entirely. Links will open the Android SDK manager to install or update, or to open project properties and modify the target API level.
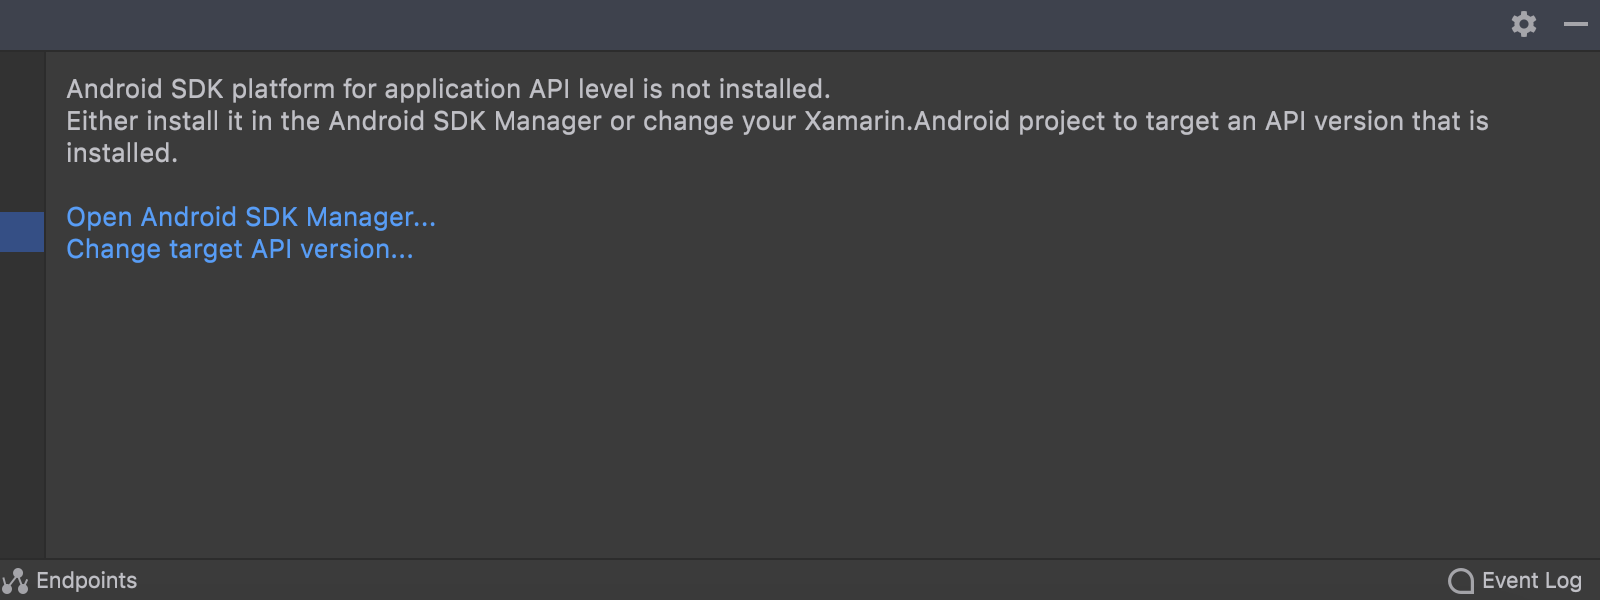
There are plenty more environment and toolset warnings that Rider can check and show, too many to go through here. But make sure you keep an eye on the Problems View as Rider will help you find and fix issues with your environment.
Of course, this is Rider, so all of these action links are also available in an Alt+Enter menu opened from the issue item in the list. You can select an action to help resolve the issue, or you can choose to ignore the issue, and hide it from the list. Again, you can use the “eye” icon to show all hidden items if you need to get it back again.
Keyboard shortcuts
Just before we wrap up, let’s have a couple of top tips for keyboard shortcuts.
We’ve already met the “Next Highlighted Error” shortcut (F2/Ctrl+Shift+Down) and Rider and IntelliJ keymap users get “Previous Highlighted Error” (Shift+F2) as a great way to cycle through problems (Visual Studio keymap users can easily add a keyboard shortcut in settings).
You can use Alt+6 (CMD+6) to show the Problems View tool window, and the cursor keys to select an issue. Enter will open the file at the line of the current problem, and Shift+Enter will open it in a separate tab group (a standard action – “Open in Right Split”, available in loads of places).
Ctrl+Enter (CMD+Enter) will open the file at the line with the problem, but will leave the focus in the tool window, so you can still scroll and use the preview window. Escape will move the focus away from the tool window and back to the editor. Shift+Escape will close the current tool window (another standard shortcut – it closes the current or last used tool window, which might not be the Problems View!).
And finally, if the focus is in the Problems View tool window, you can use the Ctrl+Left and Ctrl+Right keys to switch between the Current File, All Solution Files and Toolset and Environment tabs – another common keyboard shortcut to work with Rider’s tabbed views.
As you can see, the Problems View is a great way to see all of the issues that Rider has found – in the current file, across the solution and most usefully, in your toolset and environment setup.
Download the Rider 2021.3 Early Access Preview, and give it a go yourself.

