.NET Tools
Essential productivity kit for .NET and game developers
Surprising Ways To Profile Your .NET Applications

Profiling is an essential yet under-utilized aspect of building applications. We’ve all been there. In times of mounting pressure, we’re more focused on shipping features and hoping we didn’t add perceivable performance or memory issues to our app.
If you’re not familiar with dotTrace or dotMemory, now’s a great time to learn more about them!
In this post, we’ll look at several ways to introduce profiling into your development workflow, to help you catch performance issues early. We genuinely think you’ll find some of these approaches surprising.
Profiling in your IDE

There’s no better place to start looking at the performance of your apps on your machine, than in your integrated development environment (IDE).
If you’re using ReSharper or Rider, you’ll have access to Dynamic Program Analysis, a process that runs in the background and checks for various memory allocation issues. You can think of it as always-on profiling. You don’t need to run a profiler, start a profiling session, or grab snapshots. Instead, you can work as you usually would as your IDE collects data about your application. The data collection process adds almost zero overhead, so you’ll likely not even notice DPA working away in the background.
However, when you stop your run session, you’ll see the potential issues around memory allocations on the large object heap, small object heap, and problems with lambda and LINQ closures. We’ve even put together a handy guide to help you fix these kinds of issues.
For folks wanting more detailed profiling information about methods and time spent in the process, you can Profile using dotTrace or dotMemory right from the IDE.
Tip: Here’s a tutorial on how to profile your applications from JetBrains Rider.
You can explicitly capture a profiling snapshot and see a timeline, any potential hot spots, a flame graph showing where your application is spending most of its time, and backtraces to help you find the origin of your issues. You get the power of dotTrace and dotMemory without ever leaving your development workflow.
Profiling in your build pipeline

Software development is a team sport, and while you can do your best locally, the build process can contribute. To help maintain a performance standard, you may consider adding profiling to your build pipeline.
Both dotTrace and dotMemory come in CLI-friendly variants that run on Windows, macOS, and Linux. Build process maintainers will appreciate the command-line tools, as they offer an easy bolt-on profiling experience for any build environment. There’s also a TeamCity dotMemory plugin and dotTrace plugin to enable profiling in just a few clicks.
If you want more granular control of the profiling process, you can use the JetBrains.Profiler.SelfApi NuGet package. The dependency lets you initiate and control profiling sessions right from your application code. You can take snapshots at any point of your application’s lifetime, and open the snapshots later using JetBrains profiling tools. For example, you can use the package to take memory snapshots of an end-user desktop application to help diagnose issues in the field. More likely, take snapshots of your application during integration tests to capture an intermittent problem.
Profiling in your unit tests
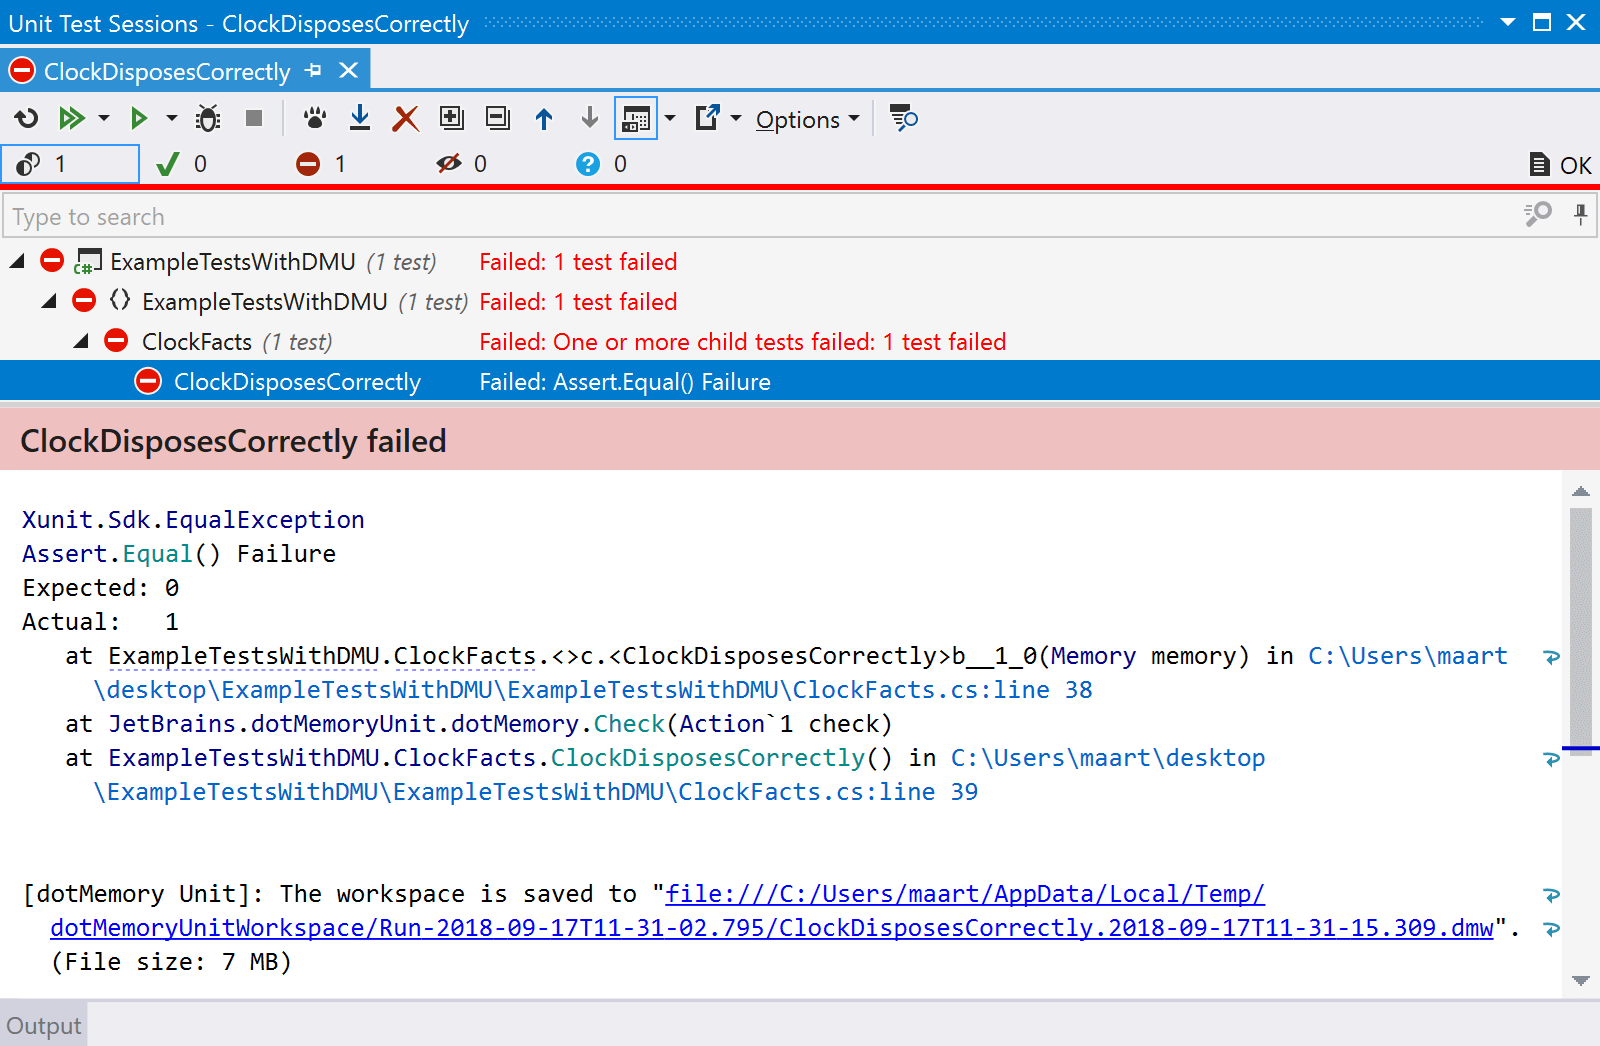
Typically unit tests are written to catch logic flaws, but they can also help diagnose inefficient implementations. With JetBrains.dotMemoryUnit, you can write tests that check code for memory issues. For example, you can write tests that determine leaks by checking memory for objects that should no longer exist. You can fail tests on almost any criteria you can code. We’ve had customers use dotMemoryUnit to diagnose memory leaks and ensure they don’t find their way back into the codebase. You can use the package with your favorite unit testing frameworks like NUnit, MSTest, and XUnit.
Profiling Remotely

It is probably the last place you’d like to profile, but some problems seem to only happen in production. Have no fear. With our profiling tools, you can also profile on a remote machine.
You can install the console profilers on production machines either via a .zip download or by retrieving the packages from NuGet. You can find direct links on the dotTrace Command-Line profiler and dotMemory Command-Line profiler documentation pages.
Once installed, you can capture snapshots for any .NET core application. The benefit of the console profiler is that you can run the same tooling across Windows, macOS, and Linux. In addition, you can set our tools to monitor intervals, with every elapsed interval capturing another snapshot. Finally, you can retrieve snapshots from the host environment and view them in the standalone versions of dotMemory or dotTrace, respectively.
Profiling everywhere, now!
Hopefully, after reading this post, you’ve found a new way to profile your applications. You’ve probably also noticed you could stack these strategies to get the most out of profiling. I recommend reading our guides, watching our YouTube videos, and following us on social media channels to get more detailed information. We have a library full of documentation to help you get better acquainted with our profiling tools. We’re also a helpful bunch, so reach out to us and start a conversation.
Thank you for reading, and if you have any profiling stories you’d like to share, please leave them in the comments. We’d love to hear them.