.NET Tools
Essential productivity kit for .NET and game developers
How to Profile .NET Code Using the dotMemory Plugin in Rider

Having a profiling tool integrated into your IDE is an asset no developer can discount the value of. The undeniable convenience of being able to screen your app for performance issues on the fly is why the dotTrace profiler comes integrated into Rider. With our latest EAP build, we’re expanding on that convenience by introducing a built-in memory profiling tool.
In this post, we’ll explore how to run memory profiling in Rider using the latest addition to this IDE’s plugin roster – dotMemory Profiler.
Disclaimer: dotMemory Profiler is currently only available on Windows in Rider 2022.2. Linux and MacOS versions of the plugin are to follow in the next releases.
Why comprehensive profiling matters
Whenever you encounter performance issues, it helps to keep in mind that one set of problems can actually stem from different causes. Slow performance can either be a symptom of calling expensive methods too often or over-allocation and garbage collection.
That’s why combining two profilers – performance and memory – can give you a complete picture of your application’s pitfalls, allowing you to decide how to tackle performance improvements.
Our general recommendation for fine-tuning your app is to start with dotTrace and then follow it up with dotMemory to reduce allocations, reduce garbage collection pressure, and investigate any other memory issues slowing your application down. In this article, we’re going to focus on memory profiling using the dotMemory plugin integrated with Rider.
Before we get started, please note that the dotMemory plugin’s functionality is limited compared to the standalone version of the profiler. The 2022.2 version of the dotMemory plugin does not yet allow you to collect and analyze snapshots, but you can follow the progress on this functionality and stay tuned for future releases.
Sampled vs Full allocations
The first thing you need to know about dotMemory is that it can collect memory allocation data in one of two modes: Sampled and Full. Let’s take a quick look at the difference between them.
Sampled allocations collection is the default mode. When in this mode, dotMemory collects limited allocation data, meaning approximate object sizes but no information on object counts. Using this mode does not slow down the profiled application. We recommend Sampled allocations as the go-to option for most use cases.
Full allocations mode collects detailed allocation data: the exact size of allocated objects, as well as the number of objects. Naturally, such a thorough profiling method significantly slows down the run of your application.
To get the full picture of the difference between the two data collection methods, check out this section of dotMemory documentation.
Launching memory profiling in Rider
Once you know which data collection mode you want to go with, you can initiate the session in one of two ways.
You can choose your preferred profiling method in the Run toolbar or by going to Run | Switch profiler configurations in the main menu and then selecting either Memory (sampled allocations) or Memory (full allocations).
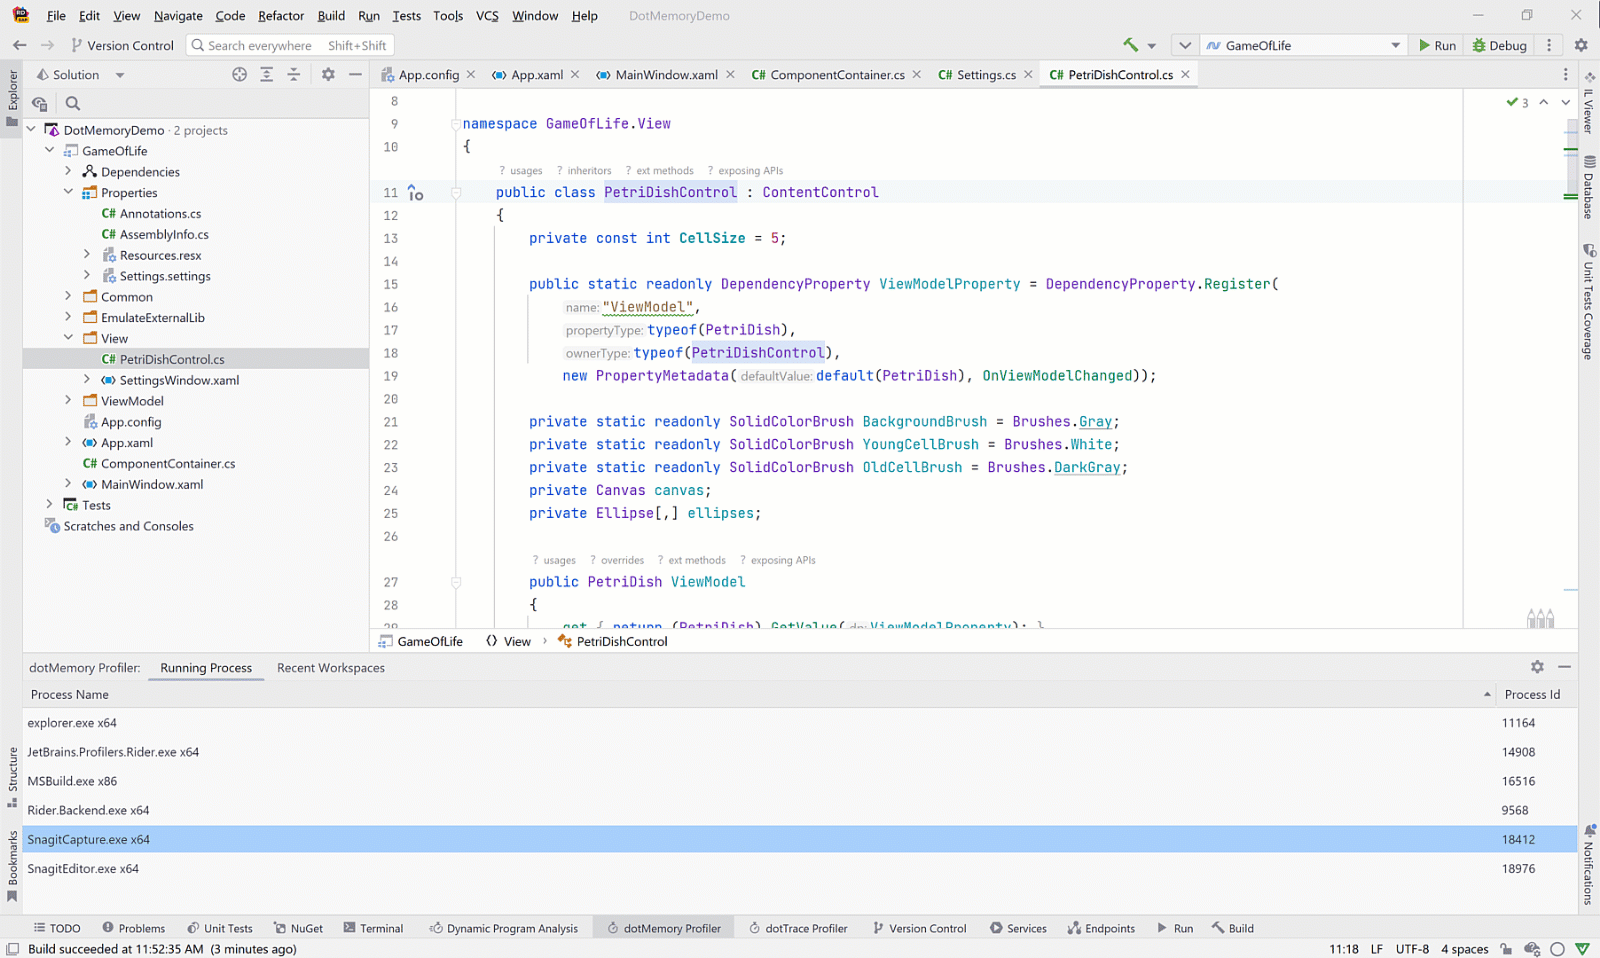
It’s worth pointing out that the dotMemory plugin profiler is also able to attach to an already running process from the Run menu.
It’s no problem if you change your mind about which profiling mode you want to use. The dotMemory plugin allows you to switch between Sampled allocations and Full allocations mode at any time during the profiling session. The easiest way to do this is by clicking on the Full Allocation data button above the Timeline Graph to turn in-depth data collection on or off.
You can stop the profiling process by clicking Stop in the toolbar or Kill above the Timeline Graph.
Real-time memory analysis
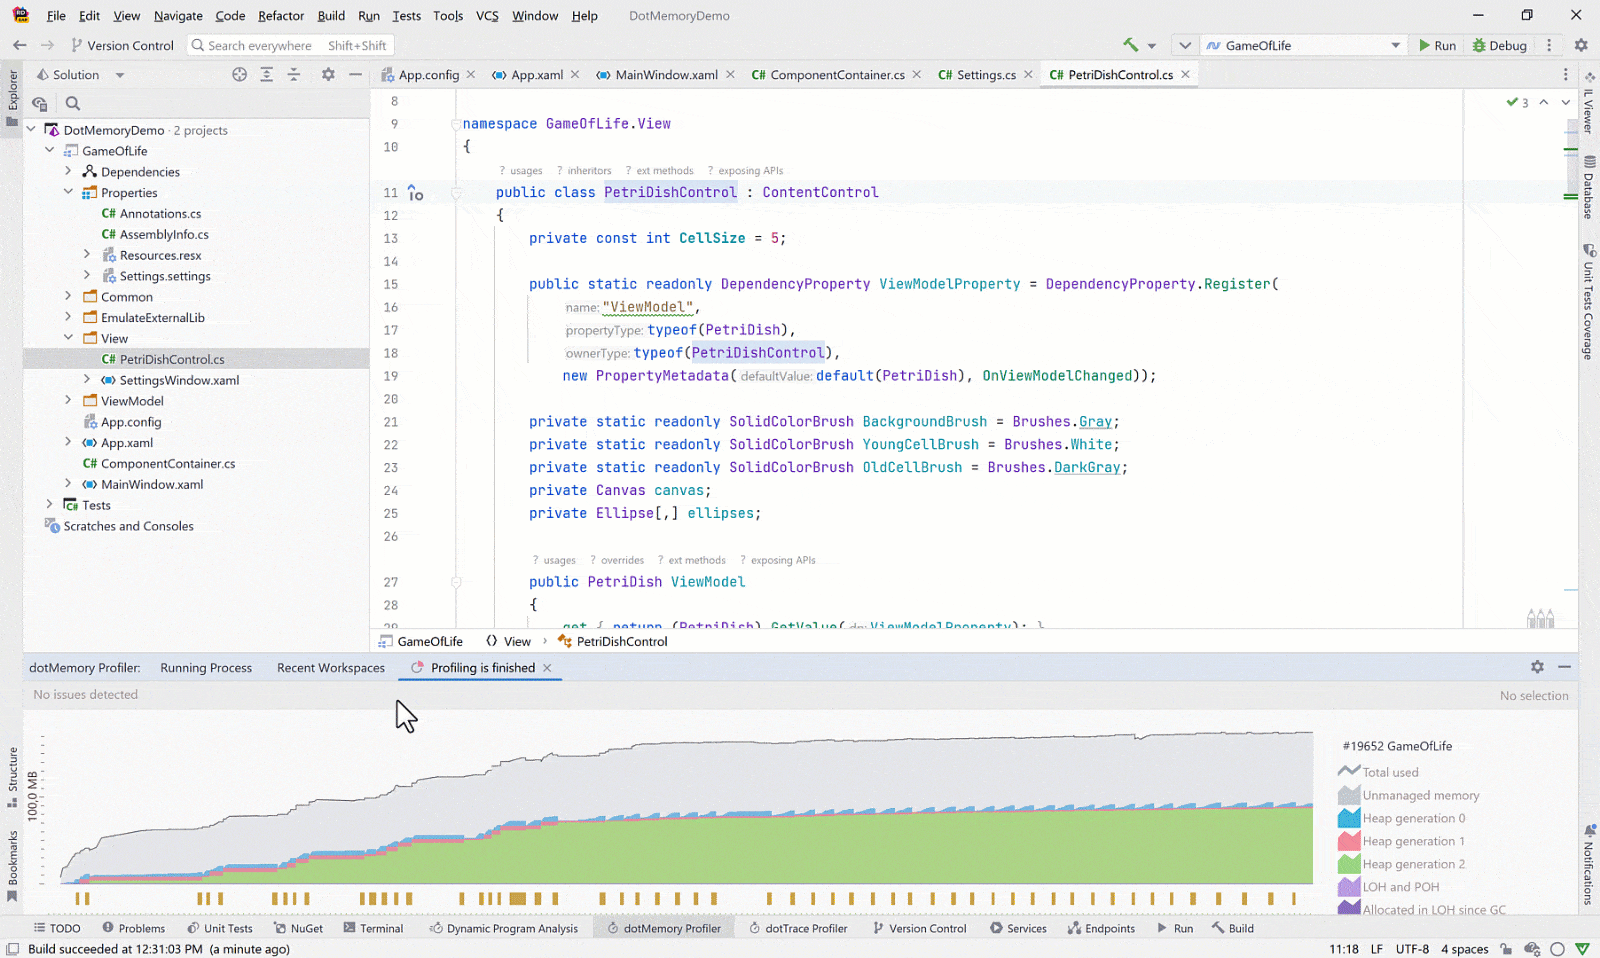
Once the profiling session has been initiated, you’ll see the Timeline Graph unroll in real time, illustrating how your app consumed memory during the profiling process. You can drag, zoom in, and highlight sections of the timeline to focus on visibly problematic areas.
If you are unsure about where to start, check the results of the real-time inspections above the Timeline Graph. The automatic memory inspections can alert you to a number of potential memory allocation issues, such as pinned objects in Gen0, high GC pressure, and a fast LOH growth rate.
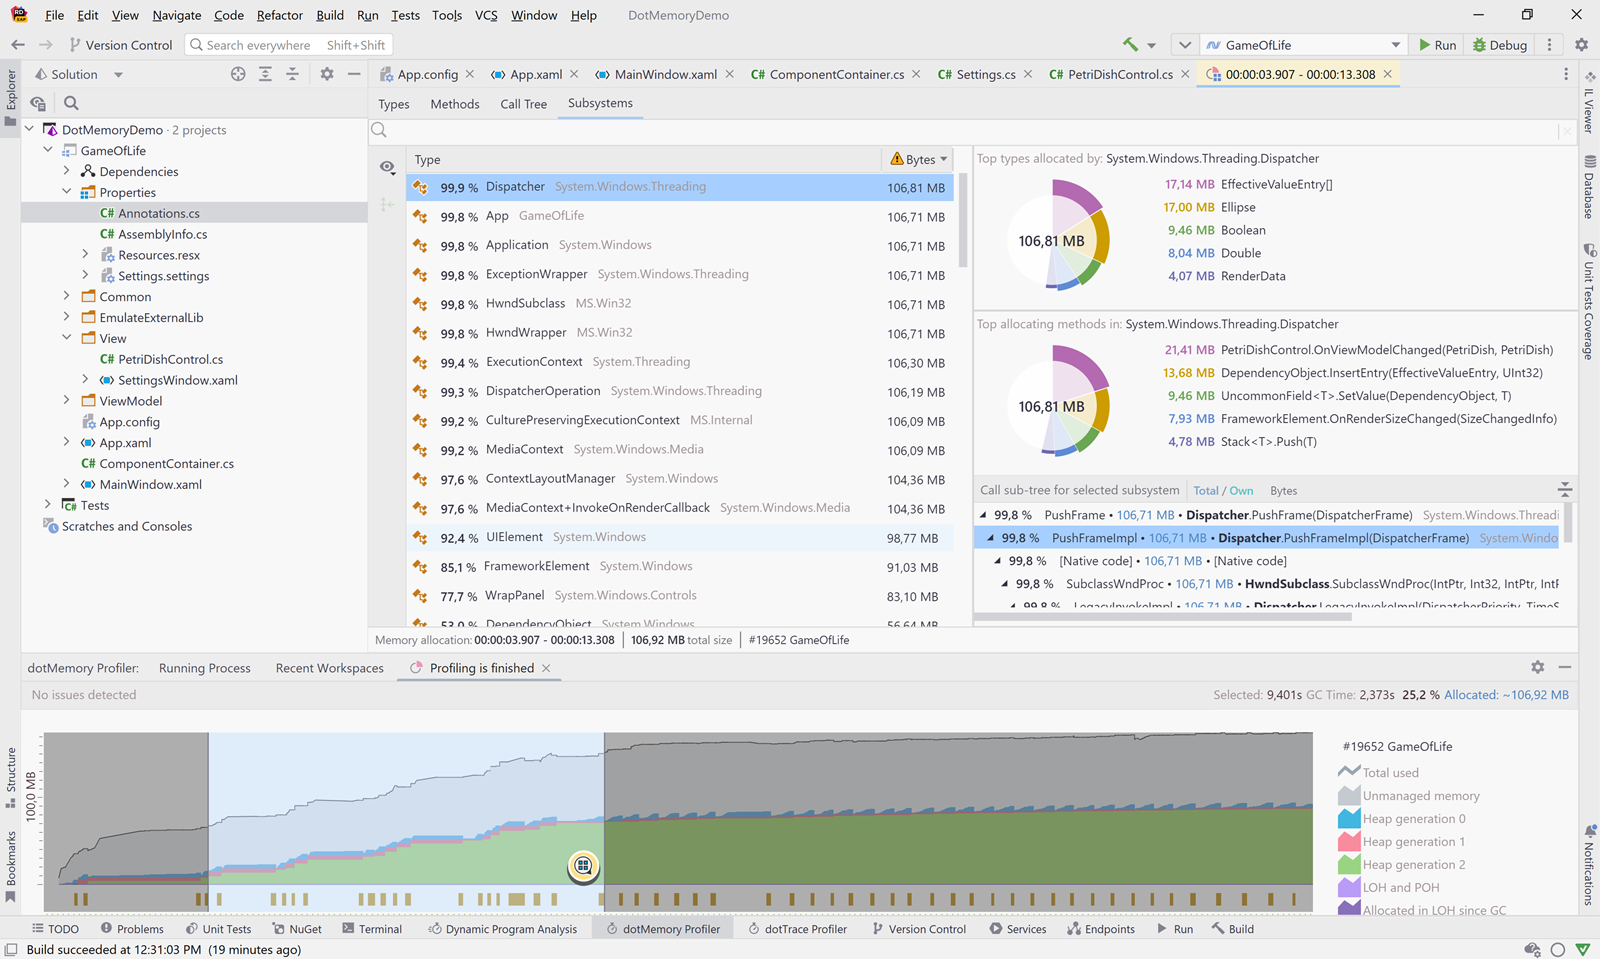
Select an interval you’d like to investigate and click on the Show allocation details icon to open the Memory Allocation window. It is identical to the same view in dotMemory Standalone and allows you to dig deeper into the analysis of a specific time frame.
By default, the Memory Allocation window will open to a Types view, meaning the objects that were allocated during the selected interval will be organized by type. If you click on one, you’ll be shown the functions allocated to that object (these are known as “Back Traces”).
You may also want to organize the allocations view by Method, Call Tree, or Subsystem. A subsystem groups all methods belonging to a particular type, namespace, or assembly. It is therefore a master-detail view that can give you the most high-level perspective on your app’s runtime performance.
The subsystems that are of no interest to your investigation can be conveniently moved to the bottom of the list and grayed out by pressing Del or right-clicking on them and selecting Exclude from scope. This action is reversible. All you need to do to bring a subsystem back is scroll to the bottom of the list, select the object you want to bring back, and once again press Del or right-click the subsystem and choose Return back to scope from the context menu.
For a quick walkthrough of the memory profiling process using the dotMemory plugin, please watch the video below.
Working with workspaces
To store the results of your investigations, dotMemory uses workspaces. A workspace saves everything you see on the screen during memory profiling, namely all open analyses, including analysis paths.
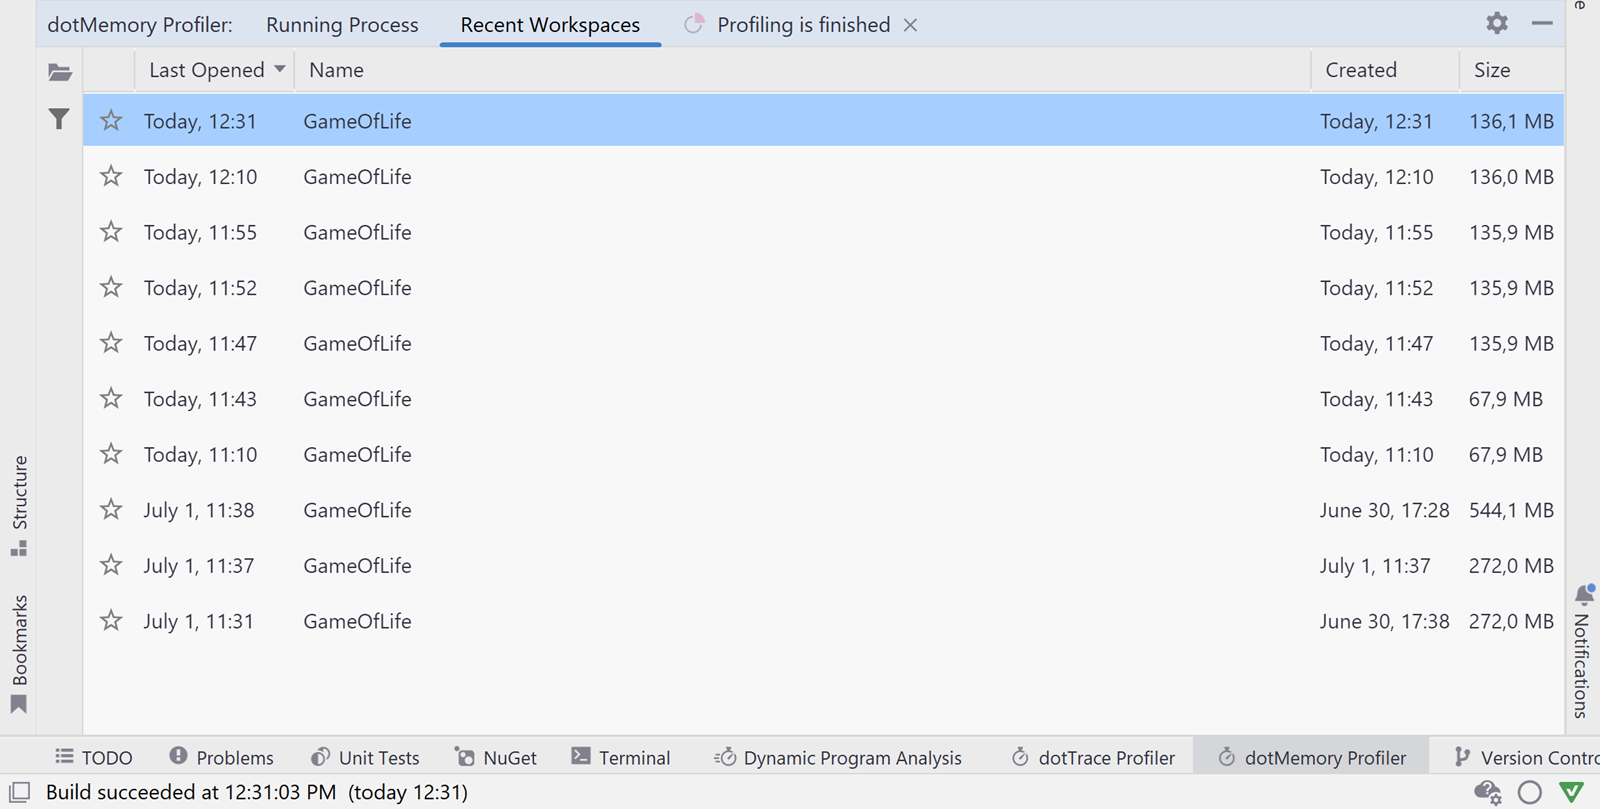
If, for whatever reason, the profiled application or the IDE were to crash, you’d be able to restore the profiling data in its entirety. For your convenience, you can also rename your workspaces and favorite, export, or delete them.
Conclusion
Classic performance profiling can make you aware of greedy methods slowing your app down. However, performance issues can also be caused by suboptimal memory usage because allocations can lead to excessive garbage collection. Therefore it becomes crucial to pinpoint which methods produce the most allocations. That’s where dotMemory comes into play. Combining dotTrace with dotMemory in your profiling can give you a comprehensive overview of your app’s performance pitfalls in mere minutes. Give it a try and make sure to share your feedback with us.