.NET Tools
Essential productivity kit for .NET and game developers
dotCover, dotMemory, dotPeek, and dotTrace 2022.2 are here!

Hello everyone,
Alongside the ReSharper 2022.2 and Rider 2022.2 releases, we’ve rolled out major updates for dotCover, dotMemory, dotPeek, and dotTrace. Let’s take a look at what’s new in these .NET tools.
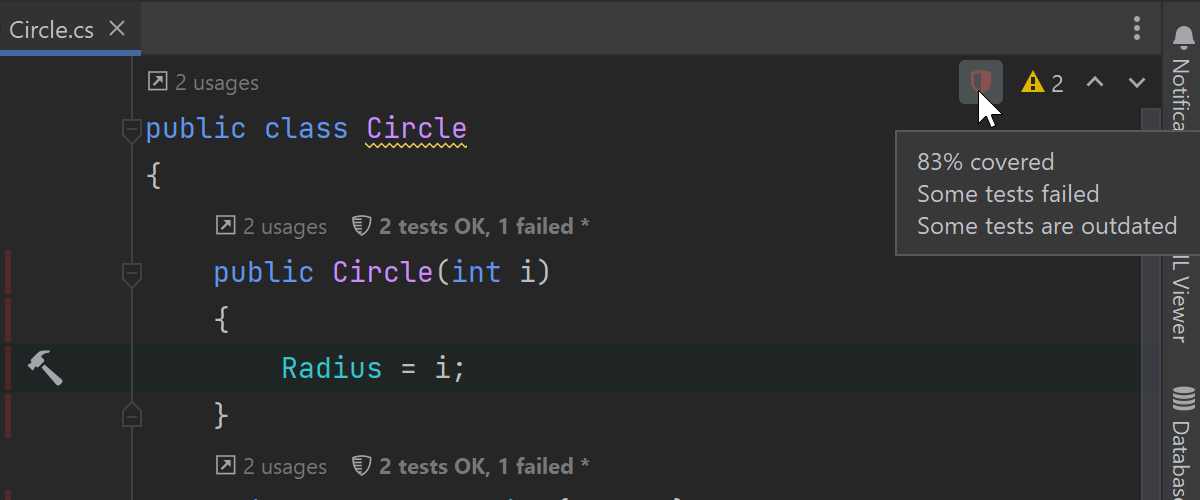
dotCover 2022.2
This release has improved the dotCover plugin in Rider. You can now quickly view coverage results for the file you have open by using the shield icon. Clicking on the icon navigates you through the uncovered statements.
dotMemory 2022.2
The 2022.2 update brought memory profiling into JetBrains Rider!
- Two new profiling modes are available: Memory (sampled allocations) and Memory (full allocations).
- You can attach the profiler to a running process.
- You can watch the Timeline Graph unfold in real time by selecting an interval and opening the Memory Allocations view.
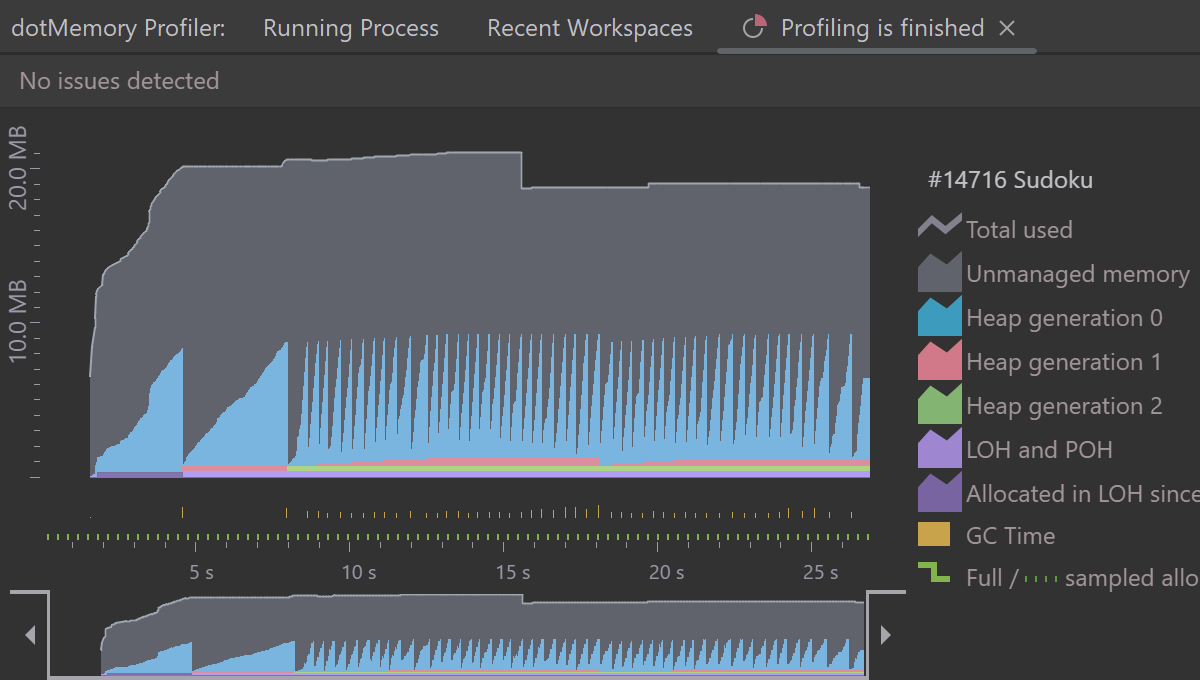
There are a couple of limitations in this release: the dotMemory plugin doesn’t allow collecting snapshots and only works on Windows.
dotPeek 2022.2
dotPeek can show you decompiled high-level and low-level C# code in addition to the IL code in the IL Viewer tool window. The decompiled code is still synced to the source code in the code editor. When you scroll in the editor, the selected presentation in the IL Viewer tool windows scrolls as well. If you focus on a code statement in the editor, dotPeek highlights the corresponding code section in the IL Viewer.
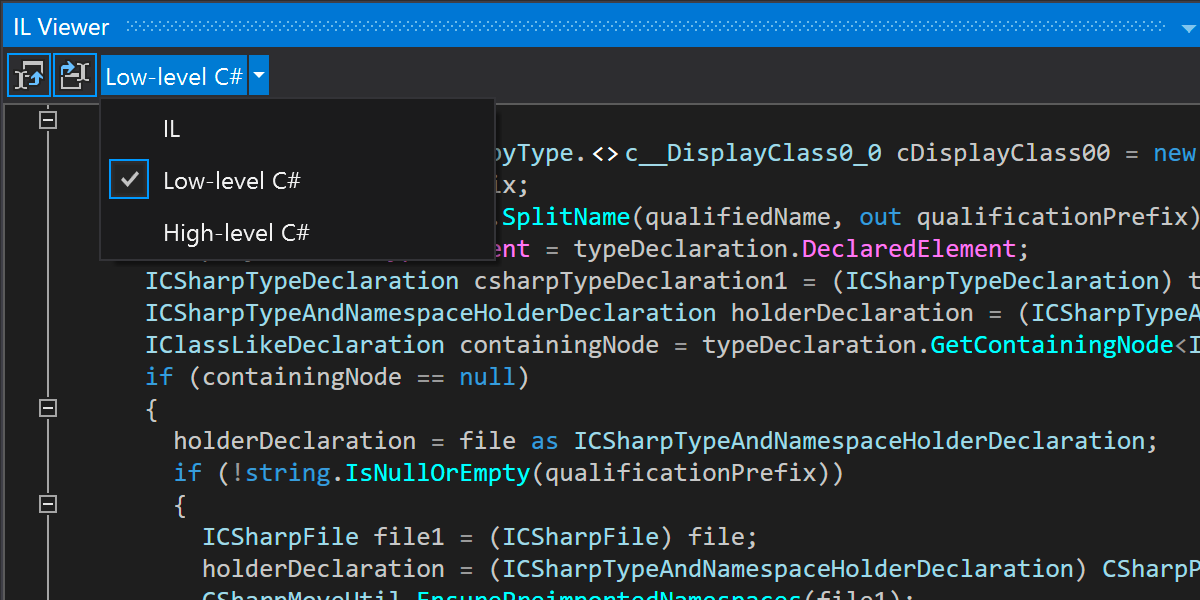
We’ve also added support for ReadyToRun and NGen assembly support in the Assembly Explorer.
dotTrace 2022.2
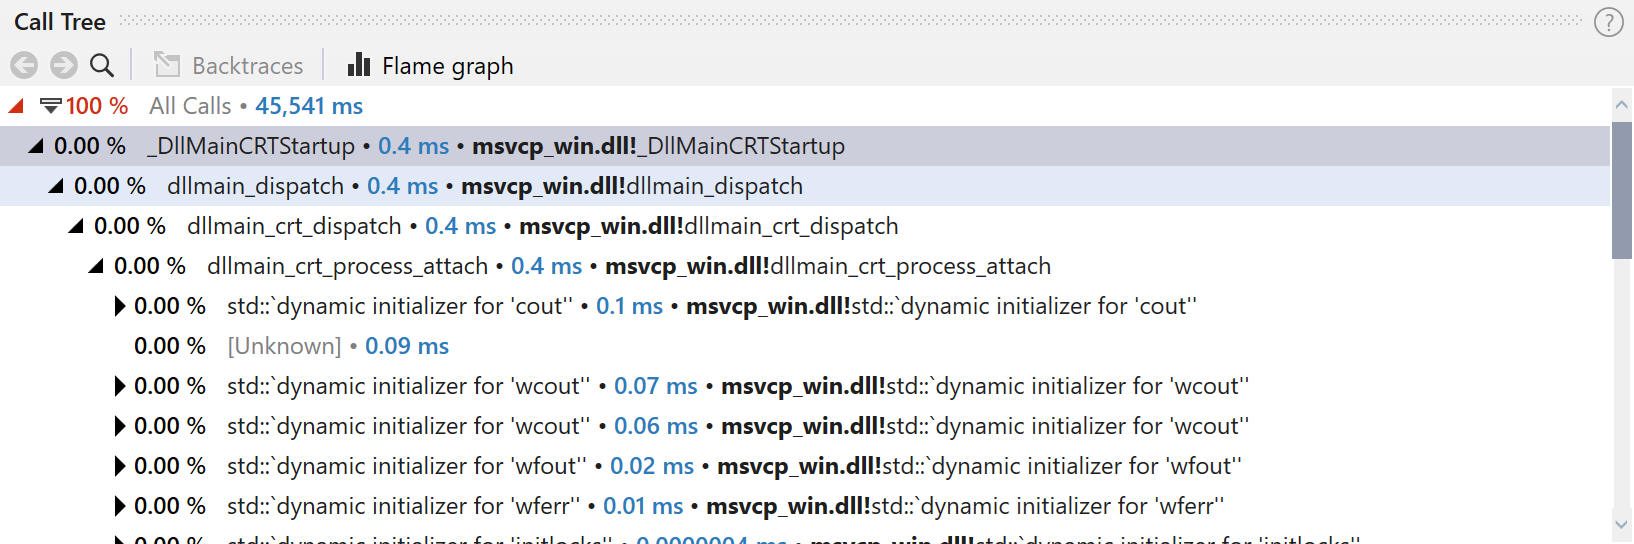
dotTrace 2022.2 provides more details for native system calls in the Timeline Call Tree, including Windows kernel calls (ntoskrnl.exe), device driver calls (*.sys), and more.
Thanks to improvements in the dotTrace plugin for JetBrains Rider, you no longer have to restart the Unity Editor to launch the profiling process. The profiler can now attach to and detach from running Unity processes.