.NET Tools
Essential productivity kit for .NET and game developers
How To Debug Docker and Docker Compose Solutions with JetBrains Rider

Docker has become an integral part of a developer’s workflow, and docker-compose helps you build complex distributed solutions from your development to the production environment. In recent releases of JetBrains Rider, we added Fast-Mode Docker Support. In short, your development feedback loop just got a lot faster.
We’ve noticed folks are still trying to understand this workflow, and we thought we’d write an updated walkthrough to help you debug both standalone container apps and docker-compose solutions. Let’s go ahead and get started.
What is Docker and Docker Compose?
Docker is a containerization technology that allows you to package and deploy your application to a hosting destination. Containerization is a technique many vendors use, but Docker is the space’s most well-known commercial tooling provider, with 18 million developers using it worldwide.
Core to Docker is the concept of containers. With containers, users can avoid common issues found with setting up environments. For example, container images can define dependencies, environment variables, and disk volumes through codification. In addition, a code-based configuration helps reduce common mistakes when manual processes are in place. While containerizing one application can be helpful, most modern solutions include several services talking to each other, and that’s where docker-compose comes in.
Docker Compose is a tool to define multi-container applications through a carefully specified configuration. To start with, a docker-compose YAML file can use images defined by you or a third-party organization to orchestrate a distributed solution. In addition to containers, your environment definition can allocate shared resources, such as data volumes and networking. Docker Compose commands can also intelligently manage an environment, only recreating the changes in your solution. Finally, Docker Compose applies to all deployment environments, including CI/CD pipelines.
To start with Docker, you’ll need an installed version of Docker Desktop in your development environment.
Rider and Docker Pre-flight Check
After installing Docker Desktop, you should check that Rider recognizes your Docker Desktop installation.
First, start a new instance of JetBrains Rider and go to Settings and navigate to Build, Execution, Deployment | Docker. You should see that JetBrains Rider has recognized your installation of Docker Desktop. If you don’t see these settings, you likely don’t have the Docker plugin installed or enabled.
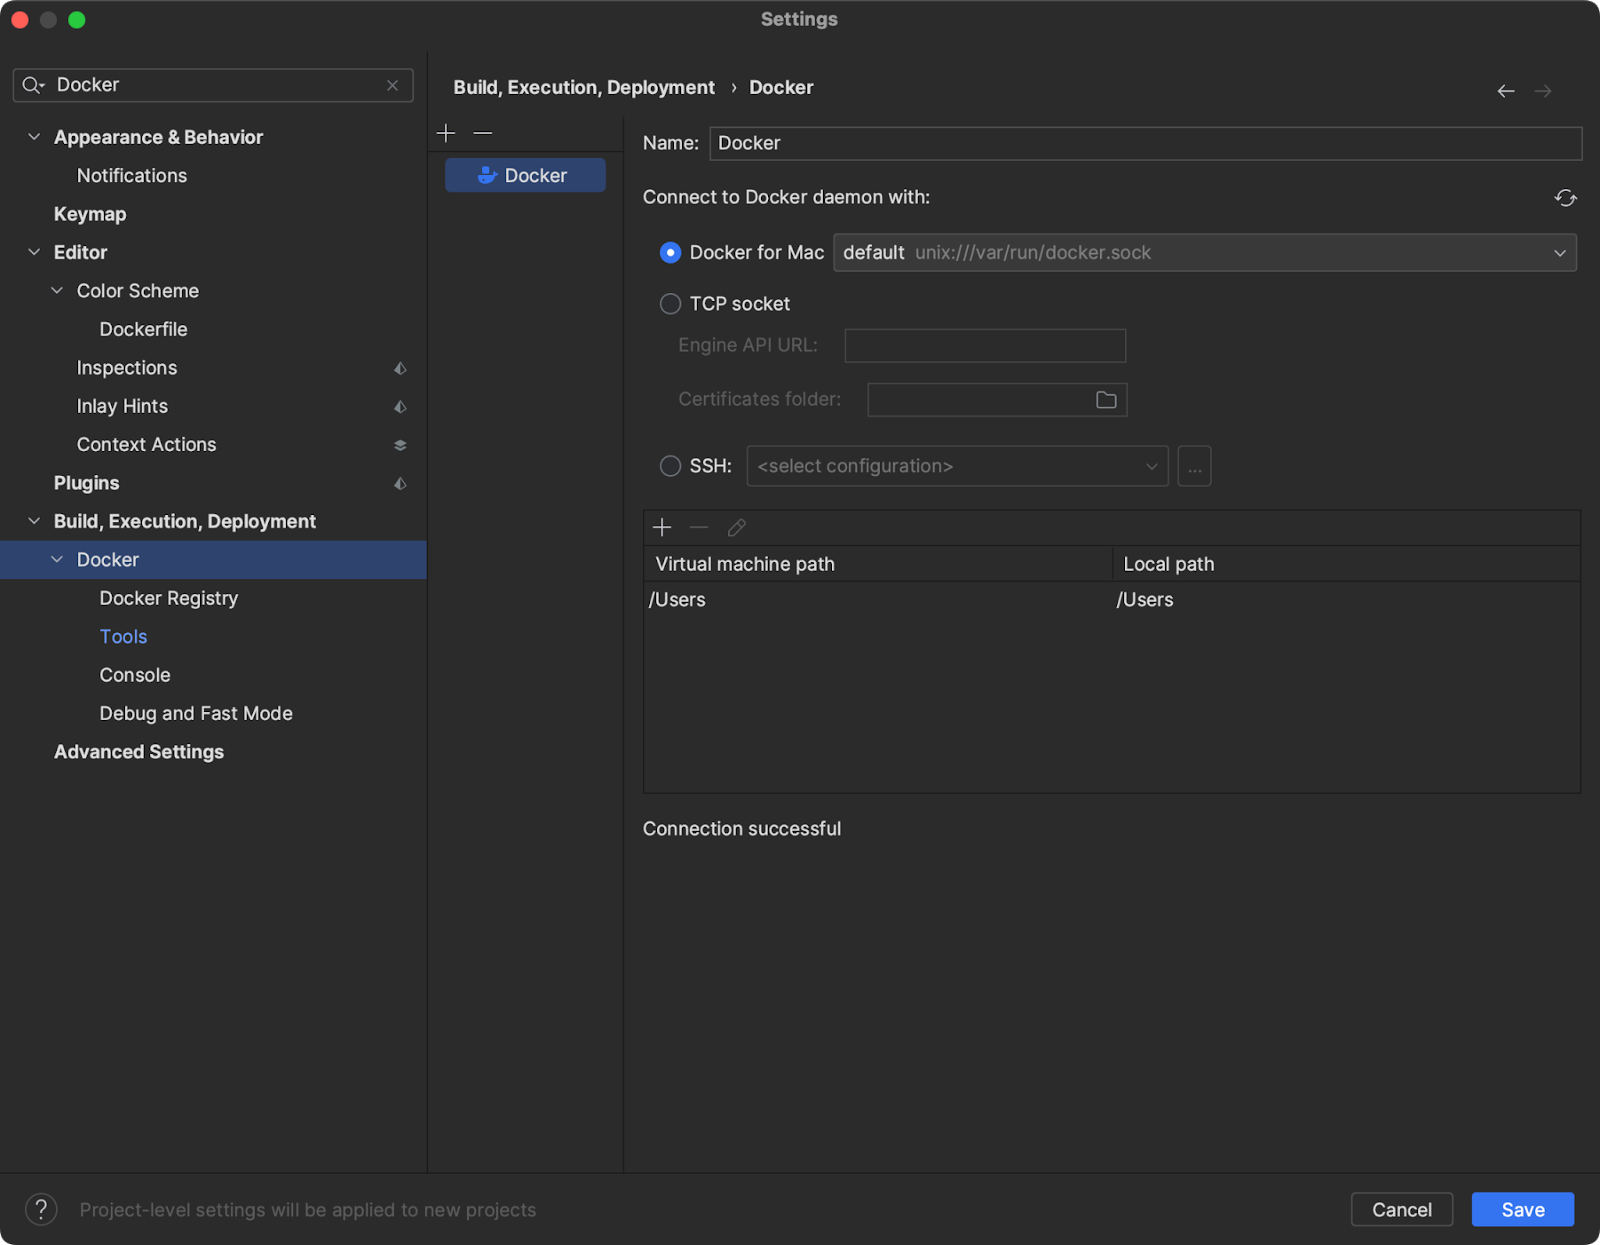
If you don’t see Docker in the settings window, ensure you have correctly installed Docker Desktop.
Next, you can open any existing project, and open the Services window. You should see the familiar Docker whale. You can connect to the Docker Desktop instance by double-clicking the whale icon. Once connected, you can see any running containers alongside images, networks, and volumes.
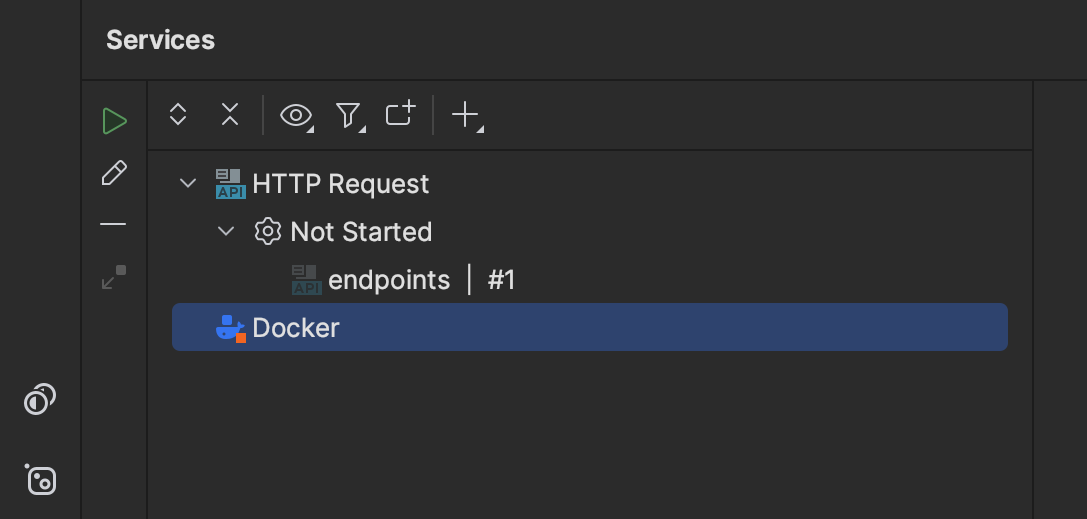
If you do not see the Docker icon, click the “+” symbol and choose Docker Connection. At this point, you can add a new connection.
Great. You should now be able to get started with .NET containerized development.
Debugging Docker containers with Rider
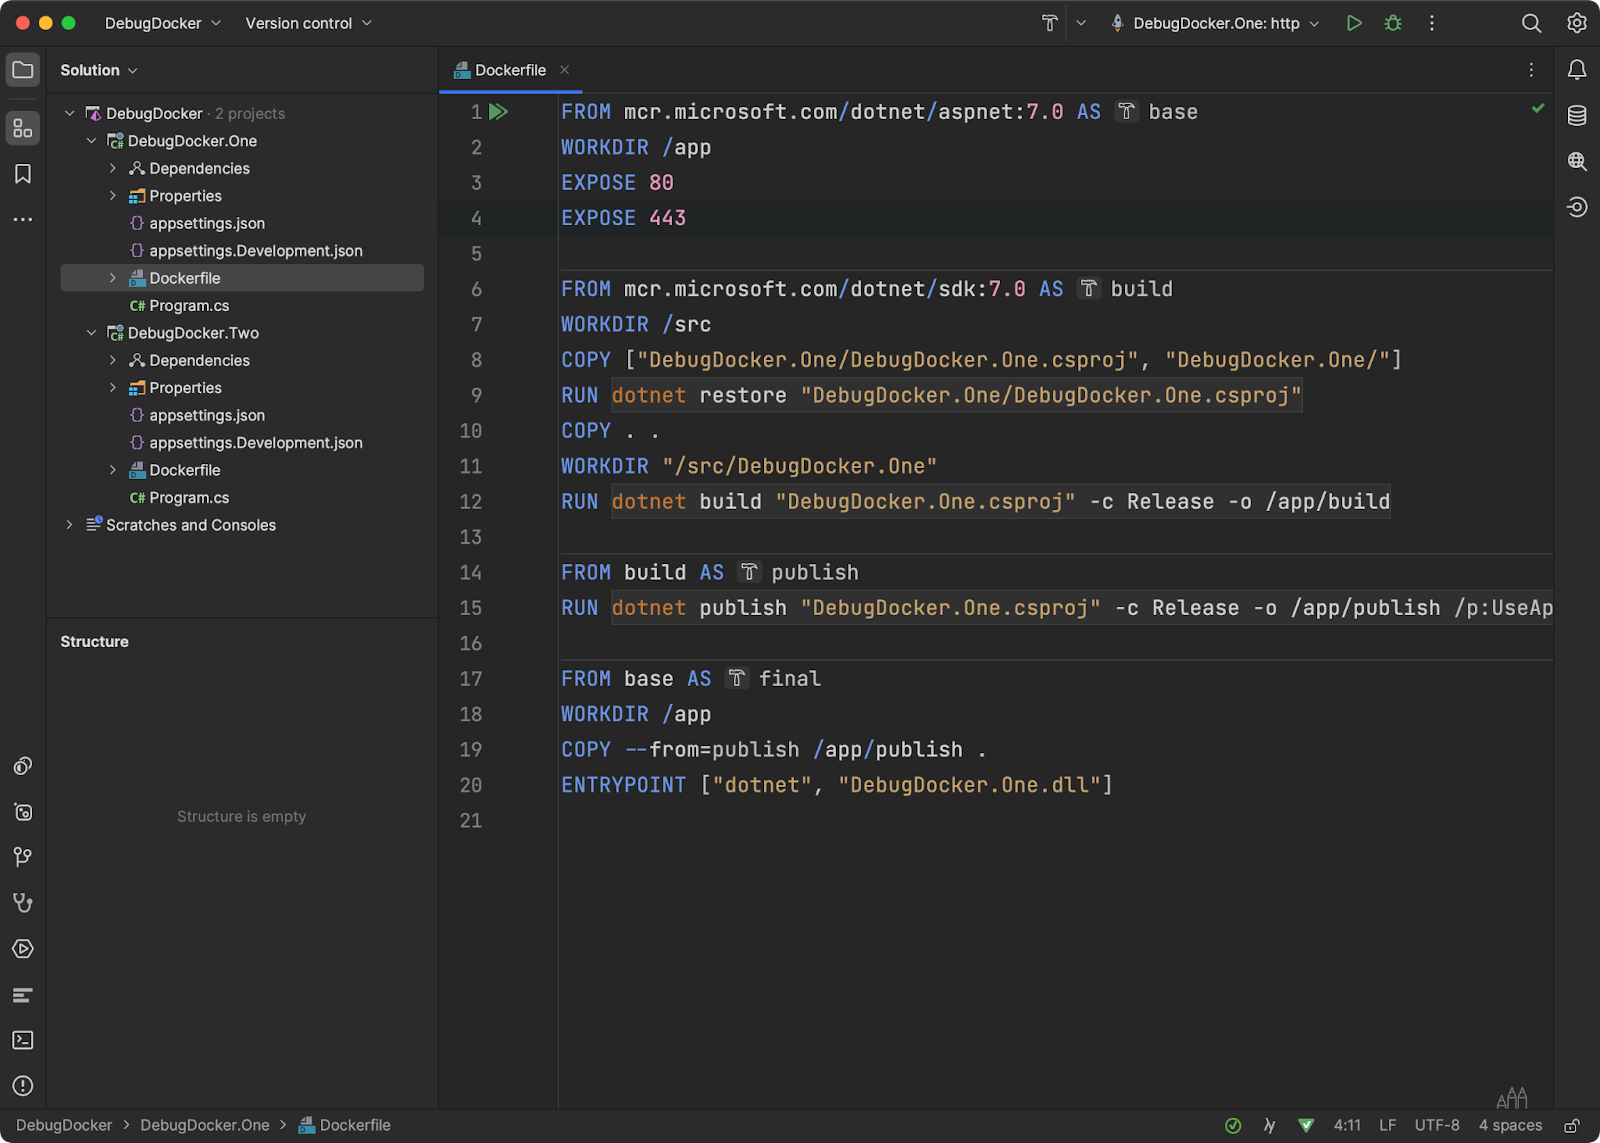
I’ll be using an ASP.NET Core solution with two web applications. When creating a new ASP.NET Core project, you’ll also have the chance to opt into Docker. Choosing Docker will add a DockerFile to your project.
With a DockerFile open, you can run the container. Before running the container, you can edit the run configuration to expose the container ports to the host. You’ll need the ports exposed to the host environment to hit an API endpoint.
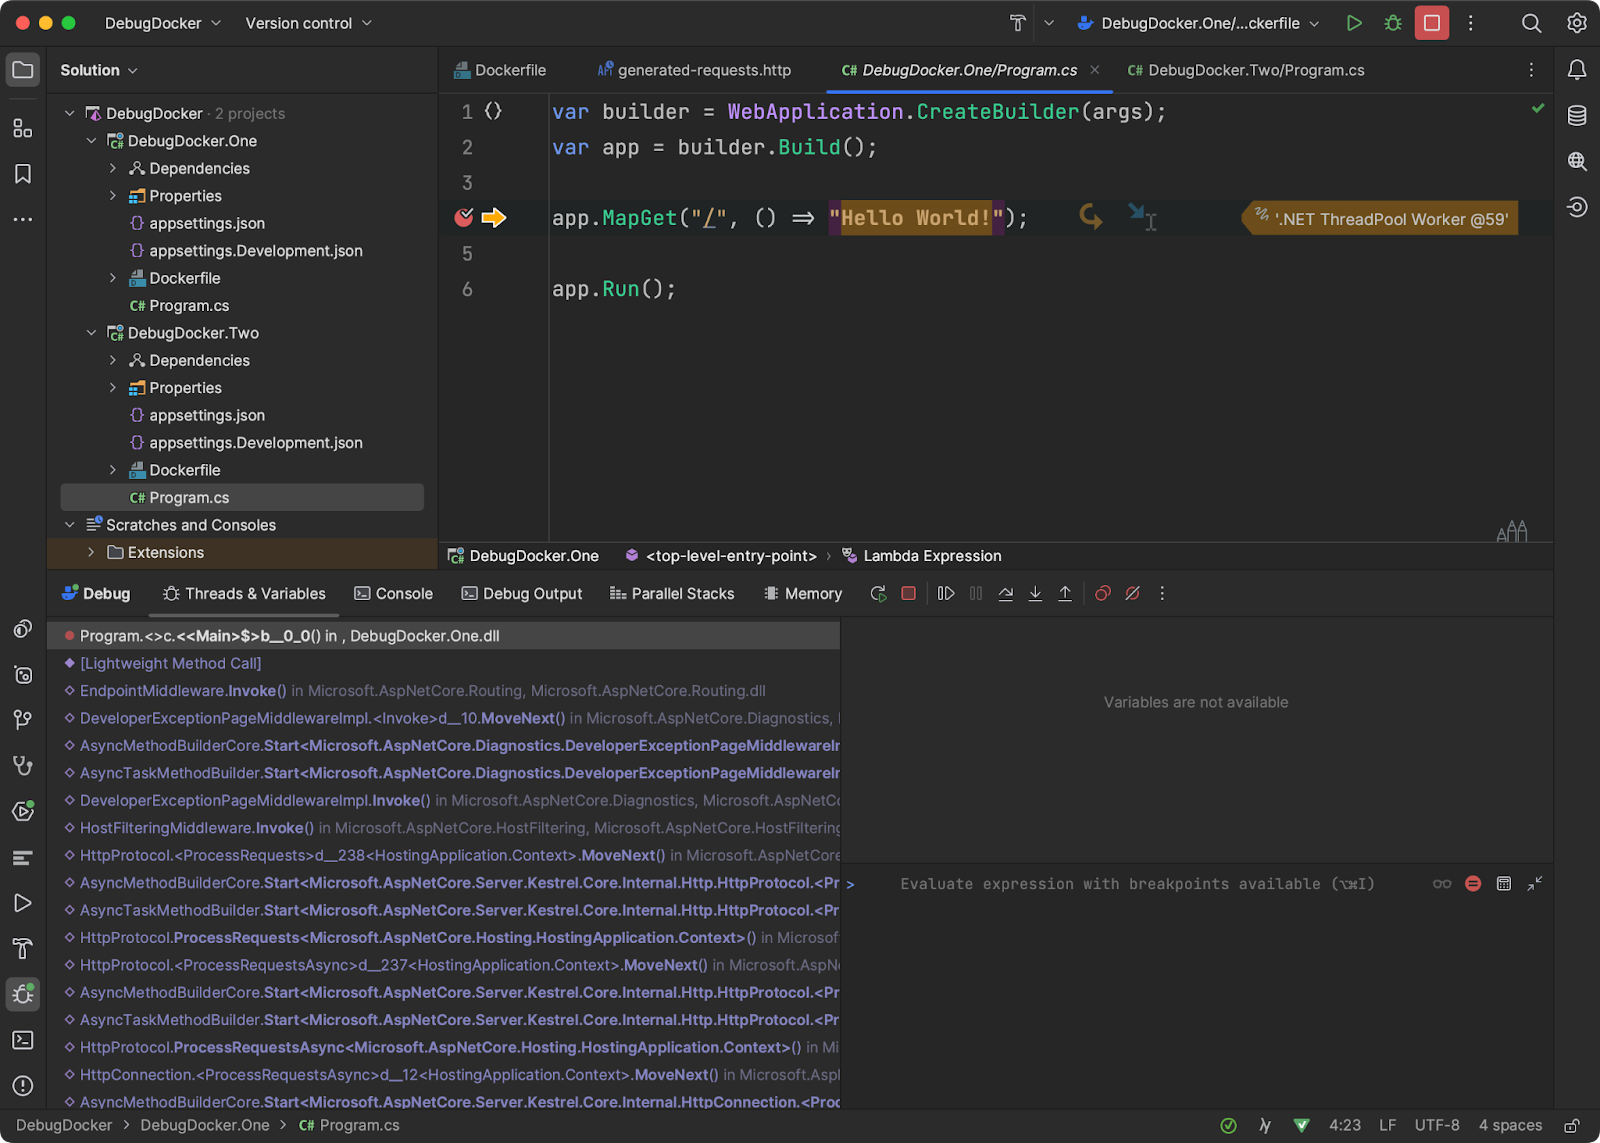
Now that your container is running, you can click the Debug button in the run toolbar. Furthermore, remember to add a breakpoint to see the debugger in action. Then, using the HTTP Client in Rider, you can call an endpoint to stop on your breakpoint.
Debugging Docker Compose with Rider
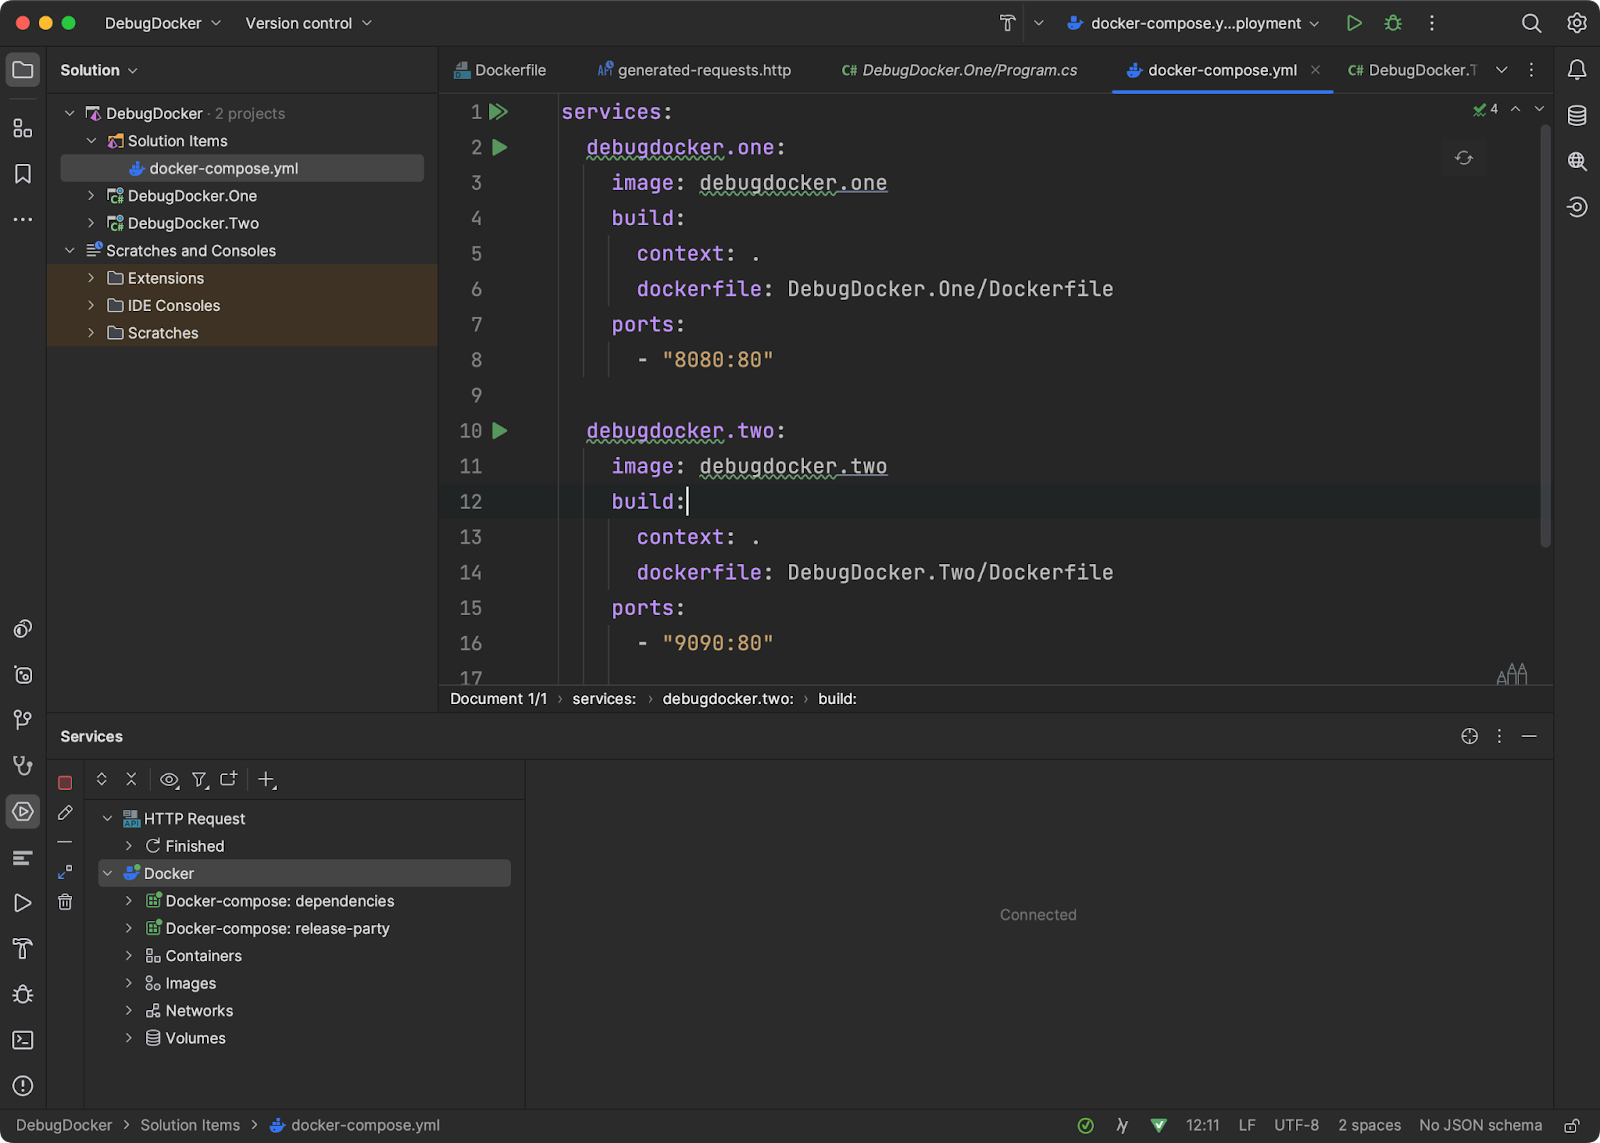
JetBrains Rider recently added a feature to help define a docker-compose.yml file. JetBrains Rider will add each service to a central docker-compose.yml file with a straightforward right-click of any ASP.NET Core project and then selecting “Docker Compose file”.
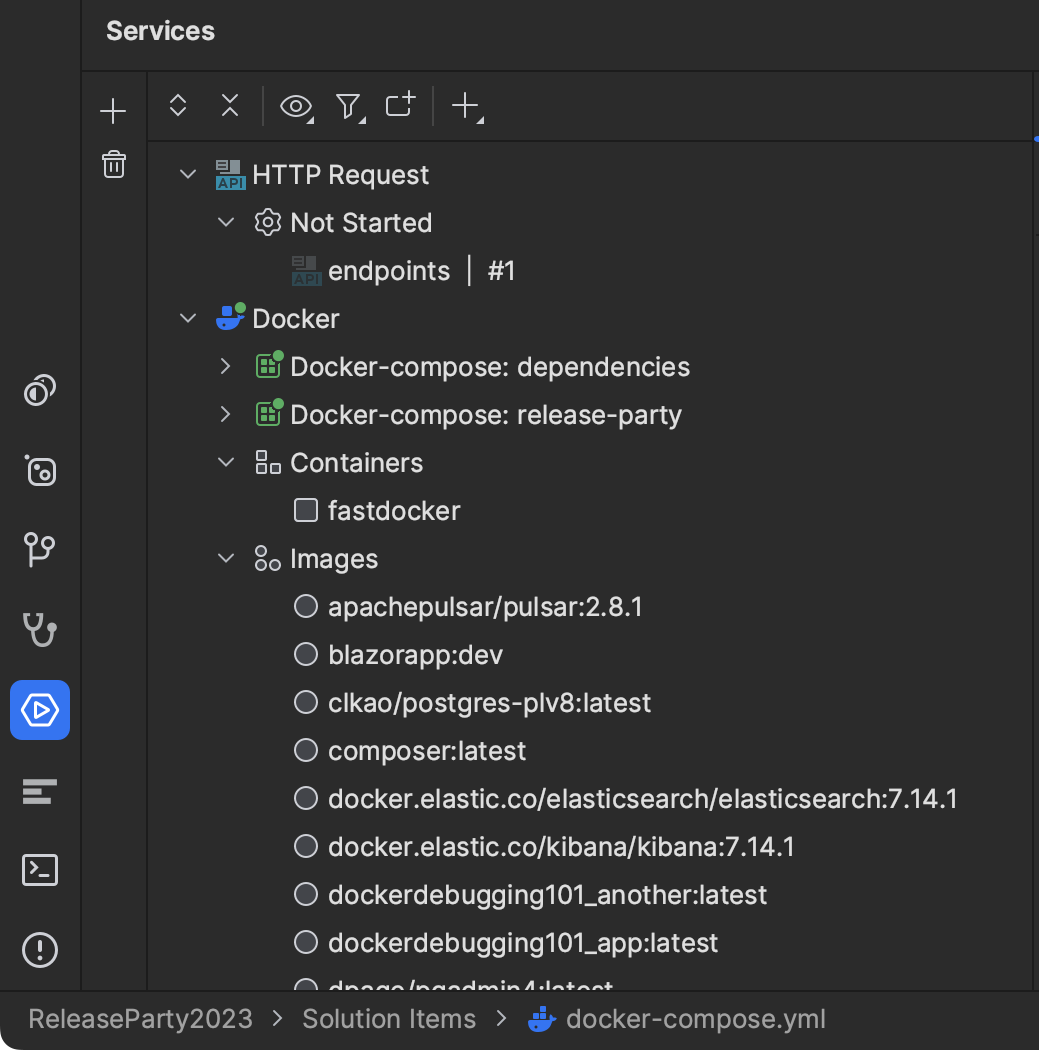
I’ve added two ASP.NET Core web projects to a docker-compose.yml file, altering the ports in my orchestrated application. Then, by clicking the play button at the top of the file, we get a run configuration and the application containers running in the services window.
You can now use the Debug button like debugging a single Docker container. Remember to set some breakpoints!
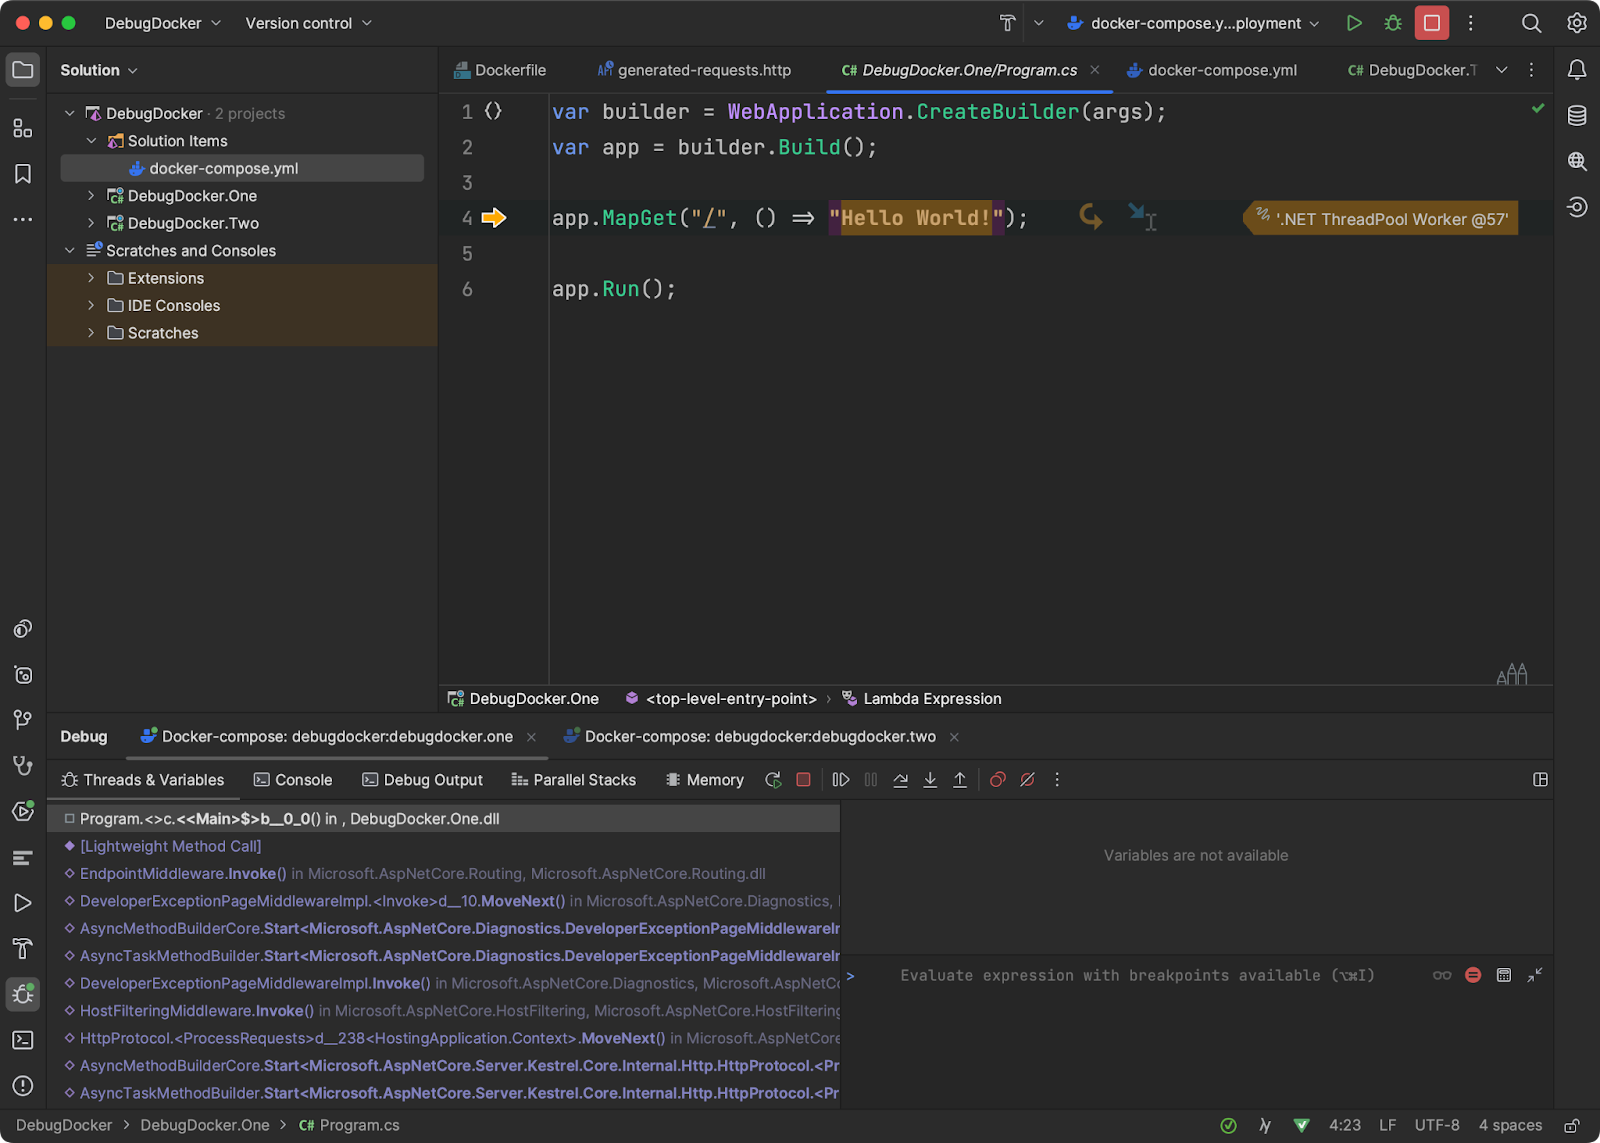
You should see a debugging session tab for each service. In case of issues, you can use the Services window to confirm the following items.
- First, make sure your container has started. You could have a start-up exception that exits the process prematurely.
- Make sure the debugger ports exist on your container. These are typically in the range of
57000. - You see container environment variables for
RESHARPER_LOG_CONFandRIDER_DEBUGGER_LOG_DIR. The presence of these variables ensures Rider successfully installed the debugger service into the container. - Be sure a mounted volume of the RiderRemoteDebugger directory exists.
If any of these items is missing, I suggest performing a Down action on your orchestration and rerunning the docker-compose file to recreate your solution within Docker Desktop.
Docker Compose Run Configuration labels
While fast mode is recommended for improving your development workflow, there are potential situations where you may want to disable it. For example, targeting the host operating system is essential when building artifacts using Ahead Of Time (AOT) compilation. In the case of AOT, the compile-time environment must match the run-time one.
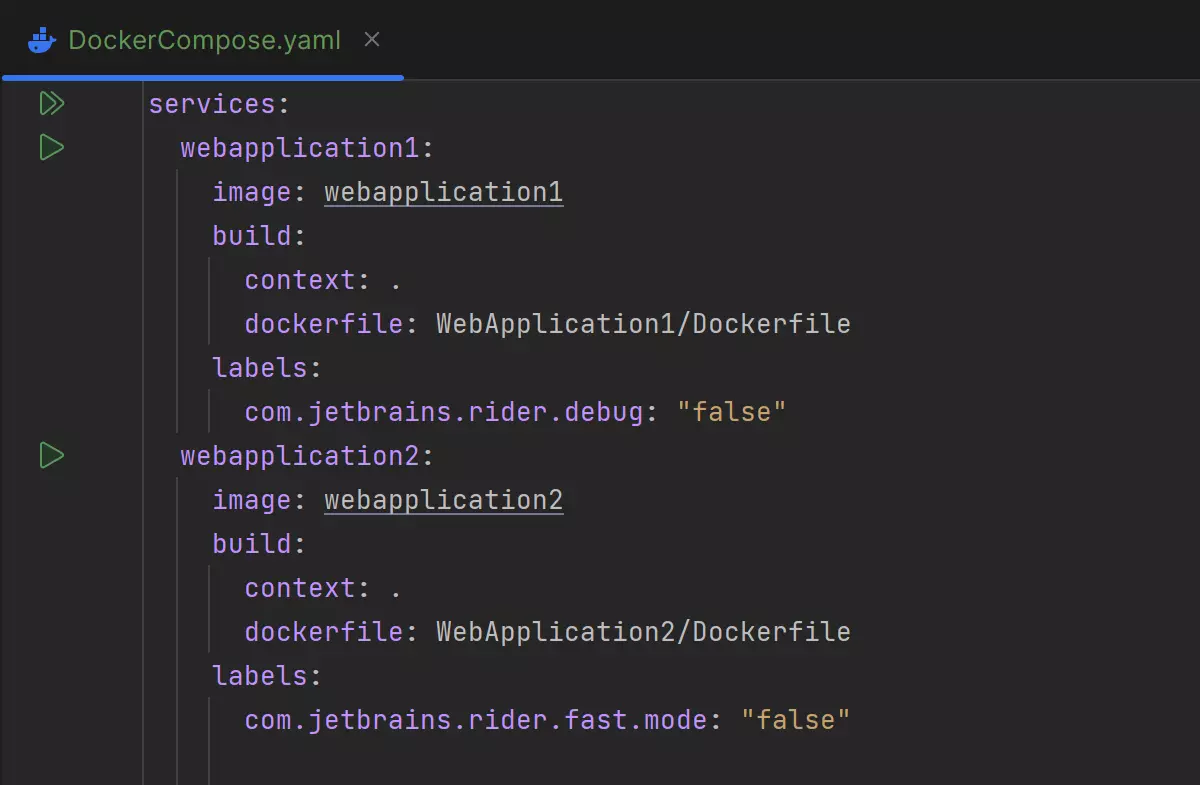
Starting with Rider 2023.2, it is easier for you to fine-tune Docker Compose’s run configuration by introducing labels in your docker-compose files. By adding labels to the docker-compose.yml file, you can specify how and if you want to run and debug your applications.
For example, if you want to disable fast mode for some of your services, you can set a com.jetbrains.rider.fast.mode: "false" label for each instance. If you want to disable debug mode, use the label com.jetbrains.rider.debug: "false".
This has the added benefit of existing with your docker-compose file and getting the benefit of team-sharing and source control.
Conclusion
Debugging Docker containers and an orchestrated solution is straightforward with JetBrains Rider. As a result, users can benefit from containerization without losing the developer productivity of a debugger. If you are encountering issues debugging your containers, please double-check that you have set up your environment correctly, ports are exposed, and that Rider has installed the debugger services in your container. Also, ensure you’ve upgraded to the latest JetBrains Rider and Docker Desktop versions.
As always, thanks for reading, and let us know what you think in the comments below.
image credit: Thomas Kelley