.NET Tools
Essential productivity kit for .NET and game developers
Elevating C# Code Quality with Qodana: A Journey Towards Perfection

JetBrains IDEs have always been renowned for their powerful static code analysis supporting a wide range of languages. With the release of Qodana, we are unifying that knowledge in a central code quality platform that is working at the heart of every development process – your favorite CI/CD tool.
Triggered by a commit or pull request, Qodana can generate comprehensive analysis reports (SARIF) about all discovered code quality and security issues. Qodana makes those reports easily accessible, not only to a team of developers or QA engineers but also to security managers and legal/compliance departments.
Only recently, Qodana has made its first steps into our lineup of .NET tools, and as you might guess, it comes with remarkable integration for Rider. The analysis itself is based on an old acquaintance, namely InspectCode, which you might know from other blog posts like Establishing a zero-warning policy with ReSharper’s solution-wide analysis or ReSharper Command-Line Tools – Cross-Platform and Global Tools. InspectCode runs the same analysis that discovers code issues in Rider and ReSharper. However, working on your CI/CD agent provides the substantial benefit that the Solution-Wide Analysis no longer has to run on your local machine, which translates to a better development experience, responsiveness, and battery life.
If you want to see a Qodana report live and in action, head over to the public reports of FluentAssertions or NUKE. If you want to try Qodana on your own project and learn more about its professional capabilities in various CI/CD environments and Rider itself, stay with us for the next sections!
Setting up Qodana for .NET projects
Qodana runs in a Docker container, so you should have Docker installed locally and in your CI/CD environment. For the local experience, it is also recommended to install the Qodana CLI (although you can also invoke Docker directly):
- On Windows with WinGet:
winget install -e --id JetBrains.QodanaCLI - On Windows with Chocolatey:
choco install qodana - On macOS:
brew install jetbrains/utils/qodana - On Linux:
curl -fsSL https://jb.gg/qodana-cli/install | bash
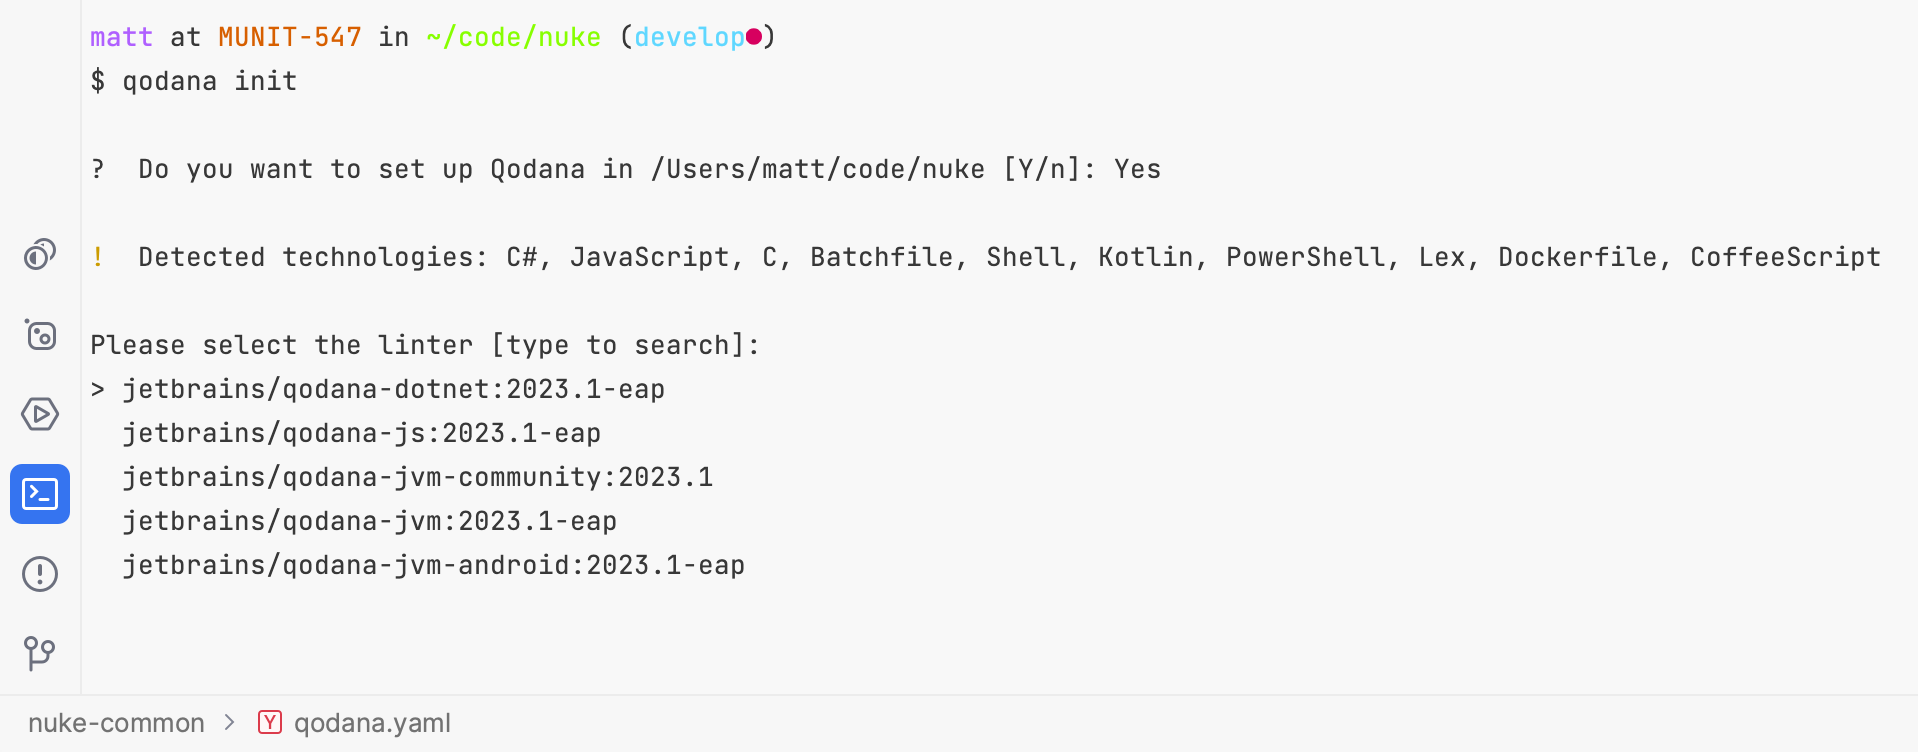
In the next step, you can invoke qodana init to trigger the setup wizard:
Once you’ve chosen the appropriate linter and your solution file, Qodana should have created a qodana.yml configuration file similar to the following:
version: "1.0"

linter: jetbrains/qodana-dotnet:latest

dotnet:
  solution: MySolution.sln
For more information about .NET-related settings, refer to the Qodana for .NET documentation.
Now you are ready to execute a local Qodana Scan by calling qodana scan --show-report. Once the scan has finished, Qodana will open an HTML report in your browser at http://localhost:8080.
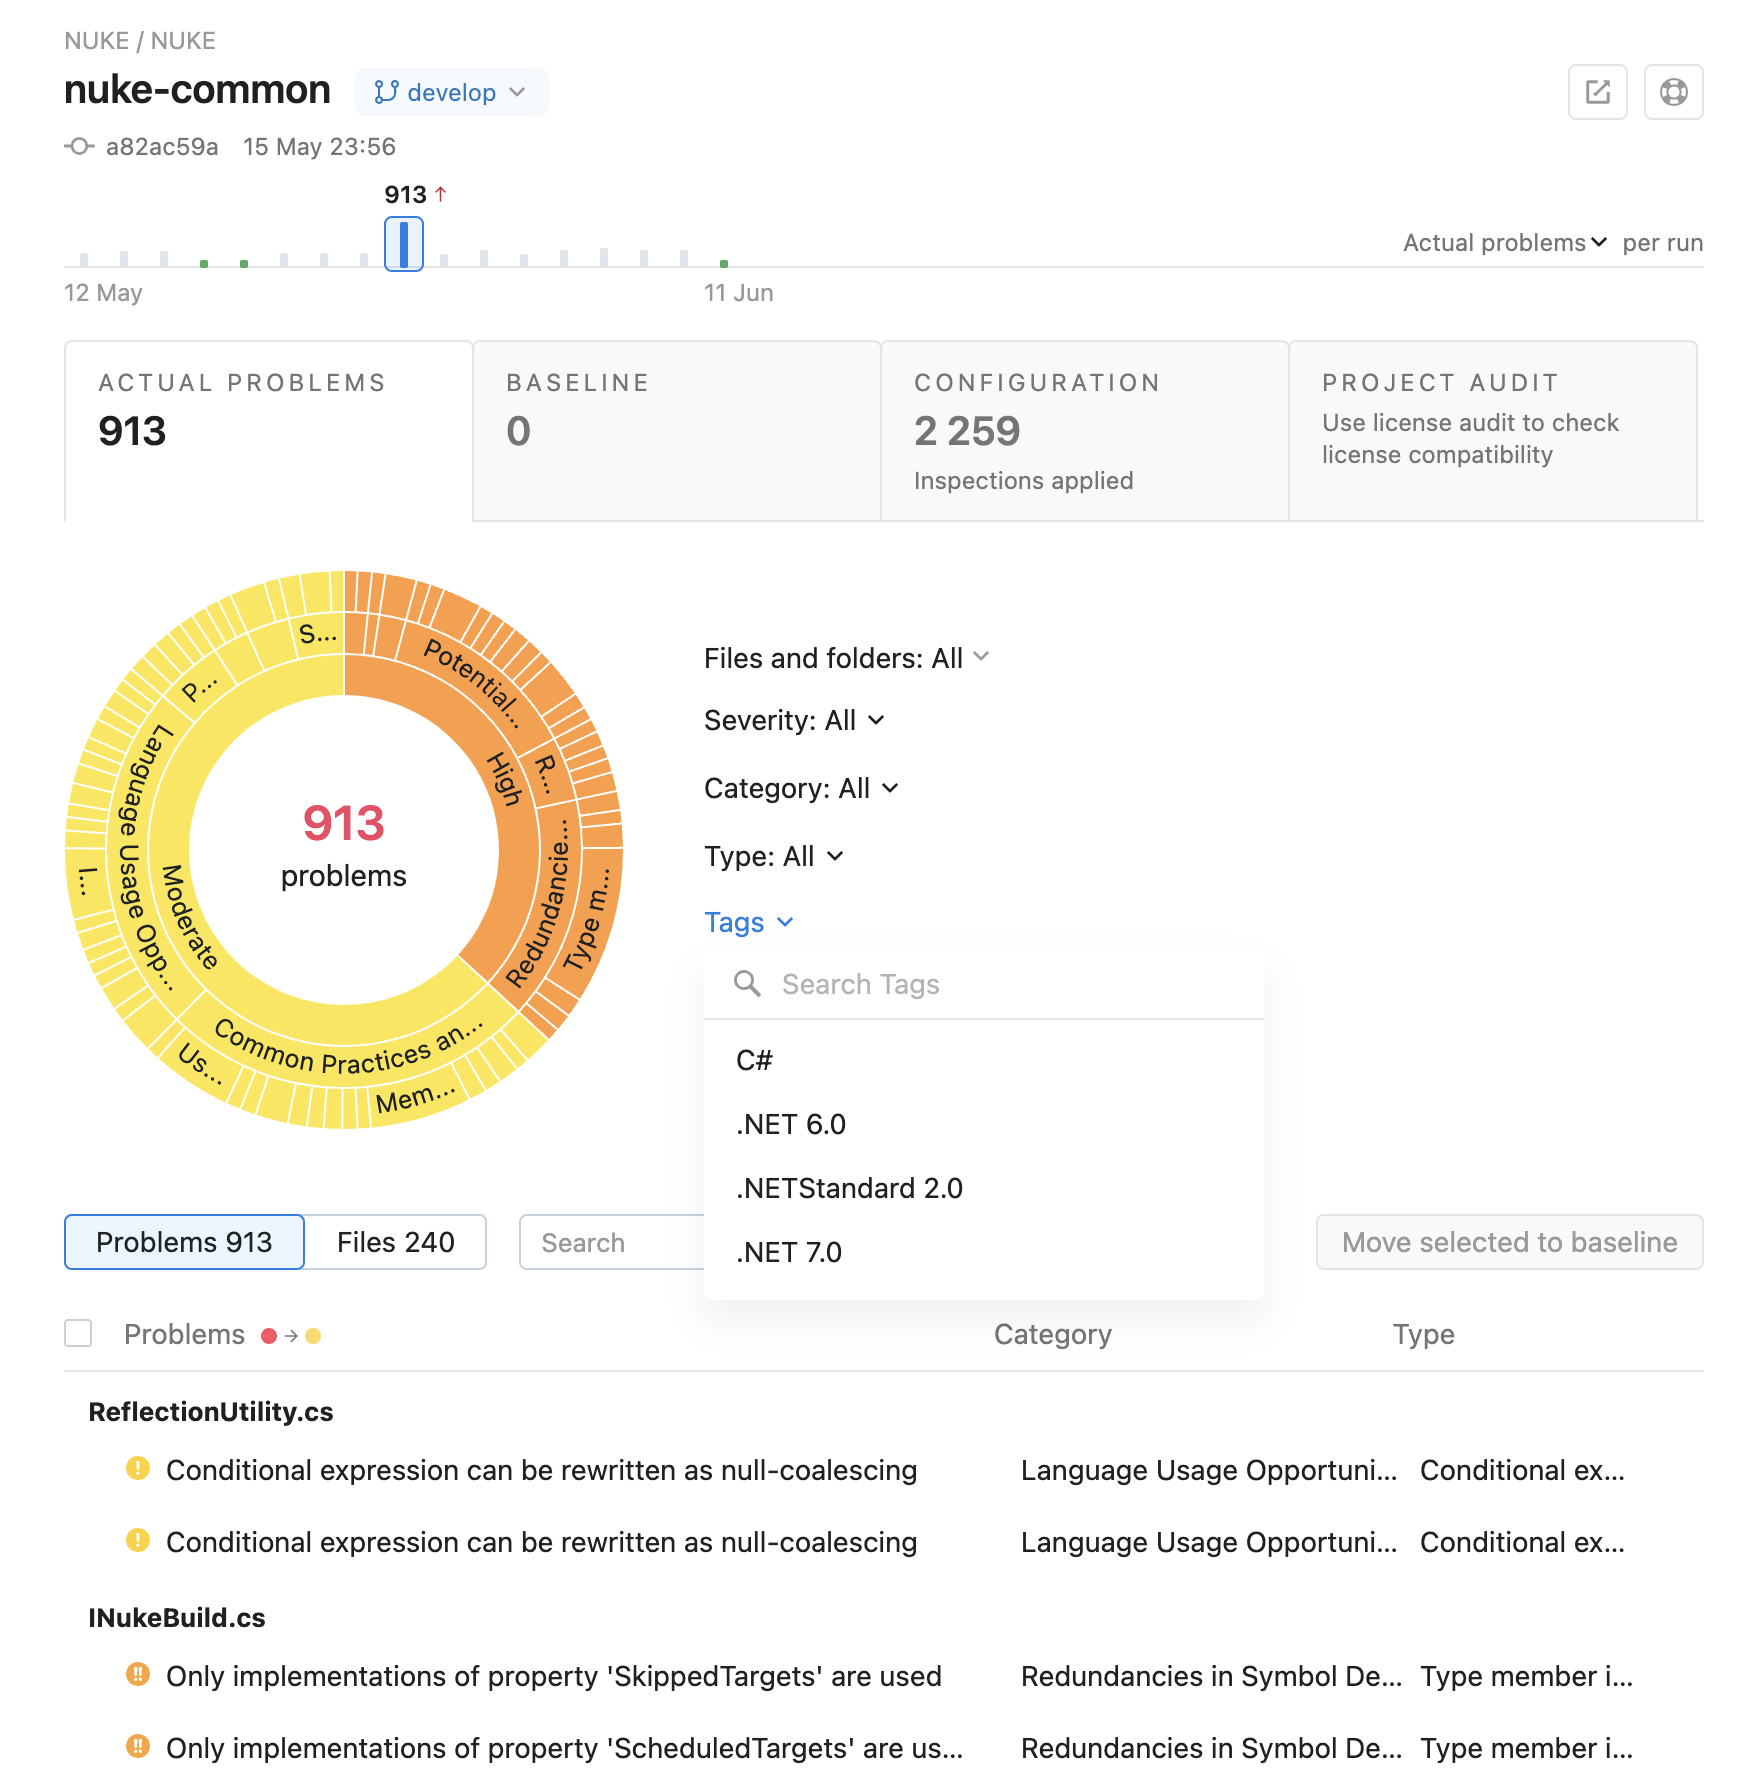
In addition to the general User interface overview, it’s noteworthy that for .NET projects you can filter by target framework from the Tags dropdown. And since sunburst charts are cool, let’s see how you can interact with them to filter results!
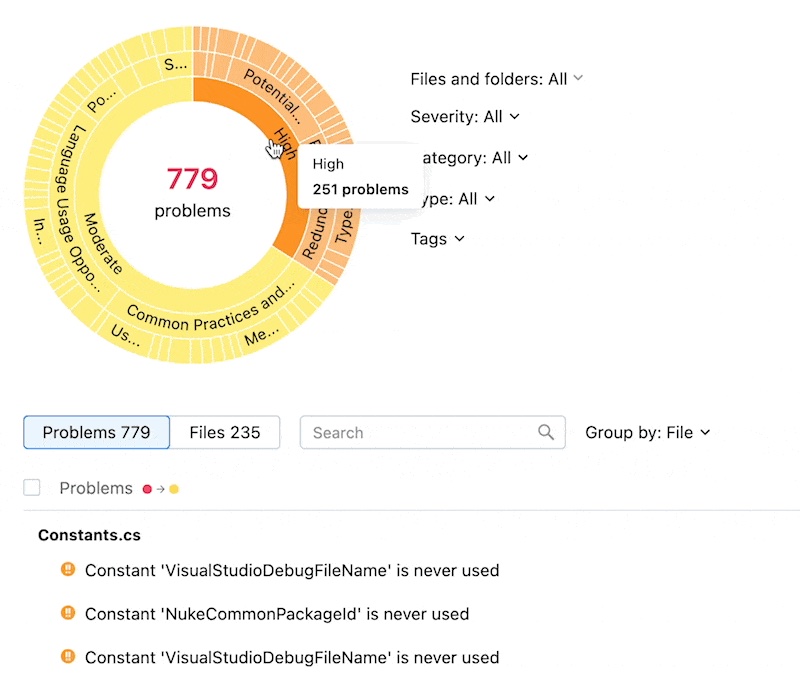
Super cool! ?
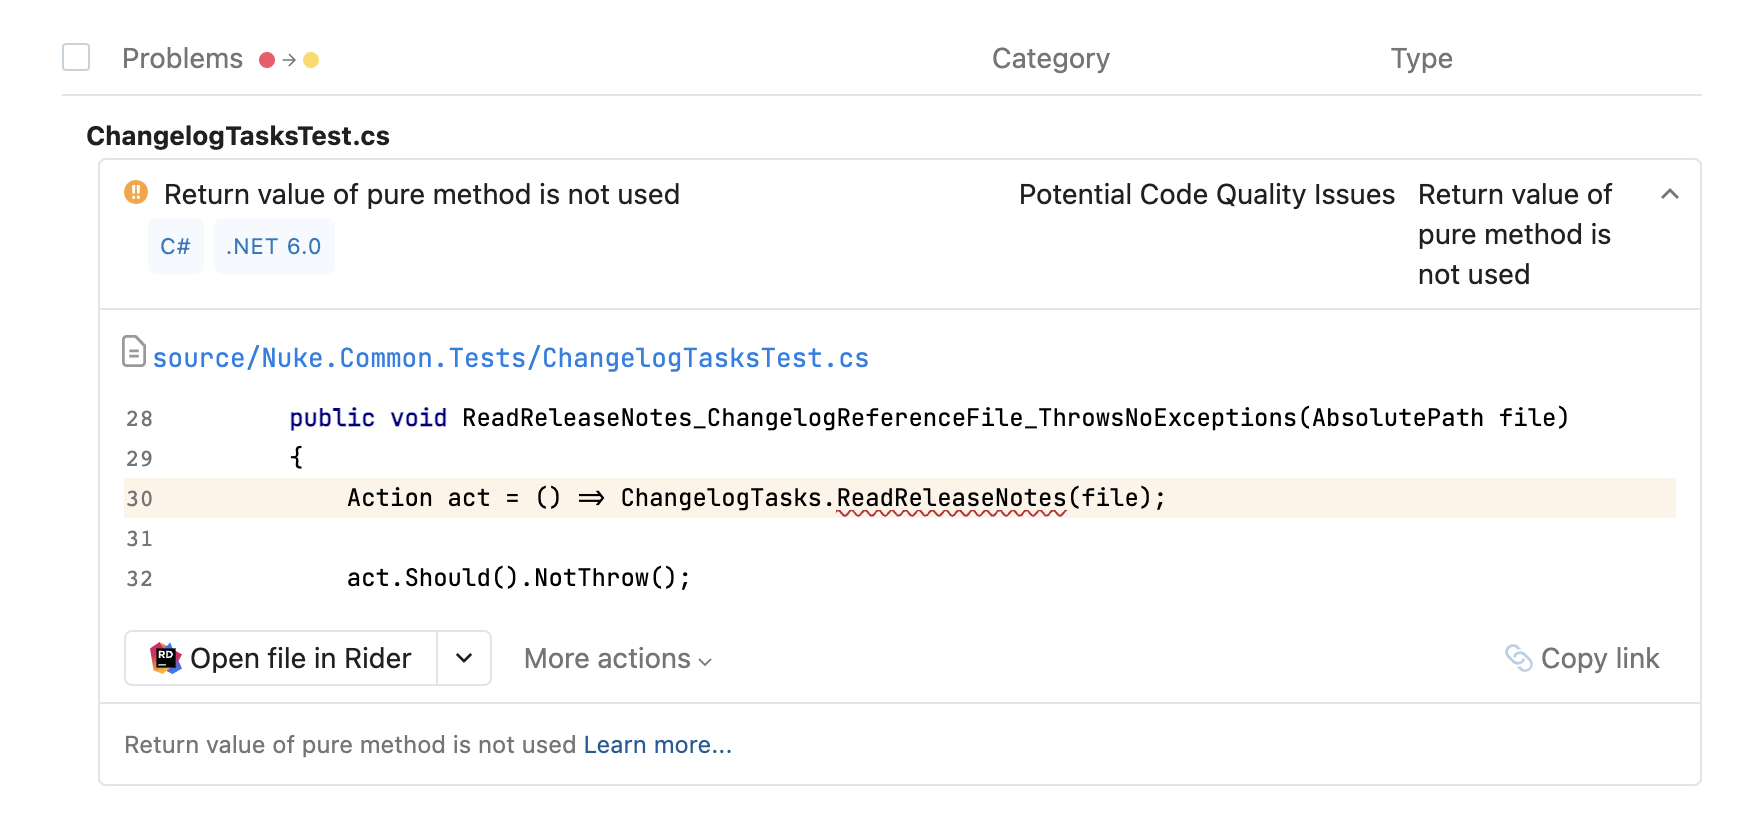
Once you’ve found an issue you intend to investigate, you can expand it to show more details besides the generic issue text/category/type. In the details pane, you can see the actual code snippet along with the file path and target framework. Special attention should be put on the Open file in Rider button, which opens the file directly in your IDE, as well as the footer note with a link to our Why is ReSharper suggesting this? knowledge base:
Qodana Scans in CI/CD Environments
Qodana develops its full potential when you integrate it into your CI/CD environment. Every build should generate a new analysis report that can either be uploaded to Qodana Cloud, or downloaded and inspected in Rider. You can also establish a so-called quality gate in your build pipelines, similar to the approach described in the Establishing a zero-warning policy with ReSharper’s solution-wide analysis blog post. Whenever a commit or pull request introduces a code issue, Qodana will let you know by failing the build.
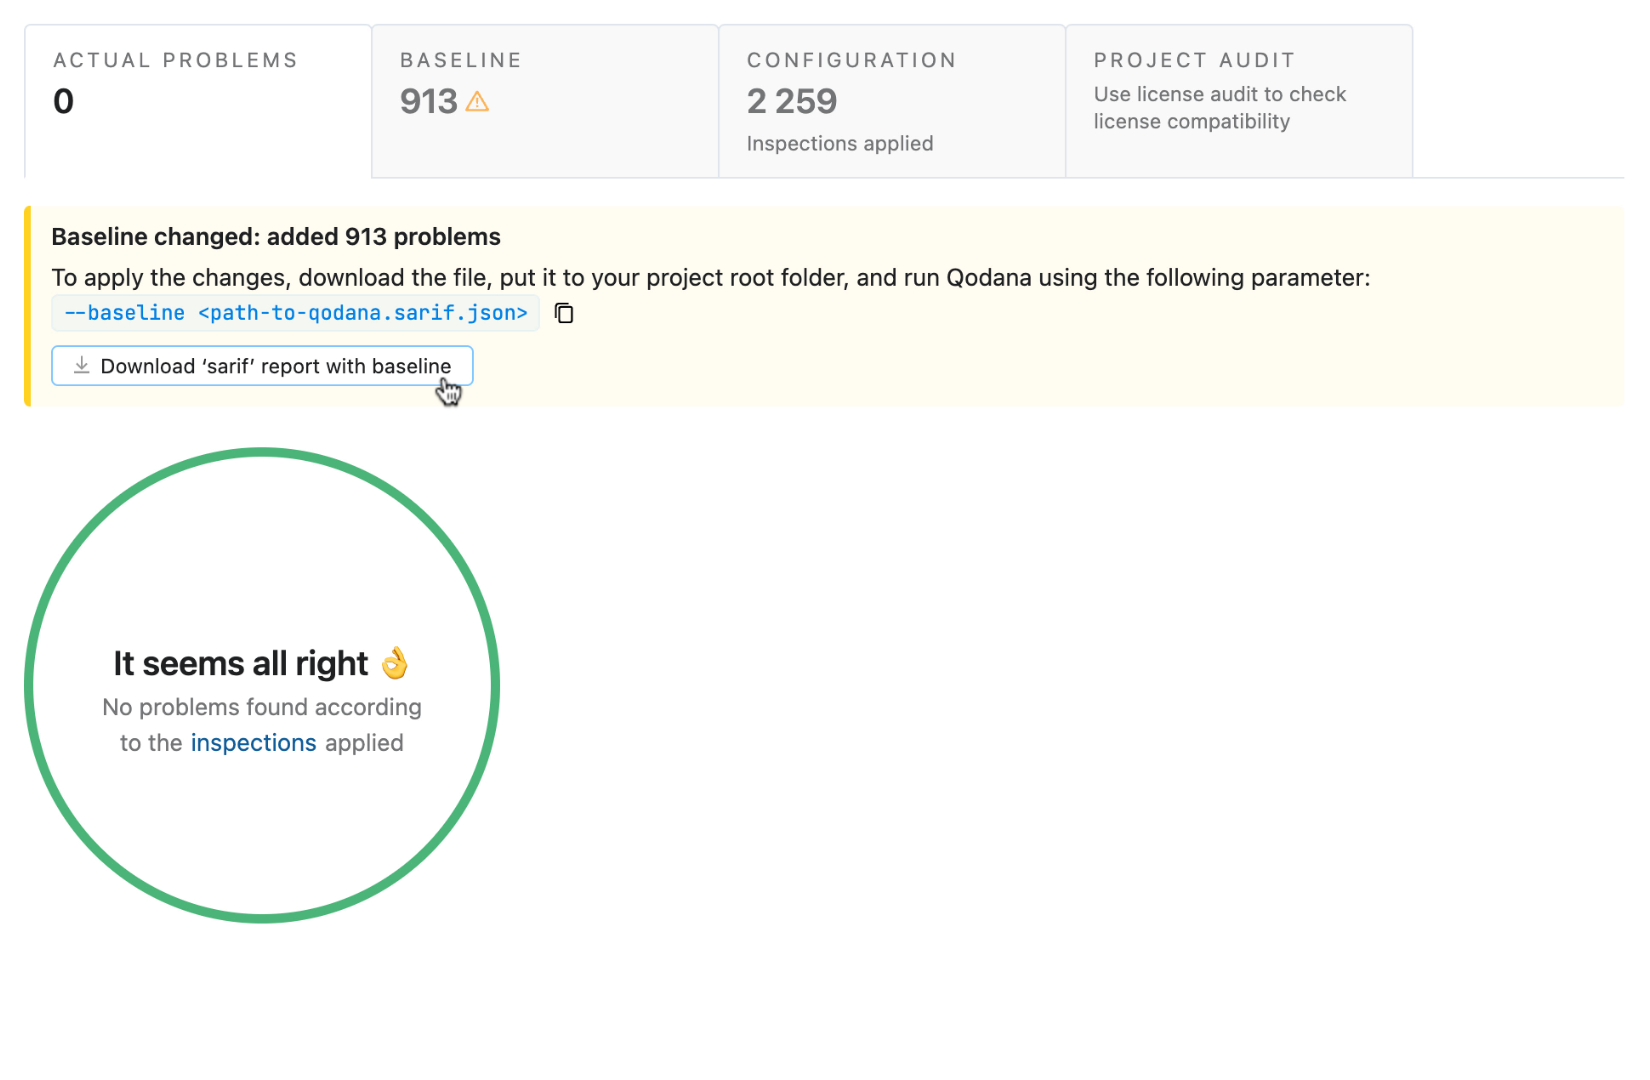
You can enable a code quality gate in three easy steps. For non-greenfield projects, you’ll likely want to move all the existing problems to the baseline (similar to a backlog) to reduce any obstruction:
Second, you need to extend the qodana.yml configuration file with a failThreshold value. This property indicates how many new issues can appear compared to the baseline without failing the build:
version: "1.0"

linter: jetbrains/qodana-dotnet:latest
failThreshold: 0

dotnet:
  solution: MySolution.sln
Third, you have to configure the build pipeline to compare the current set of code issues against the baseline. This can be done by passing --baseline qodana.sarif.json to the Qodana Scan invocation. Check out the Qodana documentation to find more information about how to enable a quality gate in your CI/CD environment.
Optionally – if you want to take advantage of Qodana Cloud – you can add the QODANA_TOKEN as an environment variable, which will let Qodana continuously upload the reports and allow you to keep an eye on its historical course. Alternatively, you can always use the qodana show command to serve a downloaded report locally.
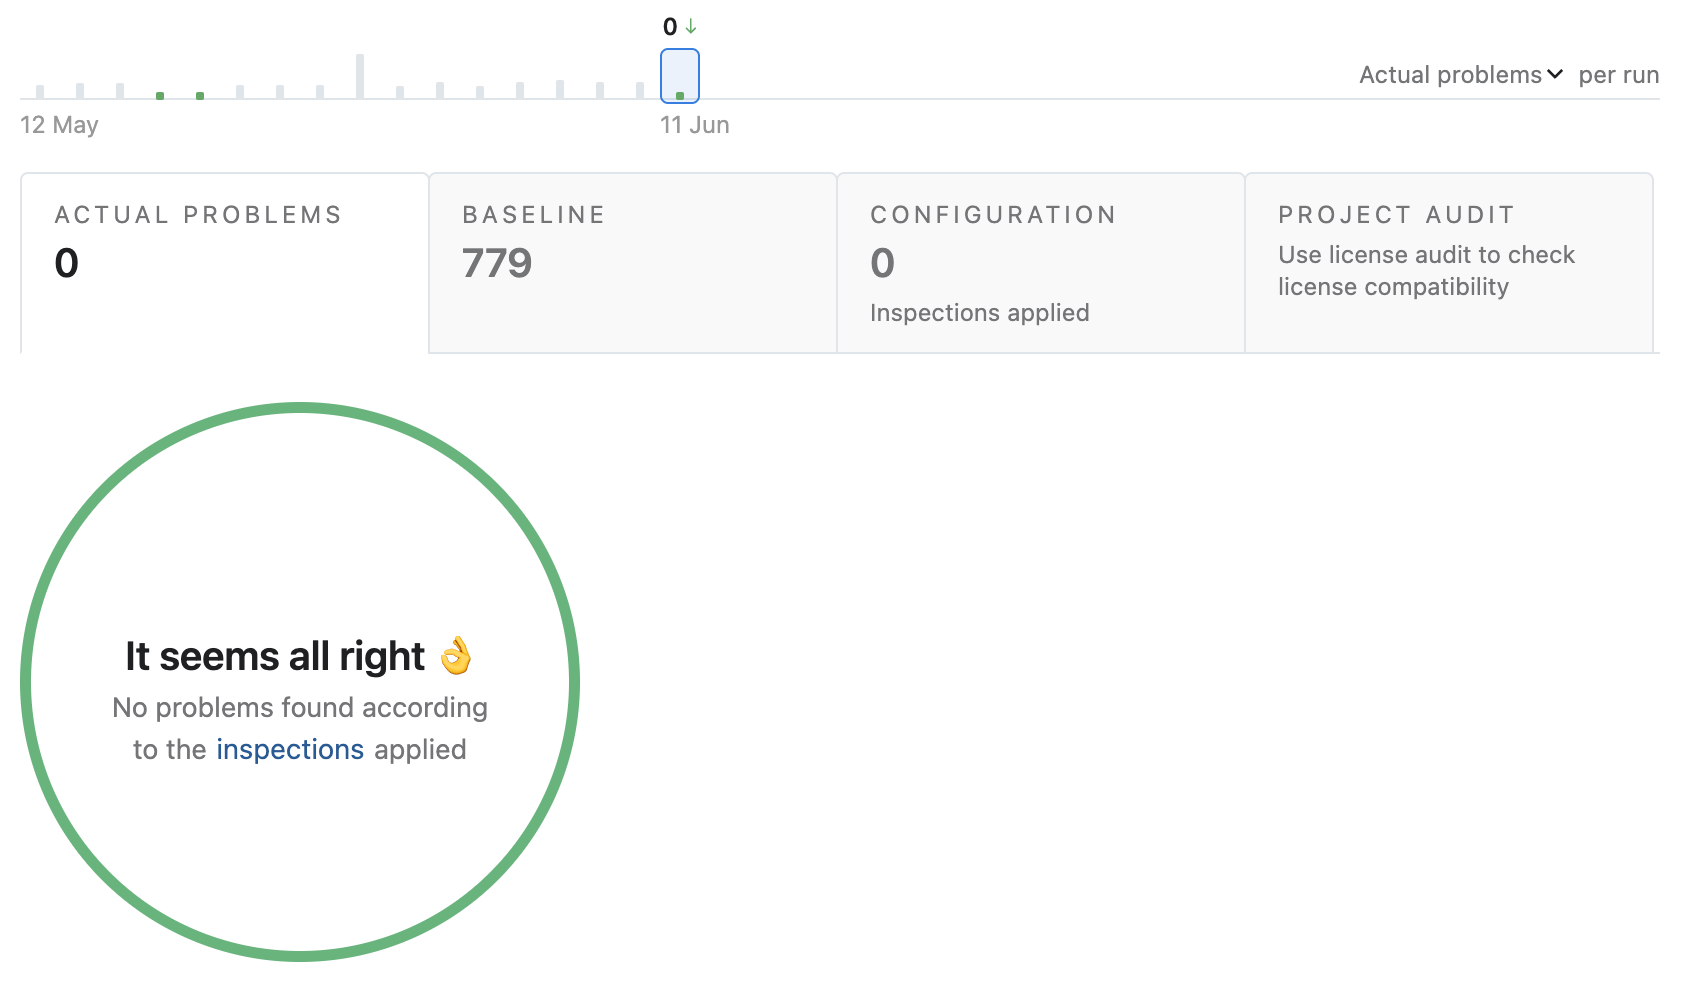
The next Qodana Scan should look as follows, where all problems have been moved to the Baseline tab:
In the next few sections, we will look at how Qodana integrates with some of the most popular CI/CD environments on the market. For further details, please refer to the documentation on GitHub Actions, Azure Pipelines, TeamCity, GitLab, CircleCI, Space Automation, and Jenkins.
Qodana in GitHub Actions
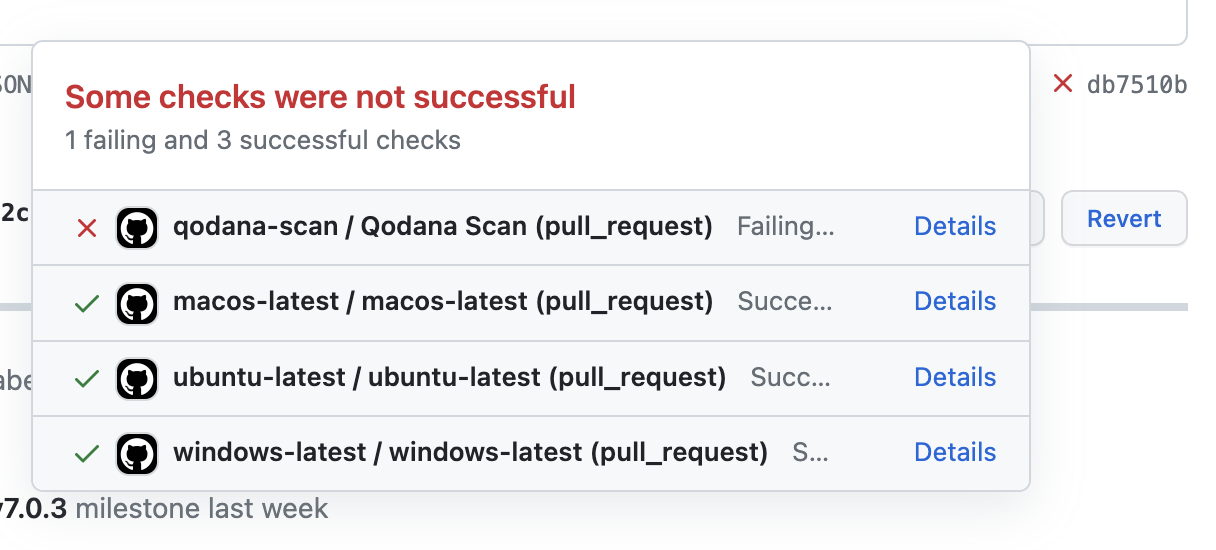
In GitHub Actions, Qodana can act as a status check for every commit and pull request that is built:
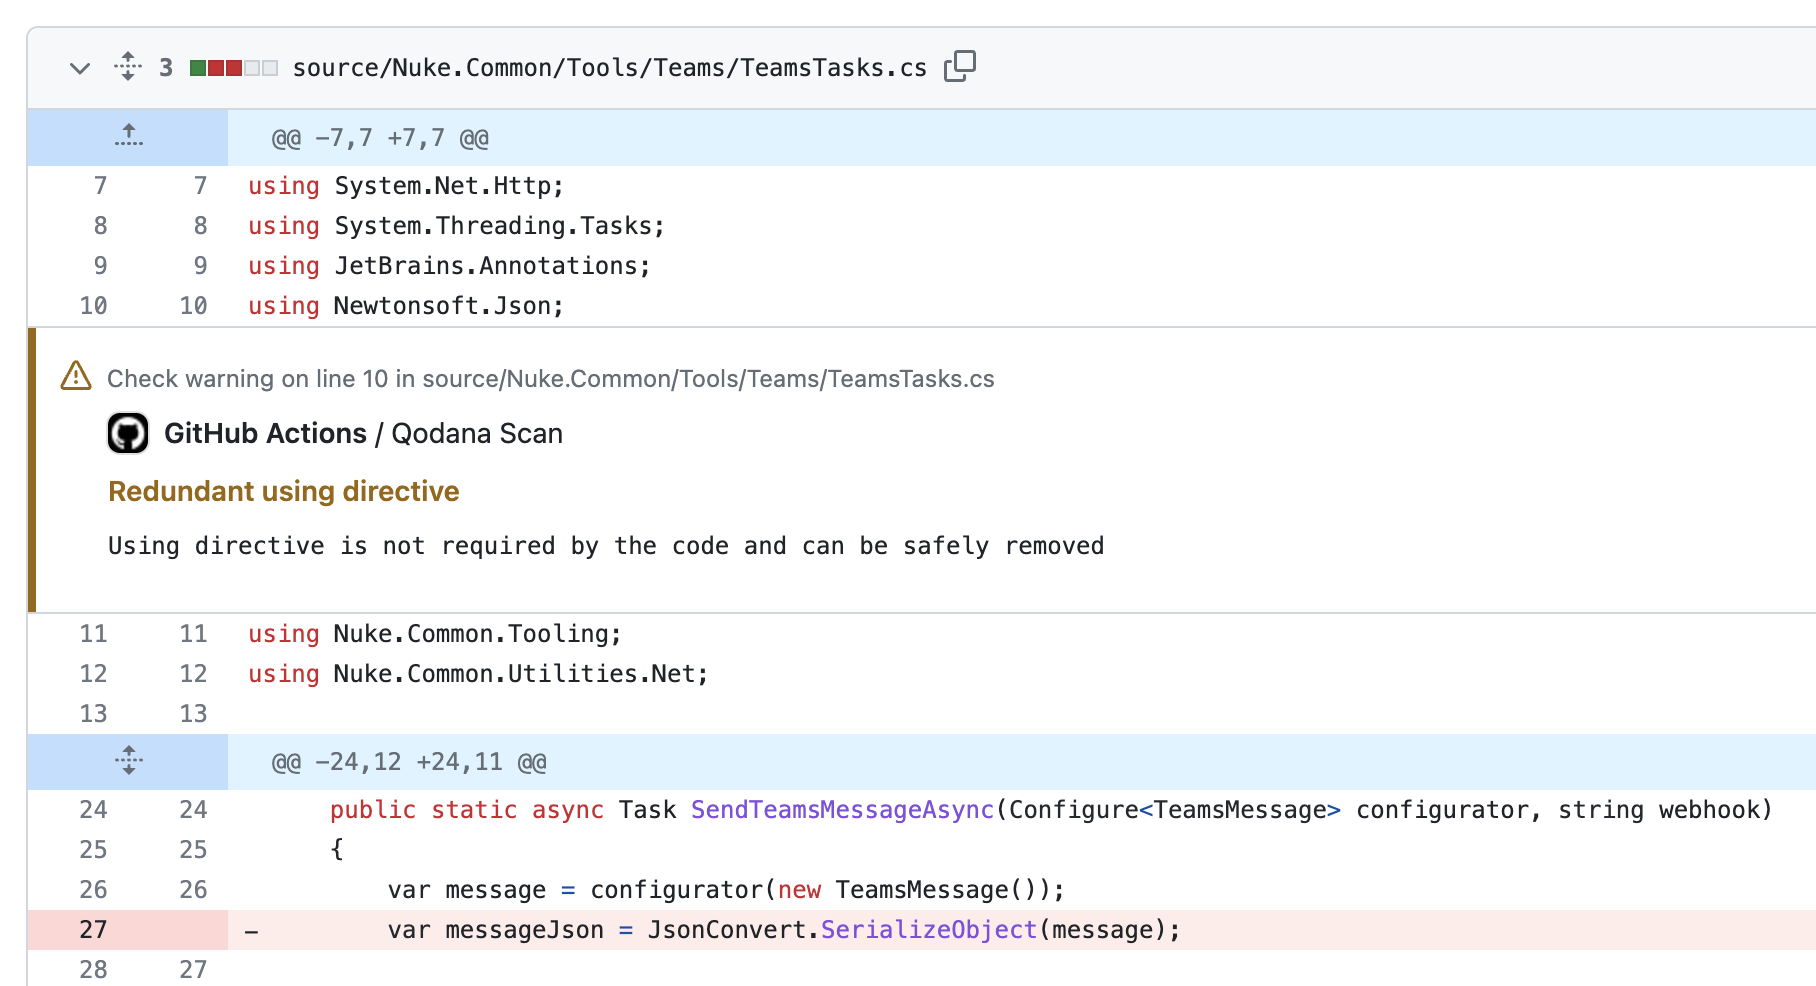
For pull requests in particular, Qodana will add code annotations that help code reviewers and committers spot issues at a glance immediately:
Qodana in Azure Pipelines
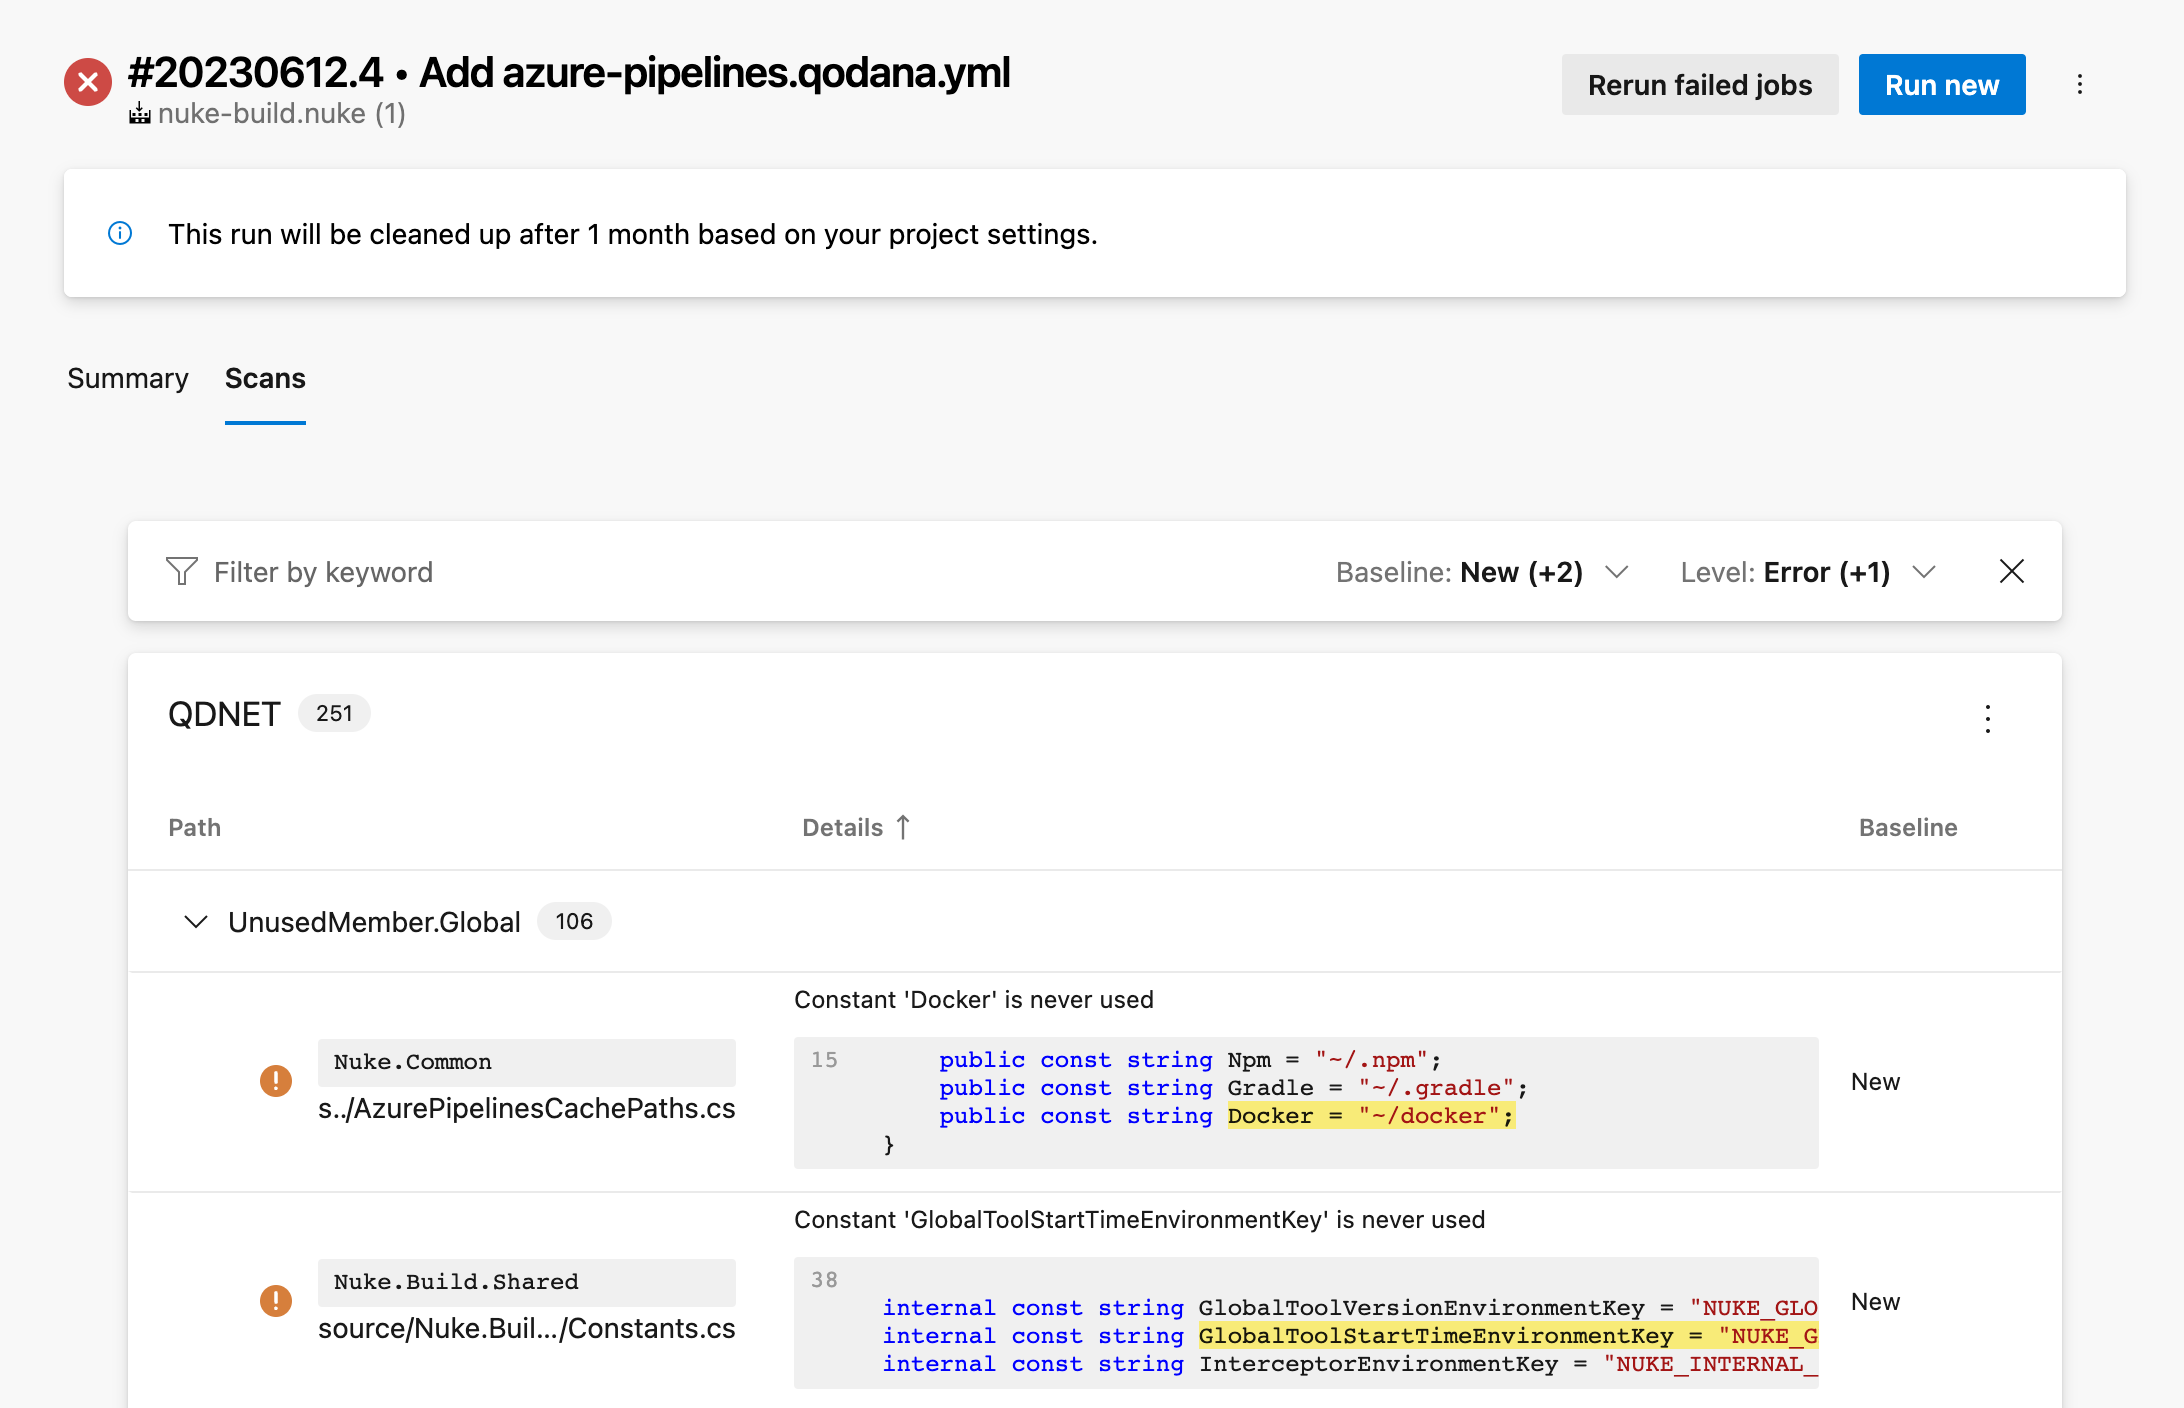
Since Qodana generates reports as SARIF files – an industry standard – they can be integrated into Azure Pipelines through the SARIF SAST Scans Tab:
Qodana in TeamCity
With TeamCity – our own powerful CI/CD tool – the Qodana report is brought directly into the build details view as a separate tab. You can even compare reports from different builds to see what has changed:
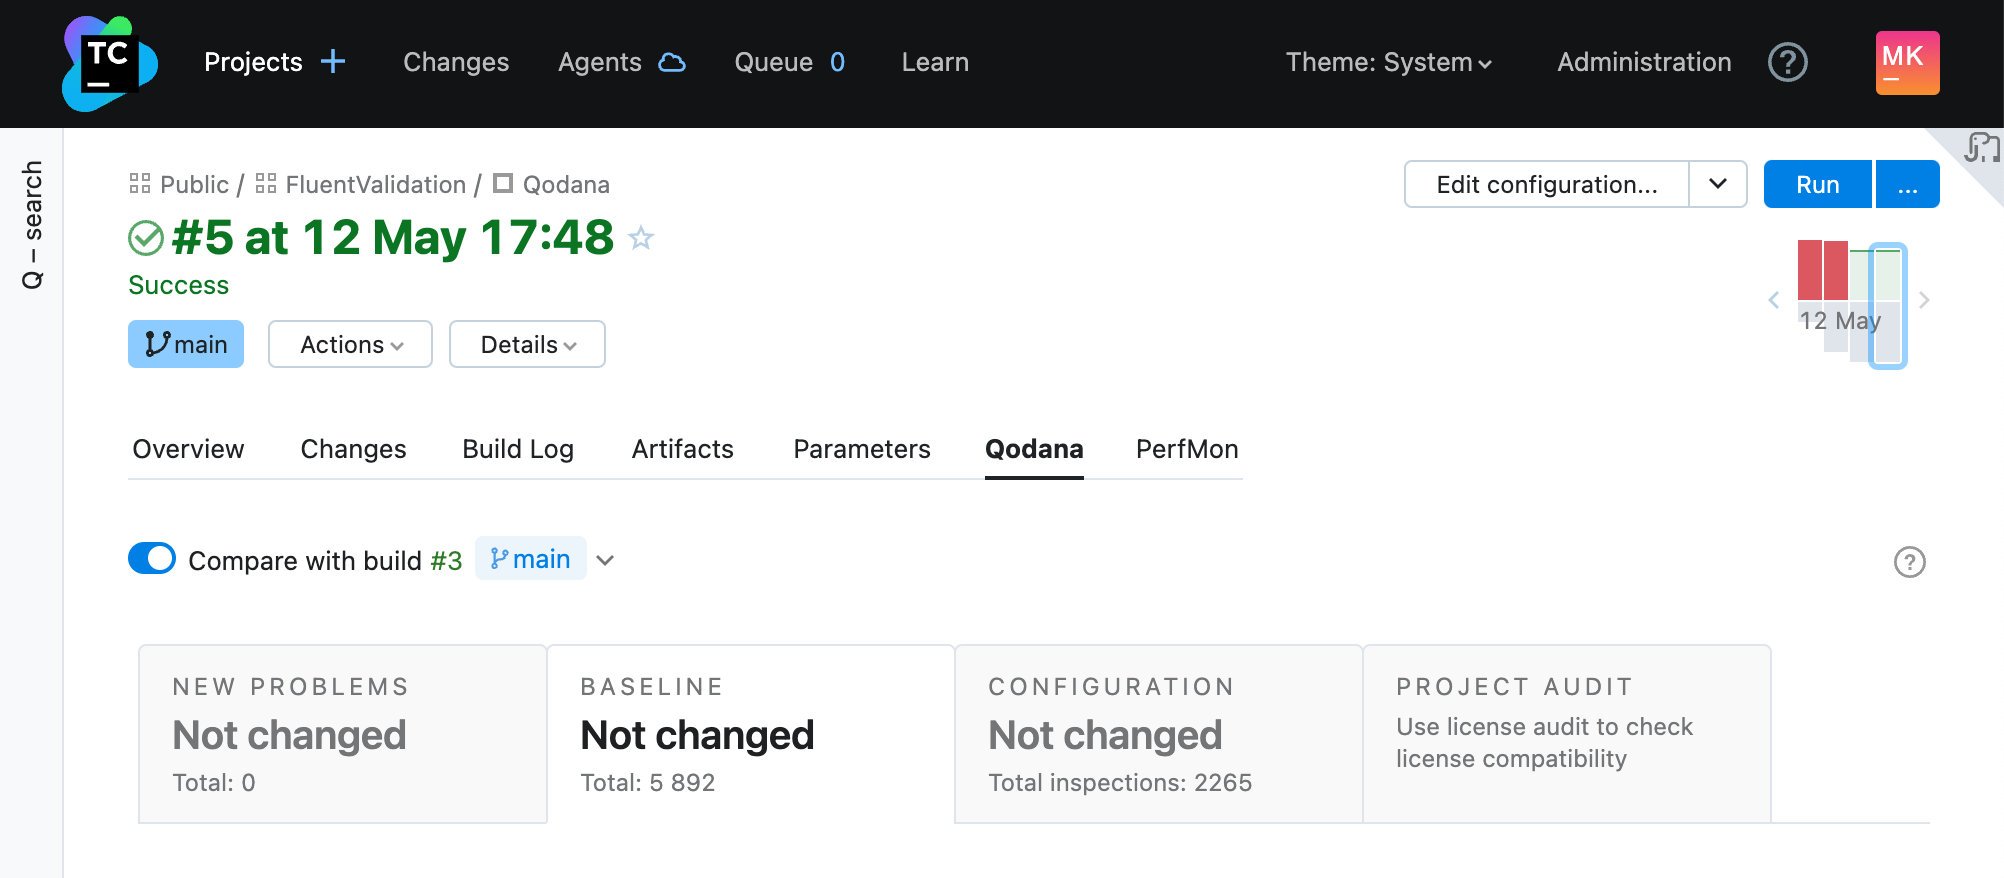
Pro-tip: you can add your own tabs to TeamCity!
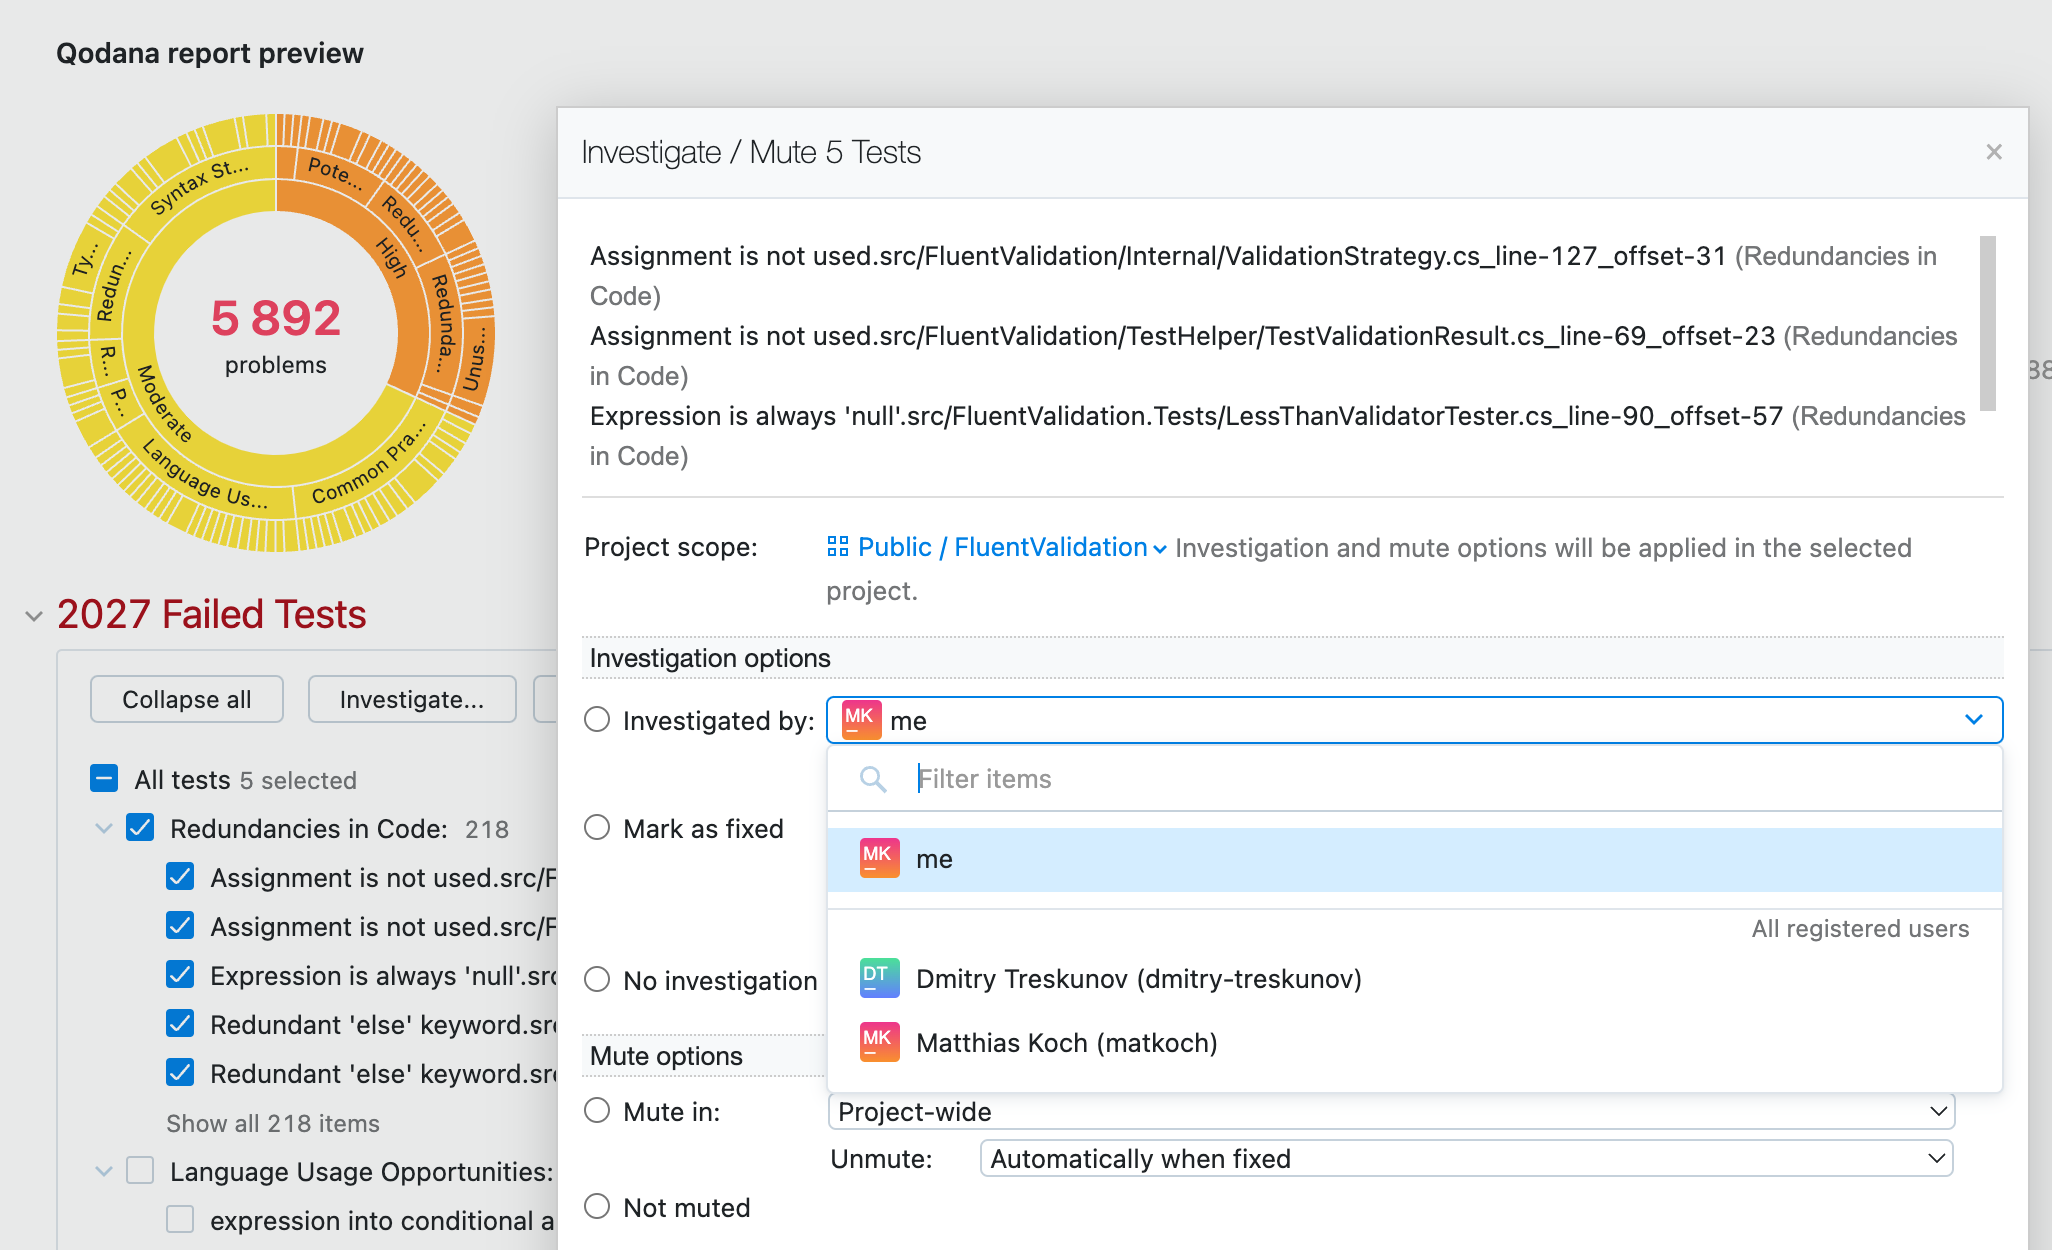
Another neat feature is that you can treat code issues as failed tests. This allows you to use the existing Investigating and Muting Build Failures for a more effective team workflow:
Qodana Reports in Rider
Of course, Qodana is fully integrated with Rider and other IntelliJ IDEA derivatives. A dedicated Qodana tab in the Problems tool window allows you to walk through all discovered issues, preview them in a separate pane, and hopefully fix them (or alternatively suppress them or change their severity):
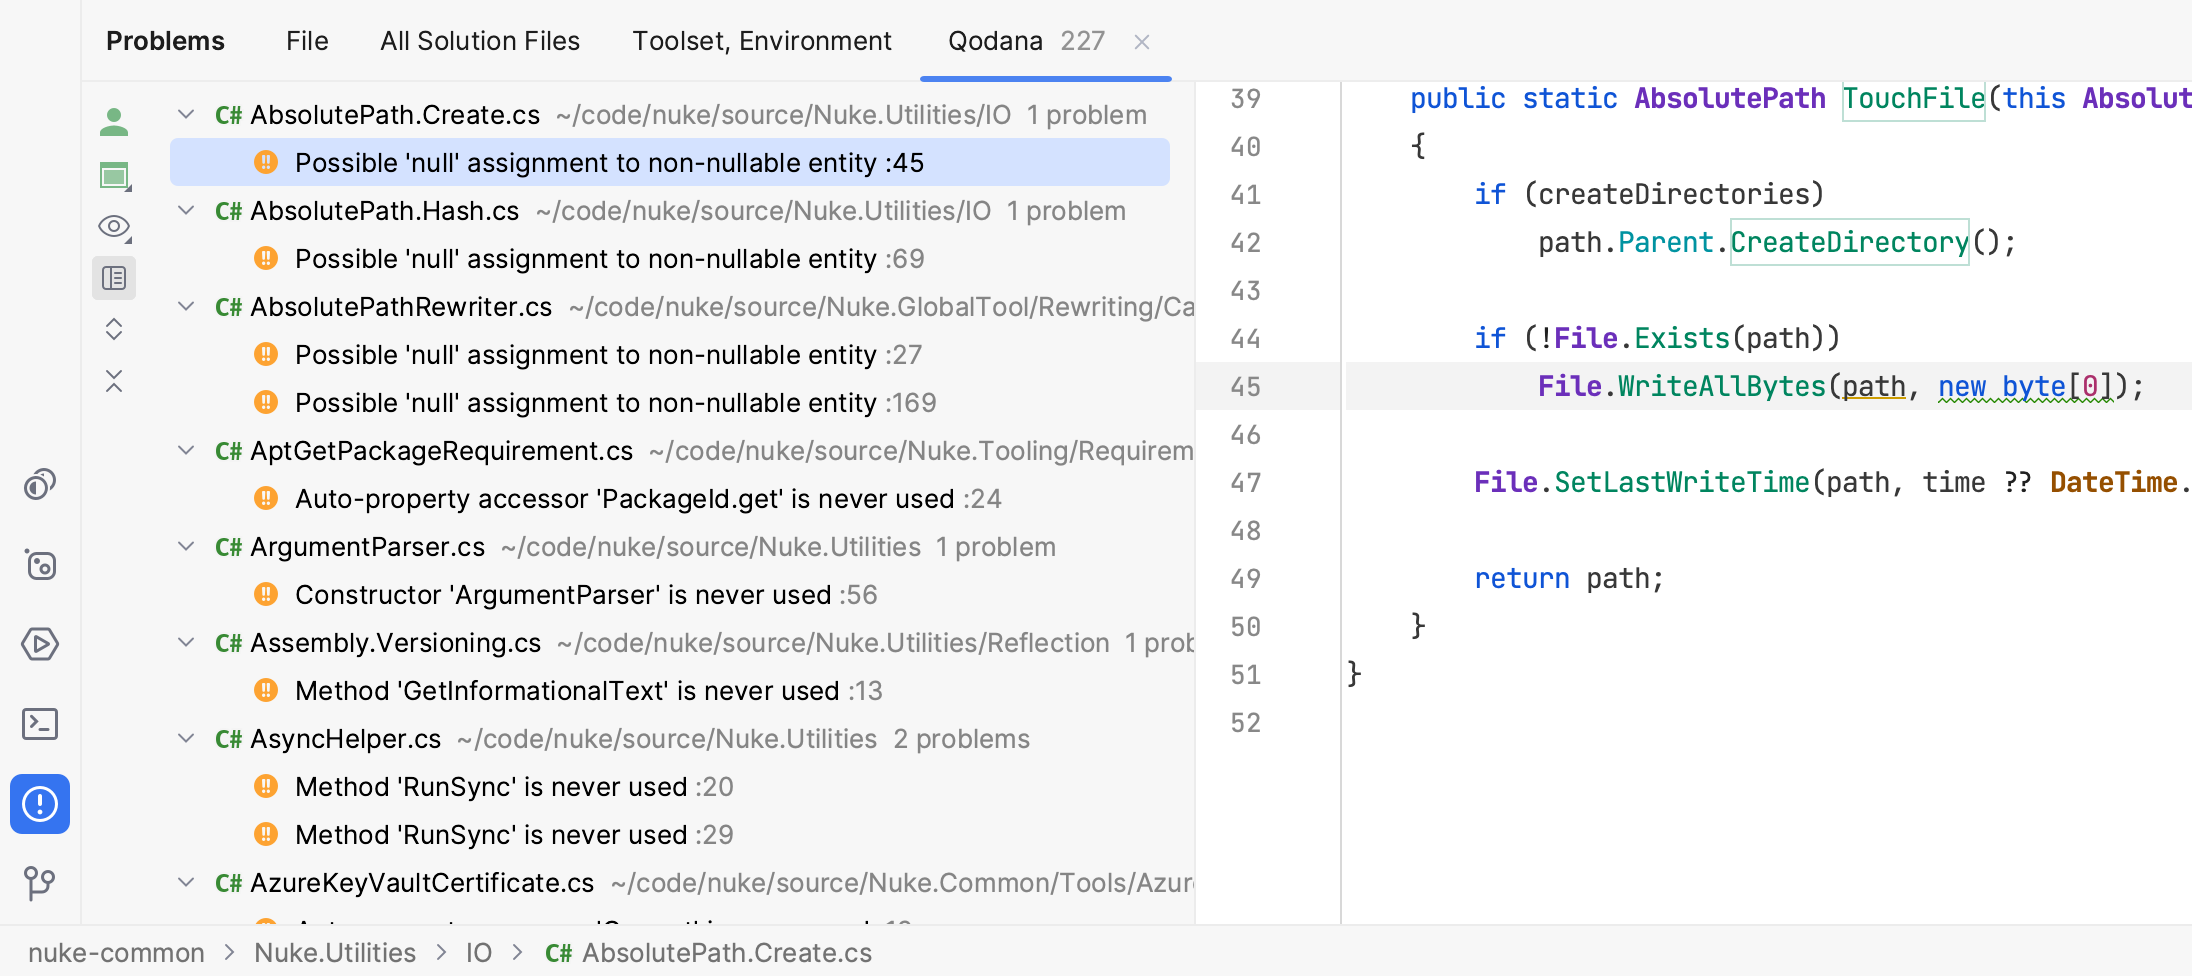
We are planning to add more filtering and grouping capabilities to the tool window, including by target frameworks.
Depending on your preferences, Qodana reports can be automatically pulled from Qodana Cloud, or manually loaded from a report file.
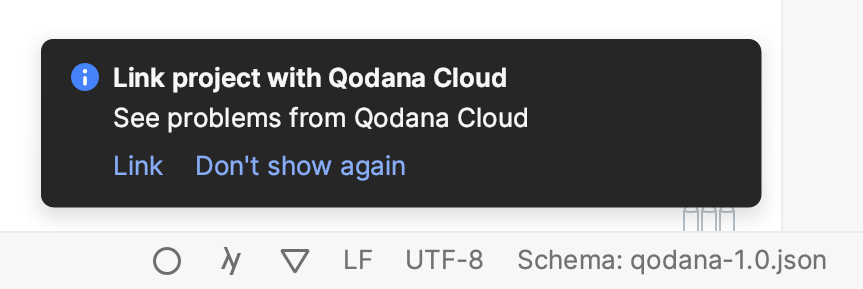
If you’re using Qodana Cloud, you can log in right from the settings dialog. Once you’re logged in, Rider allows you to link your current project with a project from Qodana Cloud:
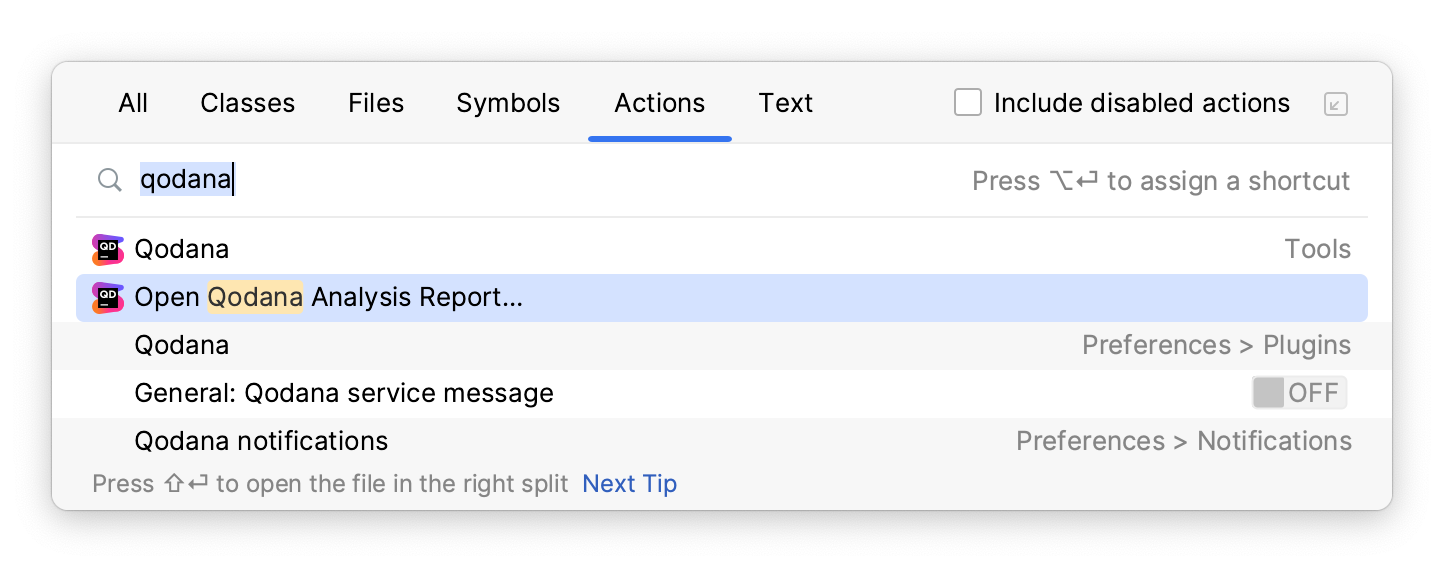
If you don’t have a Qodana Cloud account or prefer to load reports manually, you can use the Open Qodana Analysis Report… action:
Future Work
Qodana is growing quickly and recently made its first steps into the .NET ecosystem. The synergy effect is very strong considering that the whole analysis is done from a component that existed for years already (i.e., InspectCode). Not surprisingly, the Qodana team has even more integration plans!
Keep calm and Alt-Enter! What if your CI could automatically apply quick-fixes for code issues and style violations for you? While this objective will surely take some more time, developers will definitely appreciate spending less time on boilerplate keystrokes and putting more focus on the business value of their projects.
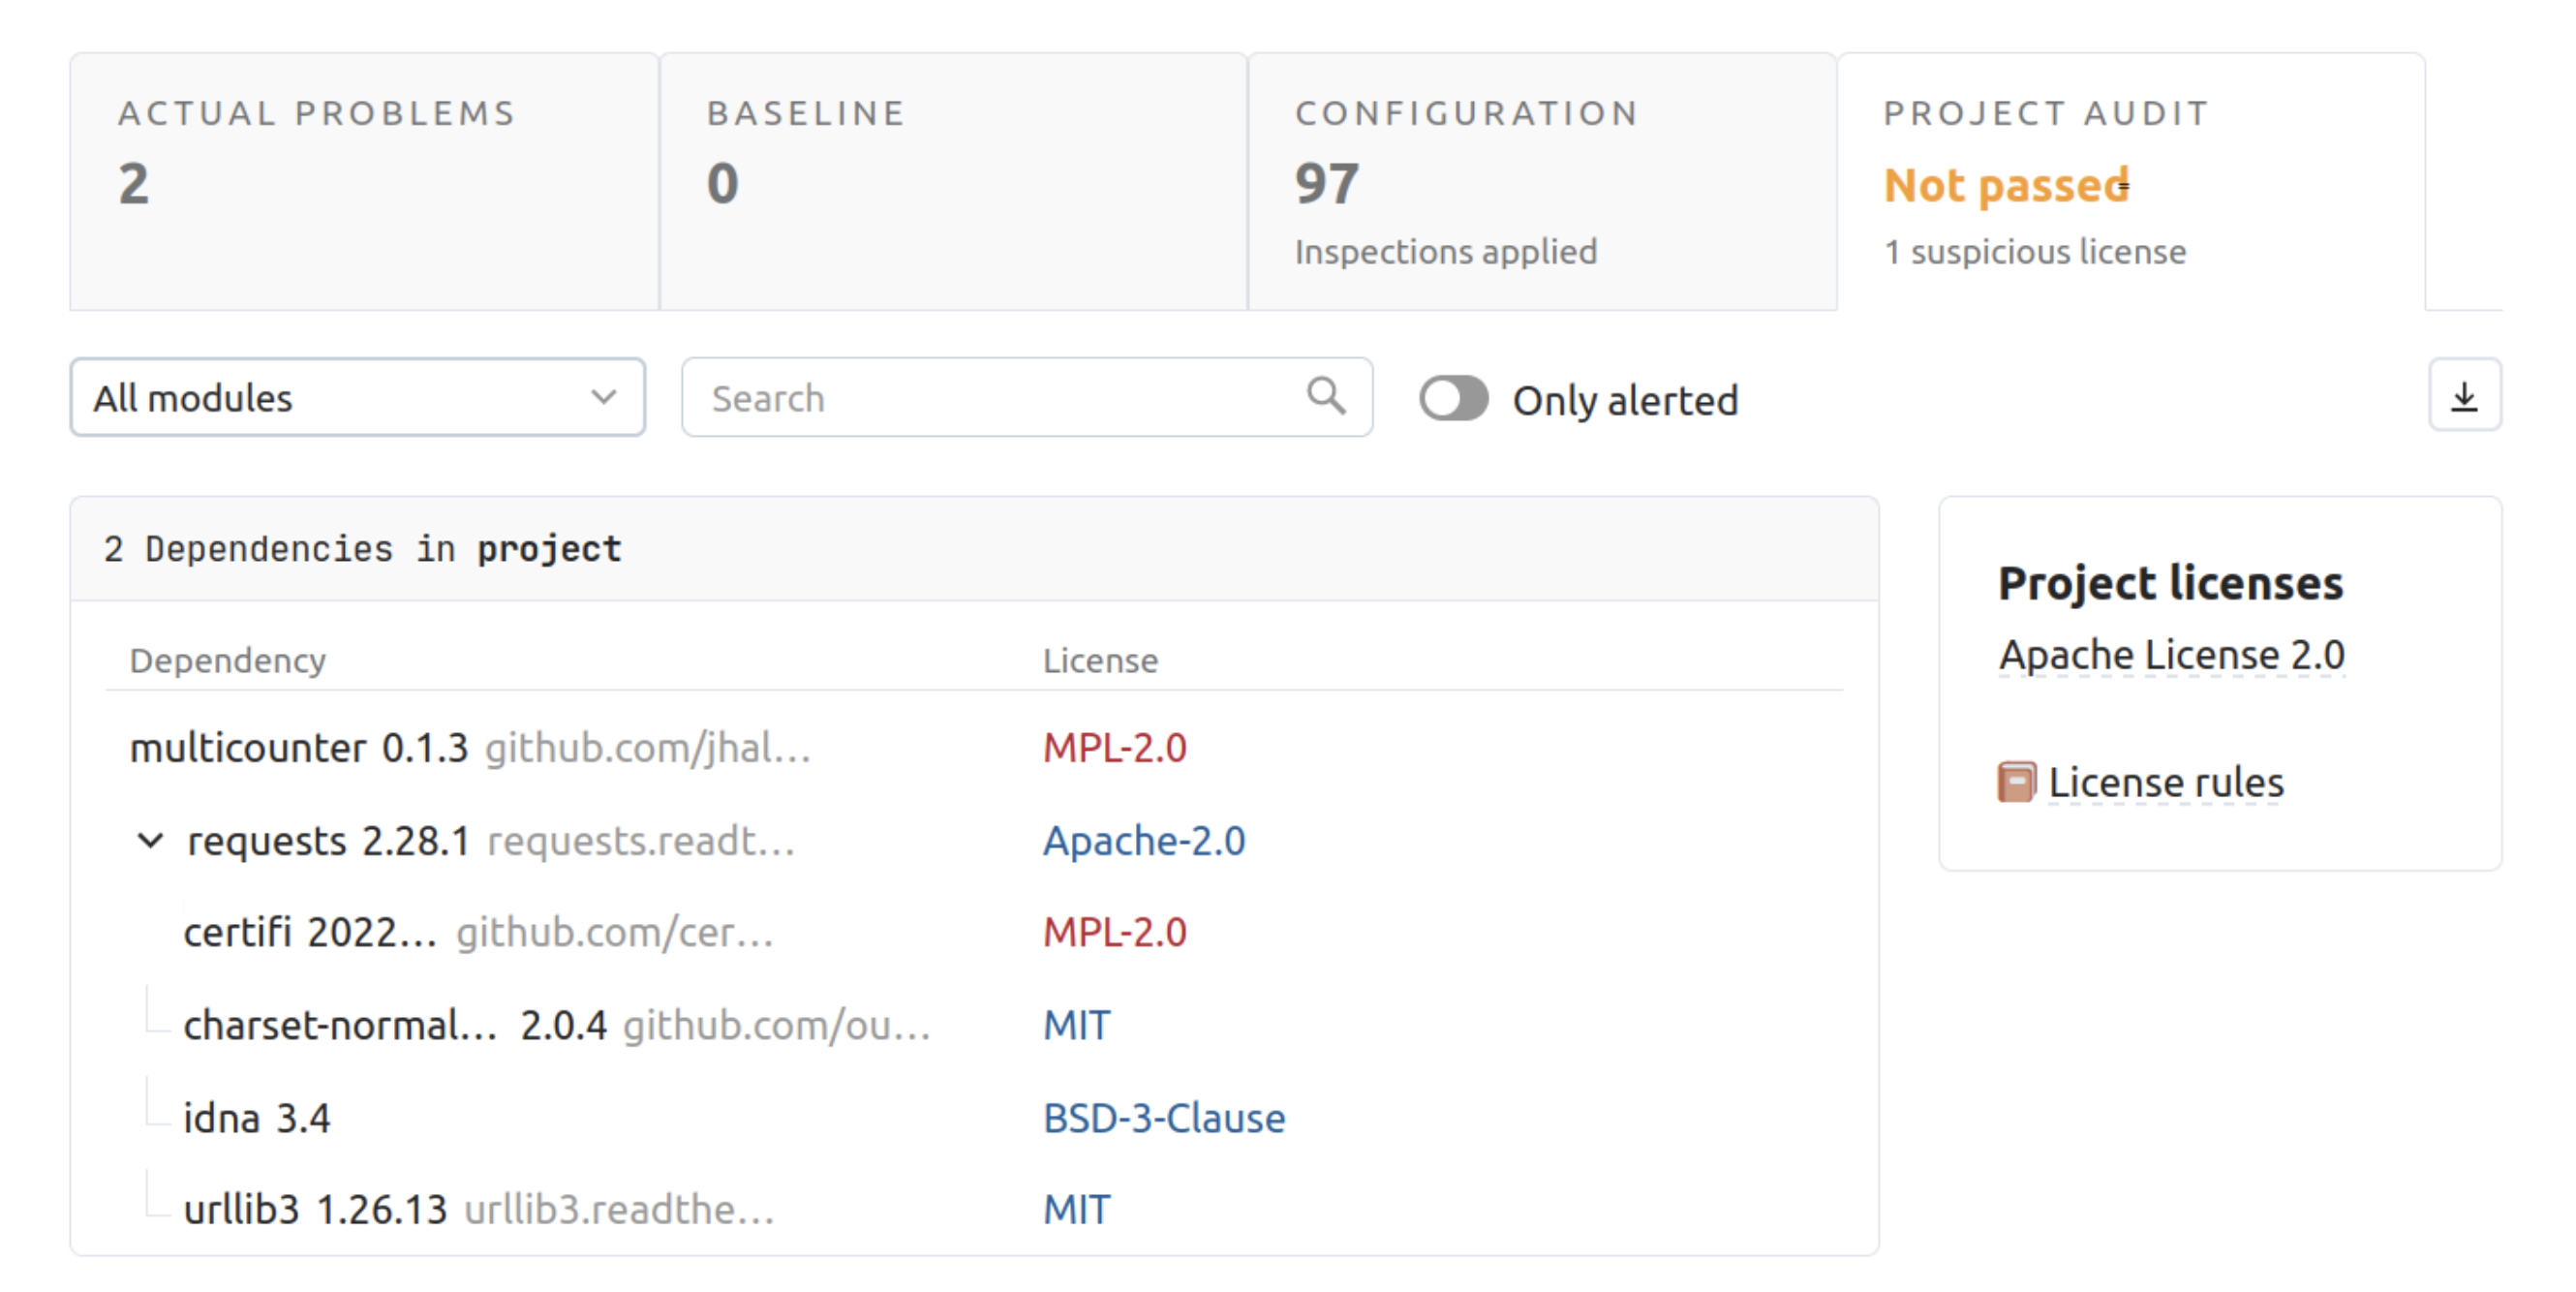
A feature that is more actively being worked on is the license audit. This scan helps you to verify that your project license is compliant with the licenses of your dependencies (e.g., NuGet packages) and all their transitive dependencies.
Conclusion
Qodana is an excellent way to improve code quality collaboratively in a codebase. It integrates seamlessly into all JetBrains IDEs and in your CI/CD environment of choice.
Install Qodana CLI and give it a try in one of your solutions, or sign up for Qodana Cloud to continuously track your code quality progress with ease.
Thank you for reading, and if you have any comments or questions, please feel free to leave them in the comment section.
Image credit: Jesse Gardner