.NET Tools
Essential productivity kit for .NET and game developers
Rider 2024.2 EAP 5: Reader Mode, Monitoring for Game Dev, and More

Rider 2024.2 EAP 5 has just landed! This build brings a variety of new features and improvements to enhance your development experience. As always, your feedback is invaluable in helping us refine these updates, so we encourage you to try out the new build and share your thoughts.
UX/UI
Reader mode
Reader mode is now available in Rider 2024.2 EAP 5. It’s designed to make reading library and read-only files, including decompiled ones, a whole lot easier, and it includes inline rendering of documentation comments for C# and F#, as well as virtual indenting for C#.
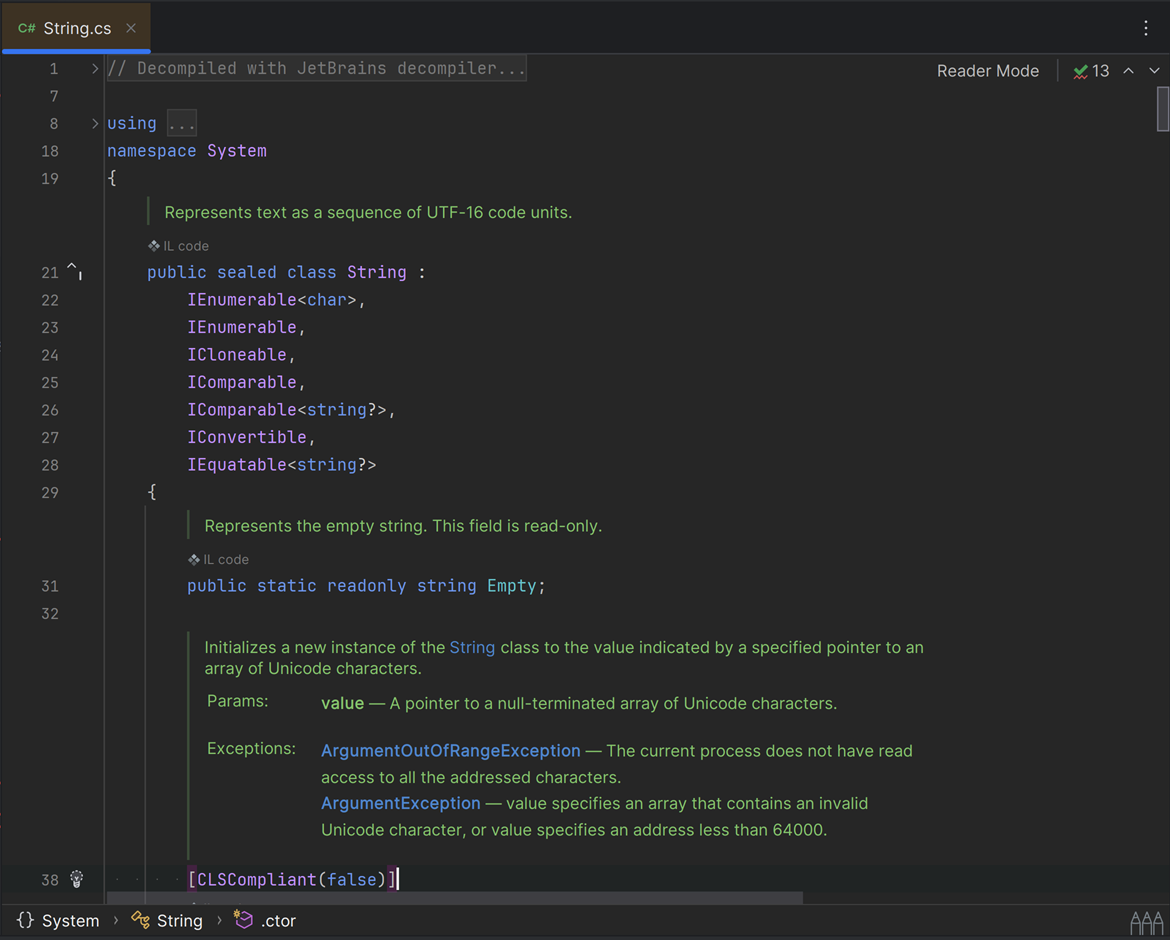
Virtual indenting modifies the style of read-only code to match your preferred layout.
Extract common code refactoring for C#
Rider’s latest refactoring enhancement enables you to extract common code out of branching statements such as if or switch. This update streamlines and consolidates shared logic, ensuring it’s executed regardless of the branching path, improving code readability, and reducing redundancy.
Sticky lines for C++
In addition to the sticky lines for preprocessor directives introduced in EAP 3, Rider 2024.2 now offers sticky lines for accessibility specifiers in C++.
Accessibility specifiers (public, protected, and private) define the access control for class members. The new sticky lines feature keeps these specifiers visible at the top of the editor window as you scroll, helping you quickly identify access levels and better manage complex class hierarchies by maintaining constant visibility of the encapsulation and inheritance structure.
Enhanced Monitoring tool window
The Monitoring tool window inside Rider 2024.2 supports a broader range of application types. This tool window is now displayed during running and debugging for the following project types:
- C++ projects
- Unity projects
- Unreal Engine projects
- Mono projects
- .NET Framework projects (without heap information)
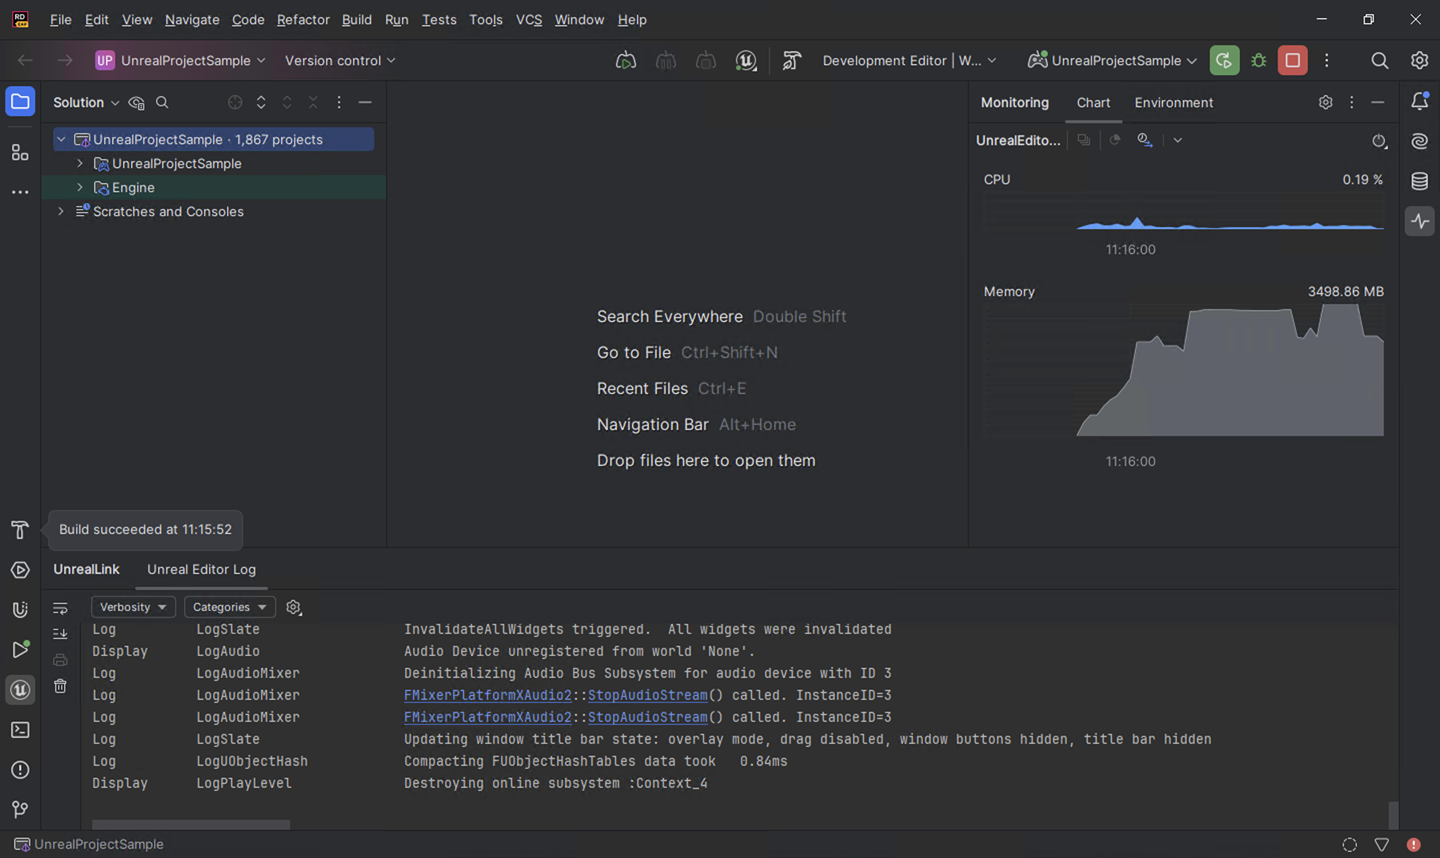
For newly supported project types, the Monitoring functionality is currently limited to the Chart and Environment tabs. The Chart tab in these cases only includes data on CPU usage and private memory consumption.
The Counters tab, as well as detailed information on heap sizes, GC time, and exception counts in the Charts tab, are still only supported .NET Core 3.0+ and .NET 5+ applications.
Please note some known cases where this feature might not work:
- when cmd.exe is monitored instead of the user’s application if the Use external console option is enabled in configuration settings on Windows
- when attaching to mono processes
Performance and memory profiling
dotTrace
- We’ve resolved the issue with missing kernel sampling events in Timeline mode (DTRC-30949).
dotMemory
The built-in dotMemory plugin has gained the ability to automatically analyze snapshots and compare snapshots contained in different dotMemory workspaces. This entails the introduction of a couple of additional views:
- Automatic memory inspections: dotMemory gets the Inspections view, which shows a number of automatically detected memory issues.
- Cross-workspace snapshot comparison: Now, you can compare snapshots from different profiling sessions, allowing for a more comprehensive memory analysis.
These features are available in the standalone version of dotMemory.
Explain with AI for Dynamic Program Analysis
The Dynamic Program Analysis (DPA) tool window now features an Explain with AI button for issues related to memory allocation and database problems. This AI-driven feature offers detailed explanations and advice from AI Assistant on potential fixes directly within the Dynamic Program Analysis tool window to help you quickly understand and resolve even the most complex issues associated with memory allocation and working with databases.
Game development
[Godot] Debugging for GDScript
Rider 2024.2 EAP 5 introduces support for debugging GDScript in Godot. This update makes it easier for Godot developers to debug their scripts directly within Rider, streamlining the development process and providing a more integrated experience.
For the full list of changes included in this build, please refer to our issue tracker.
We encourage you to download the latest build, explore these new features, and share your feedback with us. Your insights are crucial in helping us refine these updates and deliver the best possible experience for all our users.