.NET Tools
Essential productivity kit for .NET and game developers
Coming to Rider 2025.3: ASP.NET and Database Issue Detection In The Monitoring Tool Window

In Rider 2025.3, the Monitoring tool window has become even more powerful with the addition of database and ASP.NET issue detection. These new capabilities let you track slow queries, inefficient request handling, and other performance bottlenecks in real time – right alongside CPU, memory, and GC activity.
You can explore these new additions in the Rider 2025.3 EAP 6 build – let’s take a closer look at what you can expect.
A single home for performance insights
The Monitoring tool window now serves as a central hub for tracking your application’s runtime behavior – CPU usage, memory allocation, garbage collection, environment variables, and performance issues are all tracked within a single interface.
With the inclusion of Database and ASP.NET issue detection, the tool automatically highlights slow queries, excessive database connections, or long-running MVC actions and Razor handlers. These now appear alongside other runtime insights such as UI freezes, GC pressure, and performance hotspots.
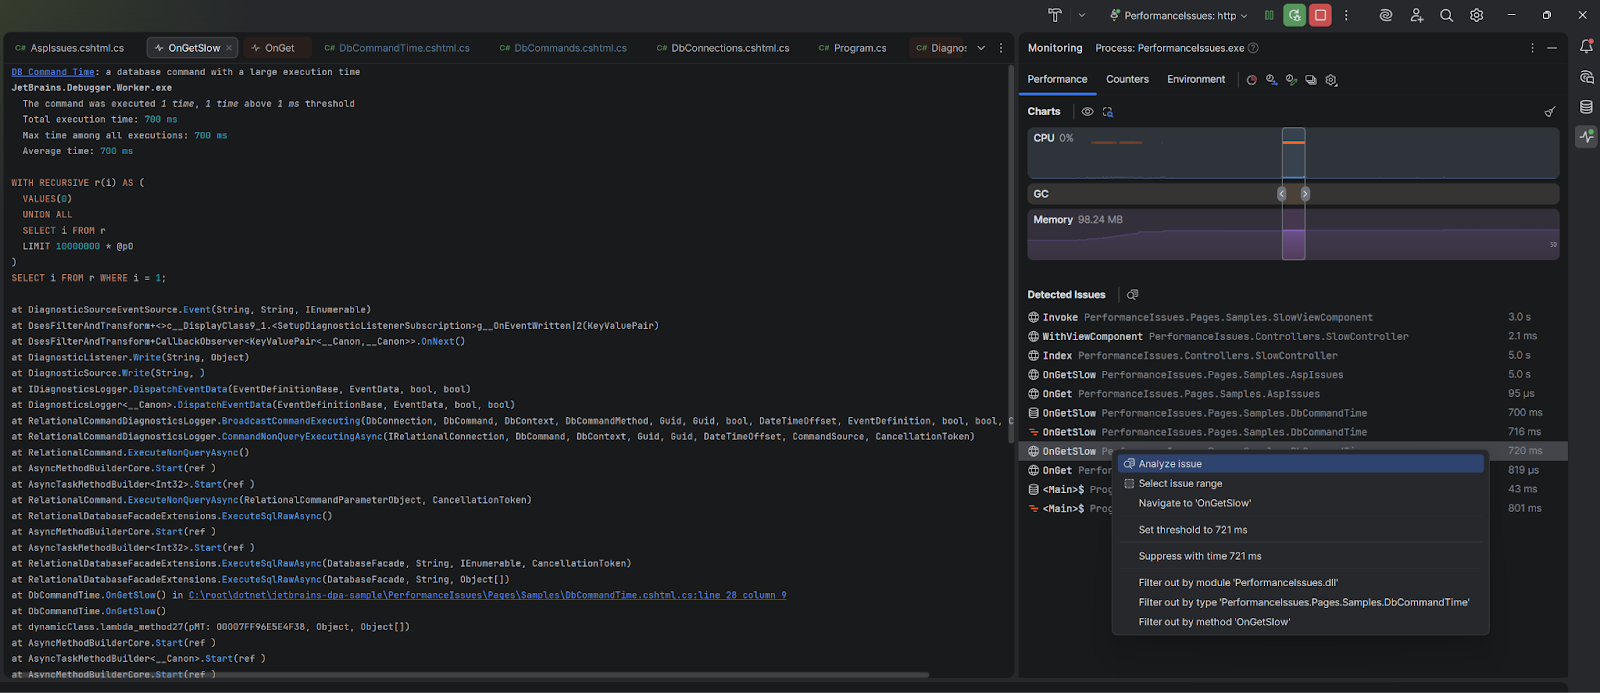
Detected issues appear directly beneath the live performance charts. Here’s a list of the types of issues the Monitoring tool is able to automatically detect for your project:
Database operation issues
- Slow DB command – Database commands that take longer than the defined threshold.
- Excessive DB commands – Repeated execution of the same command.
- Large DB result set – Queries returning more records than the configured threshold.
- Excessive DB connections – Code that opens too many simultaneous database connections.
ASP.NET Core application issues
- Slow MVC action – Controller actions that exceed the configured execution time threshold.
- Slow Razor page handler – Long-running page handler methods such as
OnGetorOnPost. - Slow Razor view component – Slow
Invoke()orInvokeAsync()methods.
If you have a dotUltimate or an All Products Pack subscription, these general issue types will be replaced with names of the specific methods responsible. A dotUltimate subscription will also let you investigate each entry further using the bundled dotTrace profiler, allowing you to explore call stacks, query details, and execution times with just a couple clicks.
There’s no need to wait until your session ends to see what’s going on. ASP.NET and database issues now appear and update in real time, so you can spot and understand performance bottlenecks as they happen.
You can configure thresholds and manage the inspections by going to Settings/Preferences | Build, Execution, Deployment | Monitoring | Inspections.
Compatibility and availability
ASP.NET and database issue detection is available on Windows, Linux, and macOS. You can find additional information on supported OSs and application types in our documentation.
If you have a dotUltimate subscription, you can take your investigation even further with the bundled dotTrace profiler, which lets you jump straight to the problematic line in your source code.
___________________________________________________________________________
With everything unified in the Monitoring tool window, you no longer need to juggle multiple tools or wonder where to look when performance issues arise. Database bottlenecks, ASP.NET inefficiencies, and runtime anomalies are now captured and visualized in one place, giving you the full picture of your application’s health at a glance.
Ready to try it out? Download Rider 2025.3 EAP 6, start running or debugging your application, and the Monitoring tool window will open automatically.
You’ll be able to troubleshoot performance issues more quickly and intuitively than ever. As always, we’d love to hear your feedback. Let us know what you think in the comments below!