.NET Tools
Essential productivity kit for .NET and game developers
Rider 2026.1 Early Access Program Is Now Open!

The Early Access Program (EAP) for Rider 2026.1 has just begun, and the first preview build for the upcoming major release is already out.
There are several ways for you to get your hands on the first preview build:
- Download and install it from our website.
- Get it via the Toolbox App.
- Install this snap package from the SnapCraft store if you’re using a compatible Linux distribution.
A reminder of what the EAP is all about
The Early Access Program is a long-standing tradition that gives our users early access to the new features we’re preparing. By participating, you get a first look at what’s coming and a chance to help shape the final release through your feedback.
EAP builds are free to use, though they may be less stable than the final release versions. You can learn more about the EAP and why you might want to participate here.
And now on to Rider 2026.1 EAP 1 release highlights.
C# language support
For the latest updates to C# support, please check out the ReSharper 2026.1 EAP 1 blog post for ReSharper.
Azure DevOps integration: Cloning repositories from Rider
If your team uses Azure DevOps, you can now clone repositories directly from Rider using the new bundled Azure DevOps plugin for JetBrains Rider.
To get started, go to File | Open | Get from Version Control from the main menu. From the Clone Repository dialog, select Azure DevOps from the list of version control providers. Rider authenticates using a personal access token (PAT), which you generate in Azure DevOps and then use to sign in from within the IDE. Once authenticated, Rider shows a list of repositories available to you, so you can select and clone them without leaving the IDE.
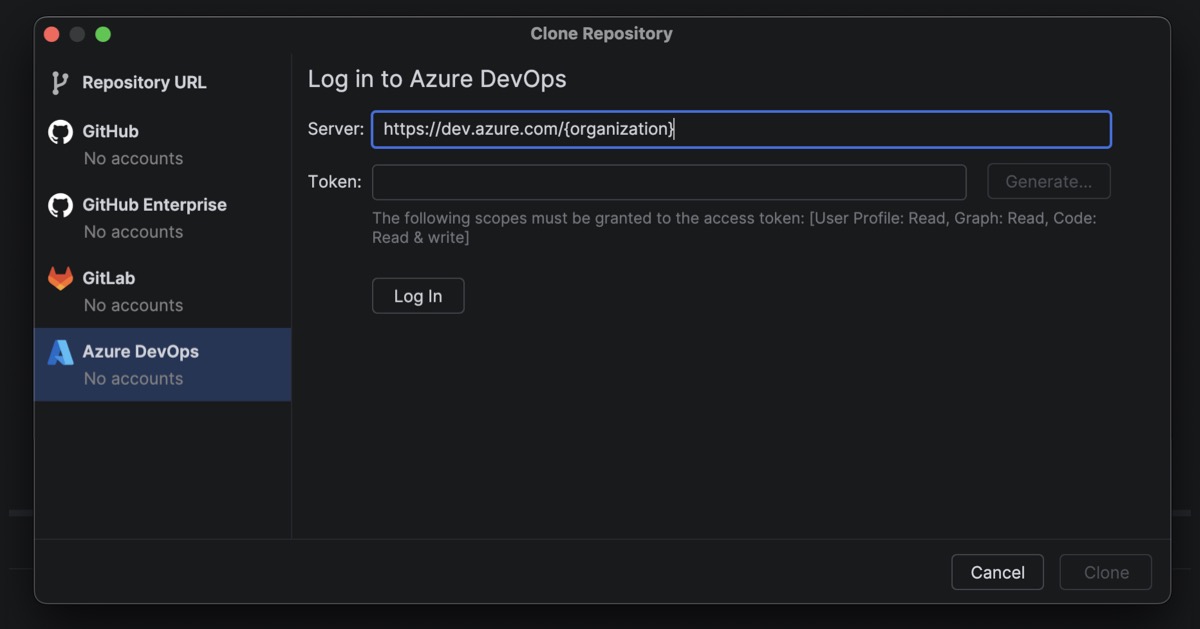
At this stage, the plugin focuses on the most common and reliable workflow: repository cloning via PAT-based authentication. This approach matches how authentication works for other organization-based Git providers in Rider and avoids frequent reauthentication or token refresh issues.
This is just the beginning of Azure DevOps support in Rider. We plan to expand the integration over time with additional baseline workflows. If you’re looking for more advanced Azure DevOps functionality today, the community-driven azd plugin is a great complement to the functionality already available in Rider.
NuGet PowerShell commands support in the Package Manager Console
Rider now offers a Package Manager Console (PMC) in preview, bringing NuGet’s PowerShell-based workflow into the IDE.
The new console supports standard NuGet PowerShell commands, as well as commands provided by NuGet packages themselves. Entity Framework Core PowerShell commands such as Add-Migration, Update-Database, and Scaffold-DbContext are fully supported, enabling familiar EF Core workflows without leaving Rider. Broader command coverage will continue to expand based on user feedback.
You can access the PMC in two places:
- As a dedicated tab in the NuGet tool window
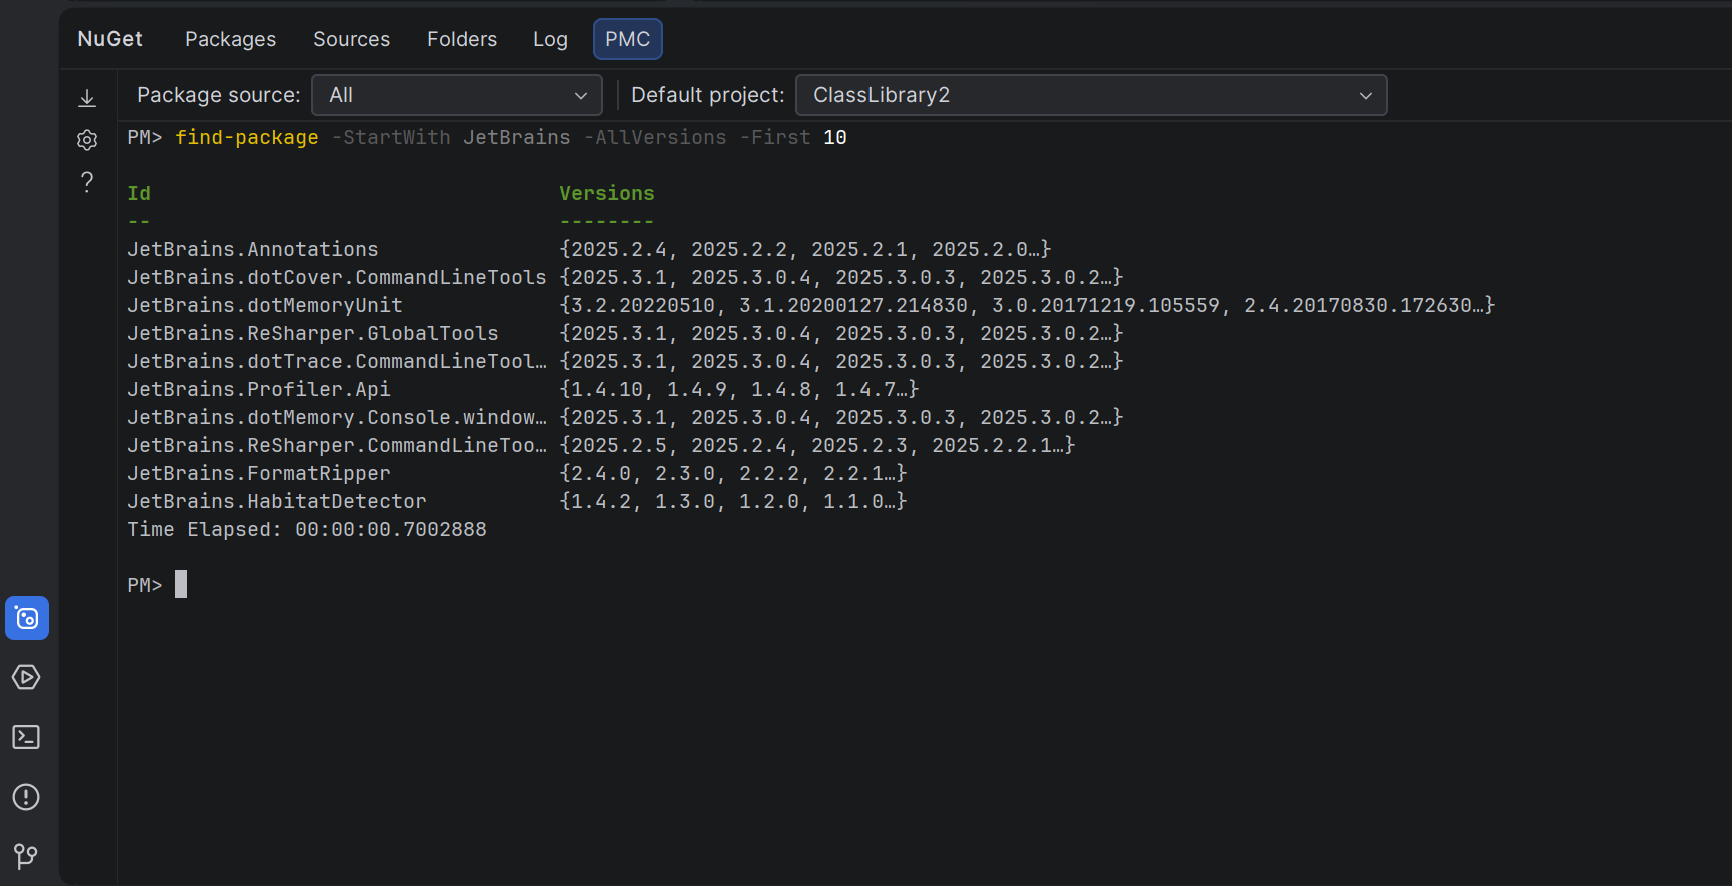
- As a predefined session in the Terminal tool window
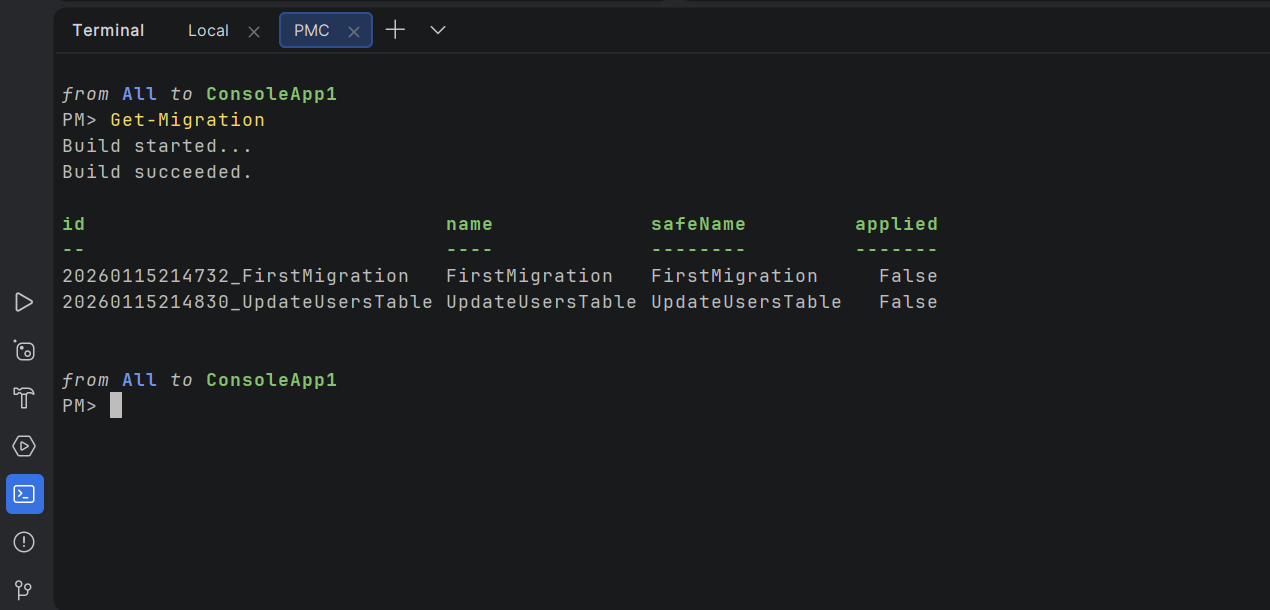
Both options let you run the same commands, but differ slightly in how context is handled. In the NuGet tool window, you can select the package source and default project using UI controls. In the terminal-based console, this context is shown as part of the PowerShell prompt and can be changed using PowerShell commands.
This preview is about finding the right balance between flexibility and convenience for our users. Your feedback will help us decide which experience to refine and carry forward into the final release. Please share your feedback in the comments under this ticket or in the comment section below this post.
.NET mixed-mode debugging on Windows
Rider 2026.1 introduces mixed-mode debugging, which lets you debug both managed (.NET and .NET Framework) and native (C/C++) code in a single debugging session.
This is particularly useful for applications that cross managed-native boundaries, such as .NET code calling into native libraries or game engines and tools built from a mix of managed and native components.
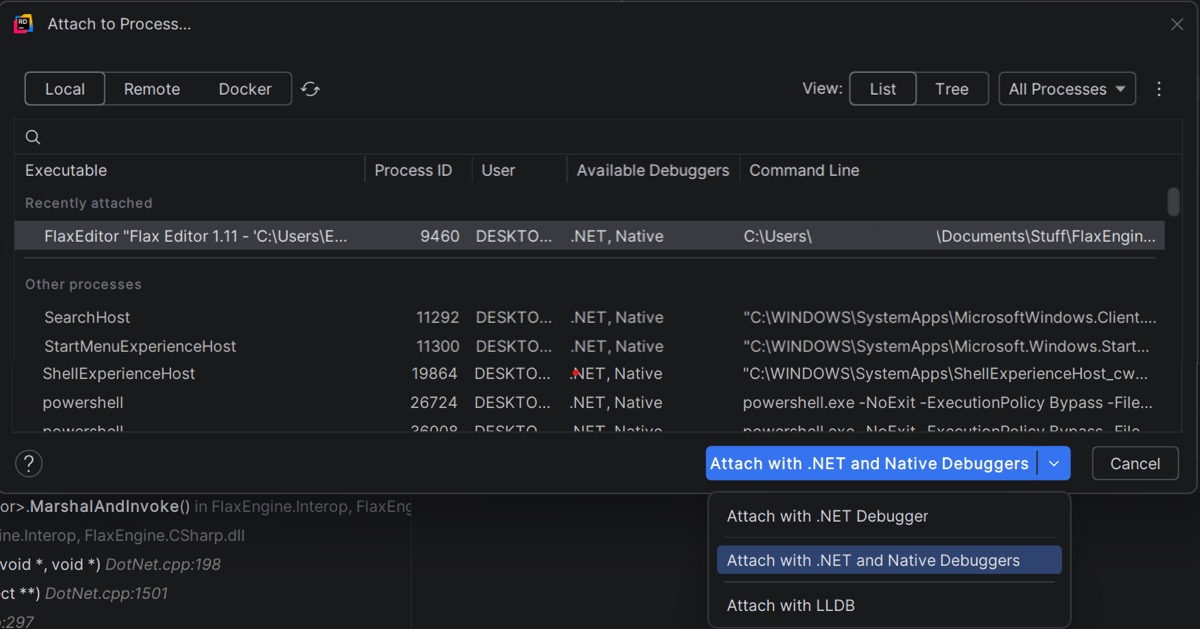
You can start a mixed-mode debugging session in two ways:
- Open your run configuration and enable the Use mixed mode debug checkbox. When you start debugging, Rider will attach both the .NET and native debuggers automatically.
- Open Run | Attach to Process, select a running process, and choose Attach with .NET and Native Debuggers. This attaches both debuggers to the same process, allowing you to step across managed and native code without having to restart the application.
Please note that .NET mixed-mode debugging is currently available only on Windows. Please leave your feedback on this ticket.
The ability to inspect .NET assembly output
Rider now offers a .NET Disassembler via a custom plugin that lets you inspect the native disassembly generated for your C# code directly in the IDE.
You can view the native disassembly generated from your C# code, along with output from the JIT, ReadyToRun, and NativeAOT compilers in the ASM Viewer tool window, which is available through the new plugin. This makes the feature particularly useful when working on performance-sensitive code, low-level optimizations, SIMD-heavy paths, or when validating how code changes affect the final machine instructions.
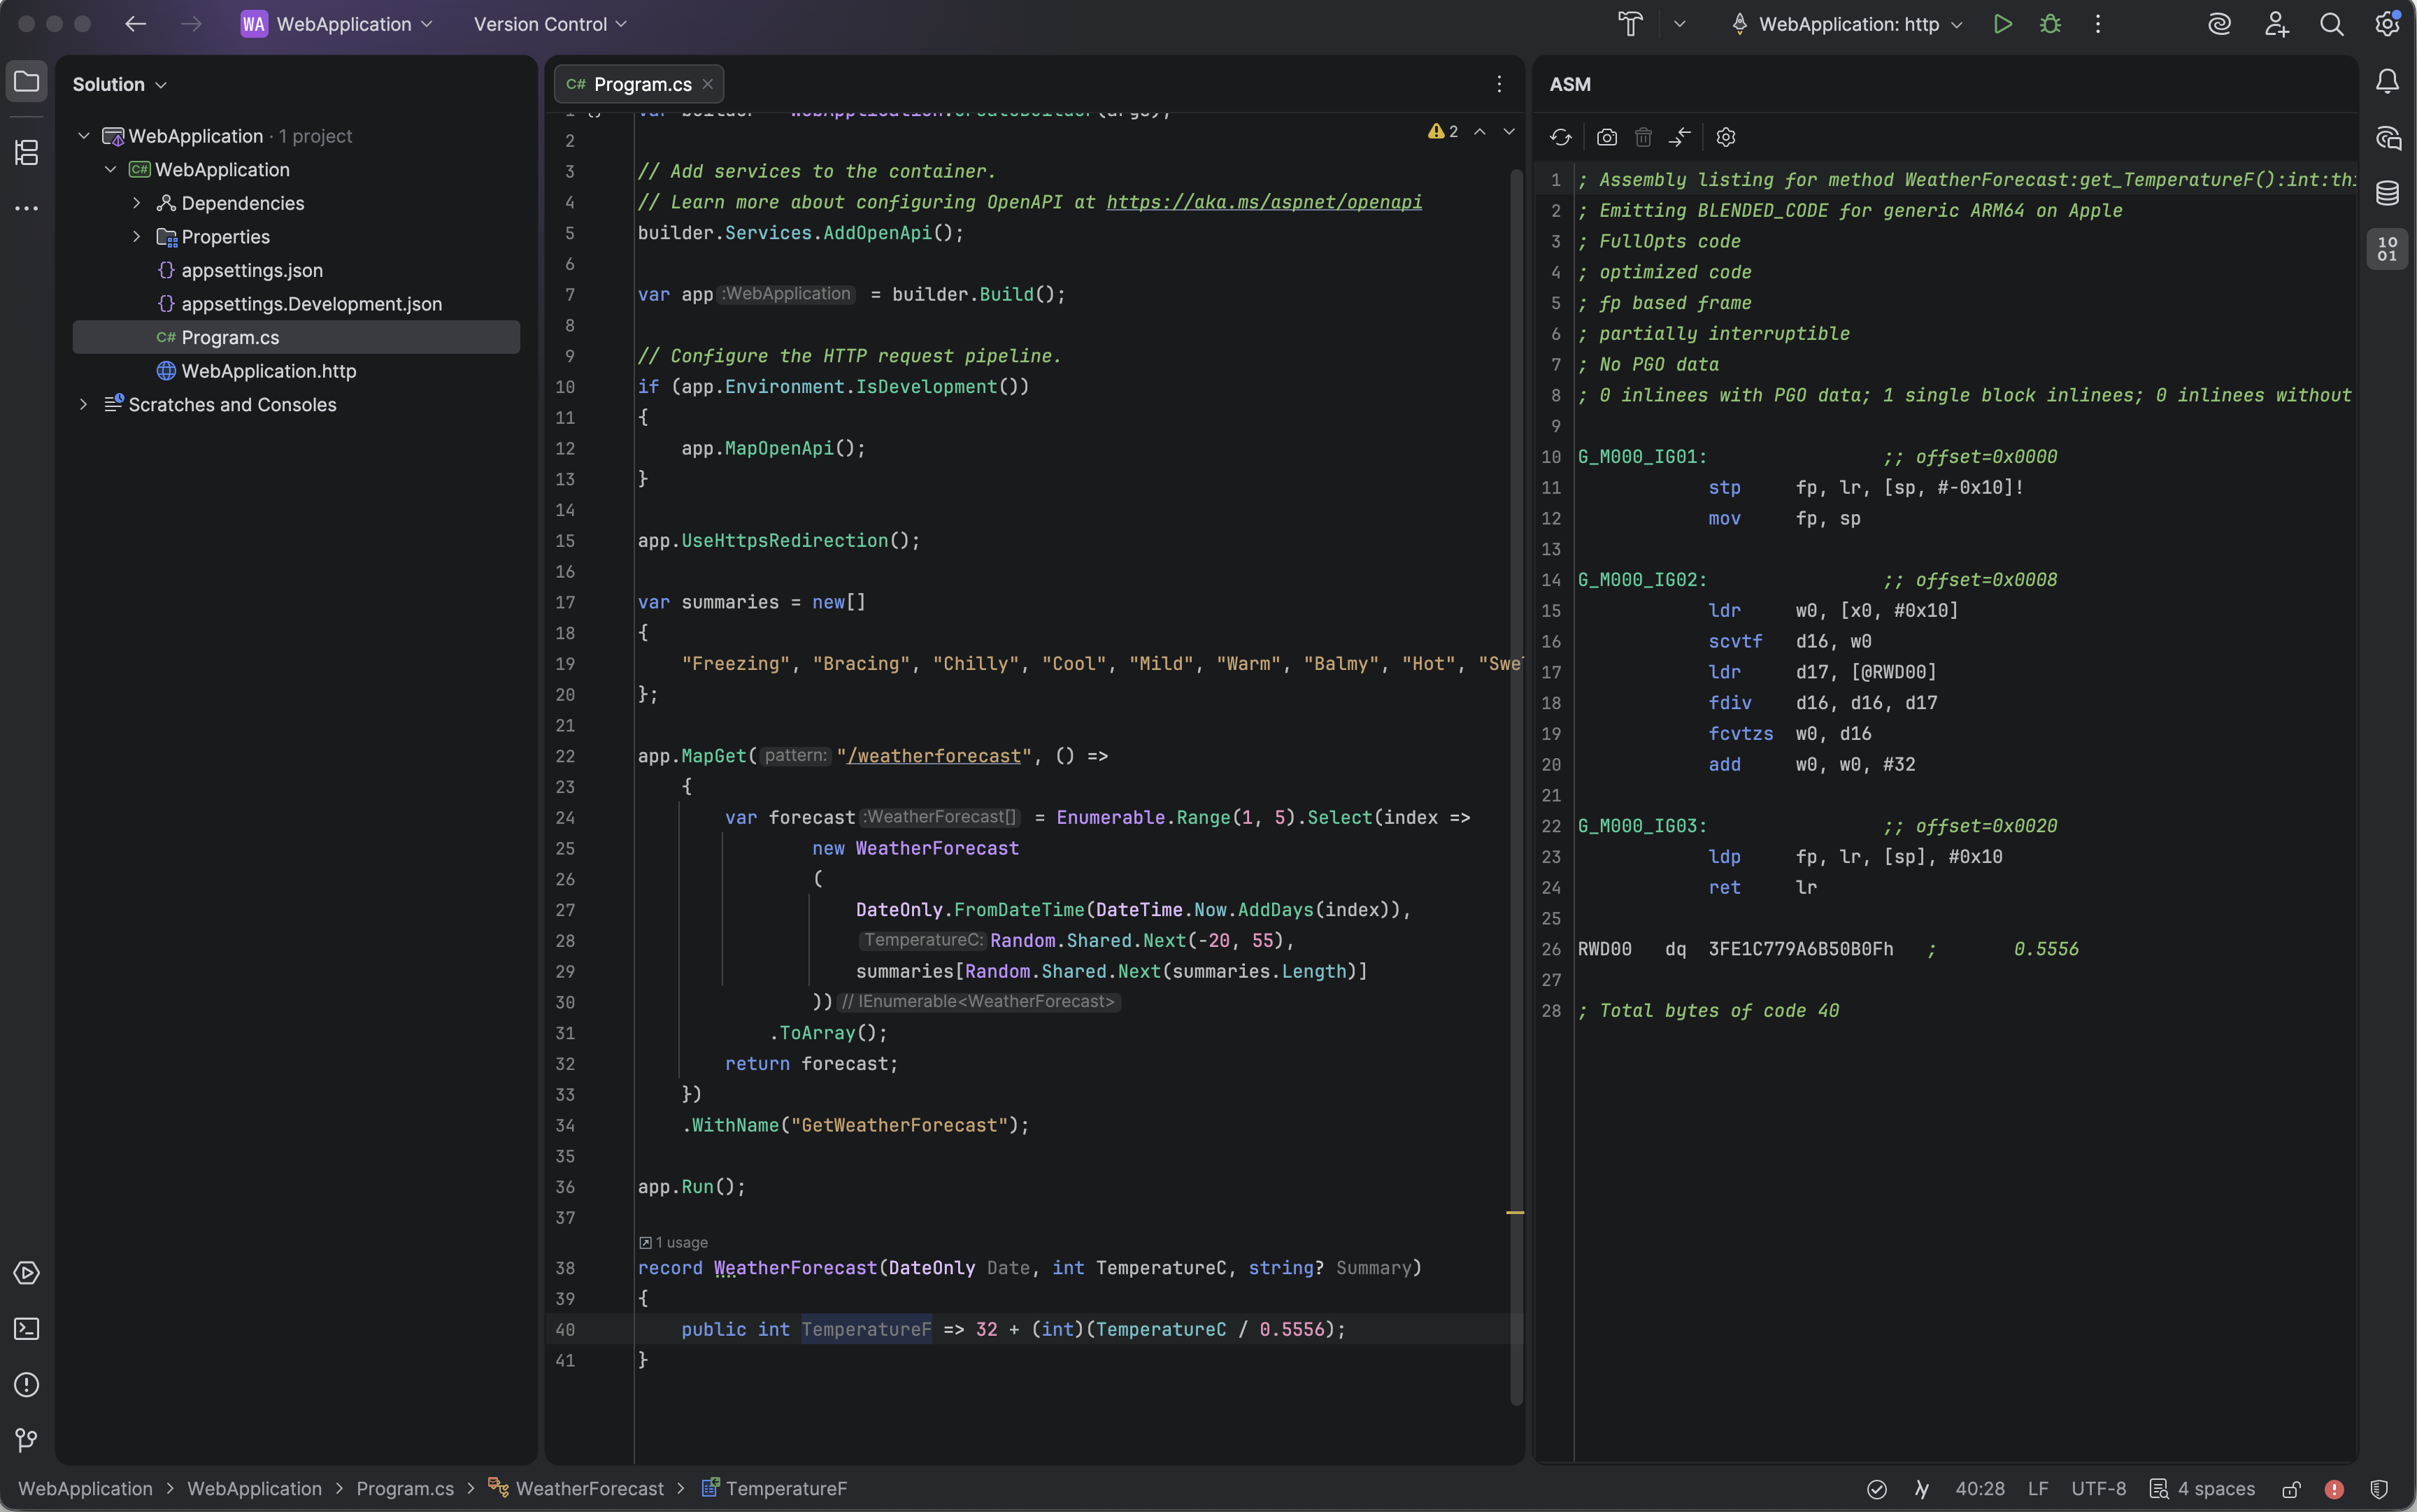
The .NET Disassembler is designed for use during development. You can open it directly from your C# code and inspect the generated assembly side by side with the source. Rider also supports:
- Configurable compiler options such as tiered compilation and PGO.
- Snapshots and diff views to compare assembly output before and after code changes.
- Syntax highlighting for x86/x64 and ARM64 assembly.
The introduction of this plugin is our answer to long-standing requests from developers who need visibility beyond IL and want to understand what actually runs on the CPU, without repeatedly rebuilding projects or switching to external tools.
Enhanced integration with the Godot Editor
This release introduces a Godot Editor addon that enhances the way Rider works with Godot Engine projects.
When you enable the JetBrains Rider External Editor addon in the Godot Editor, it automatically detects your installed Rider versions and configures Godot to work with Rider as the external IDE. It also applies a set of recommended editor settings to optimize your workflow – helping with project opening, file navigation, and debugging.
Combined with Rider’s Godot Support plugin (now bundled with the IDE), this enables:
- Automatic Godot project discovery in Rider.
- Generation of run/debug configurations for Godot scenes.
- Code insight and navigation for both GDScript and C#.
- Integrated debugging with scene variables and node context.
Inspect the sources of the addon to see how GDExtension can be developed in JetBrains Rider at any OS.
Search for “JetBrains Rider Integration” on the AssetLib inside GodotEditor to get started.
Improved Natvis expression evaluation
C++ debugging in Rider now uses a new standalone parser and evaluator for Natvis expressions. Thanks to the new evaluator, variable inspection is up to 87 times faster on warm runs and 16 times faster on cold ones. The debugger memory usage has dropped to just over a third of what it was. And that’s not even all of the benefits! Click here to learn more.
C++ naming rules improvements
Rider now offers a more flexible C++ naming rules configuration. The updated settings page lets you edit naming rules [RIDER-121211], apply predefined naming styles [RIDER-132026], and define abbreviations [RIDER-52334], making it easier to align code style with your team’s conventions.
For the full list of changes included in this build, please see our issue tracker.
We encourage you to download the EAP build, give these new features a try, and share your feedback. The Early Access Program is a collaborative effort, and your input plays a vital role in making Rider the best it can be.
Thank you for being part of our EAP community, and we look forward to hearing what you think!