Profiling Go Code with GoLand

In GoLand 2026.1.2, we implemented a new profiler tool that makes it even easier for you to collect and inspect profiles. Read our “Practical Guide to Profiling in Go” for more information about profiling and tips on how to profile your program with GoLand.
This article was written by an external contributor.

Modern software stacks contain many moving pieces. With each piece potentially relying on a different set of dependencies, it can be difficult to identify bottlenecks in your application’s performance.
Profiling can provide insights into how the application is running and where improvements can be made. Profiling applications can help with performance by identifying issues with the code – such as bottlenecks in memory, CPU, I/O, and other components – which can be essential for optimization and a better user experience.
Additionally, profiling can help with debugging by providing information about where the program is spending the most time with the help of flame graphs and other tools. Once you have data from your profiles, a software engineer can use that information to implement code changes that will improve performance, detect memory leaks, and optimize the overall application.
In this post, you’ll learn how to use GoLand, and its built-in features such as CPU, memory, mutex, and blocking profilers. You’ll also learn how you can interpret the data from these profilers to improve the performance and runtime of a sample program.
Profiling a Go Function
The Go ecosystem provides a large suite of APIs and tools to profile a Go program with the help of CPU, memory, block, and mutex profilers, as well as tools like pprof to visualize and analyze the profiling data.
Once you have generated a CPU profile, you can open it in either the browser or a text editor. Generating a CPU profile is quite lengthy, but using the built-in profiler in GoLand makes the process very easy.
To collect all the necessary data, GoLand uses the pprof package. GoLand provides visualizations of the profiling data, which makes it easier to identify bottlenecks and optimize your code. It also allows you to compare different profiles and compare the performance of different parts of your application by testing and profiling individual functions.
Prerequisites
Before you start exploring these tools, you should make sure you have the following:
- A machine with Go installed on it.
- GoLand installed as your IDE on your machine.
You can find all of the code used for this article in this GitHub repo.
CPU Profiler
A CPU profiler can help you understand what functions consume what percentage of CPU time.
Setting Up the Sample Program
To start, you need a sample program to profile. This example uses a Go program that calculates the nth Fibonacci number. The Fibonacci sequence is a series of numbers in which each number is the sum of the two preceding numbers. The sequence looks like this:
1, 1, 2, 3, 5, 8, 13, 21, 34, 55, 89, 144, ...
The code for the Fibonacci program is as follows:
package main
// Package main is the entry point

import "fmt"
// Import fmt to use Println to show output

func FibRecursive(n int) uint64 {
    // Function Creation to accept integer till which the Fibonacci series runs
    if n == 0 {
        return 0
        // Base case for the recursive call
    } else if n == 1 {
        return 1
        // Base case for the recursive call
    } else {
        return FibRecursive(n-1) + FibRecursive(n-2)
        // Recursive call for finding the Fibonacci number
    }
}


func main() {
    // Function call to print out the nth term of the Fibonacci series
    fmt.Println(FibRecursive(3))
}
You can run the program with go run main.go after saving the program as main.go. You can use the built-in GoLand runner as well.
Setting Up the Sample Unit Test
You then need to create a unit test that will help you test and profile or benchmark your program.
The following code demonstrates the test logic based on the 30th element in the series being equal to 102334155, the 40th Fibonacci number:
package main
import "testing"
func TestFib2(t *testing.T) {
        if FibRecursive(40) != 102334155 {
            t.Error("Incorrect!")
    }
}
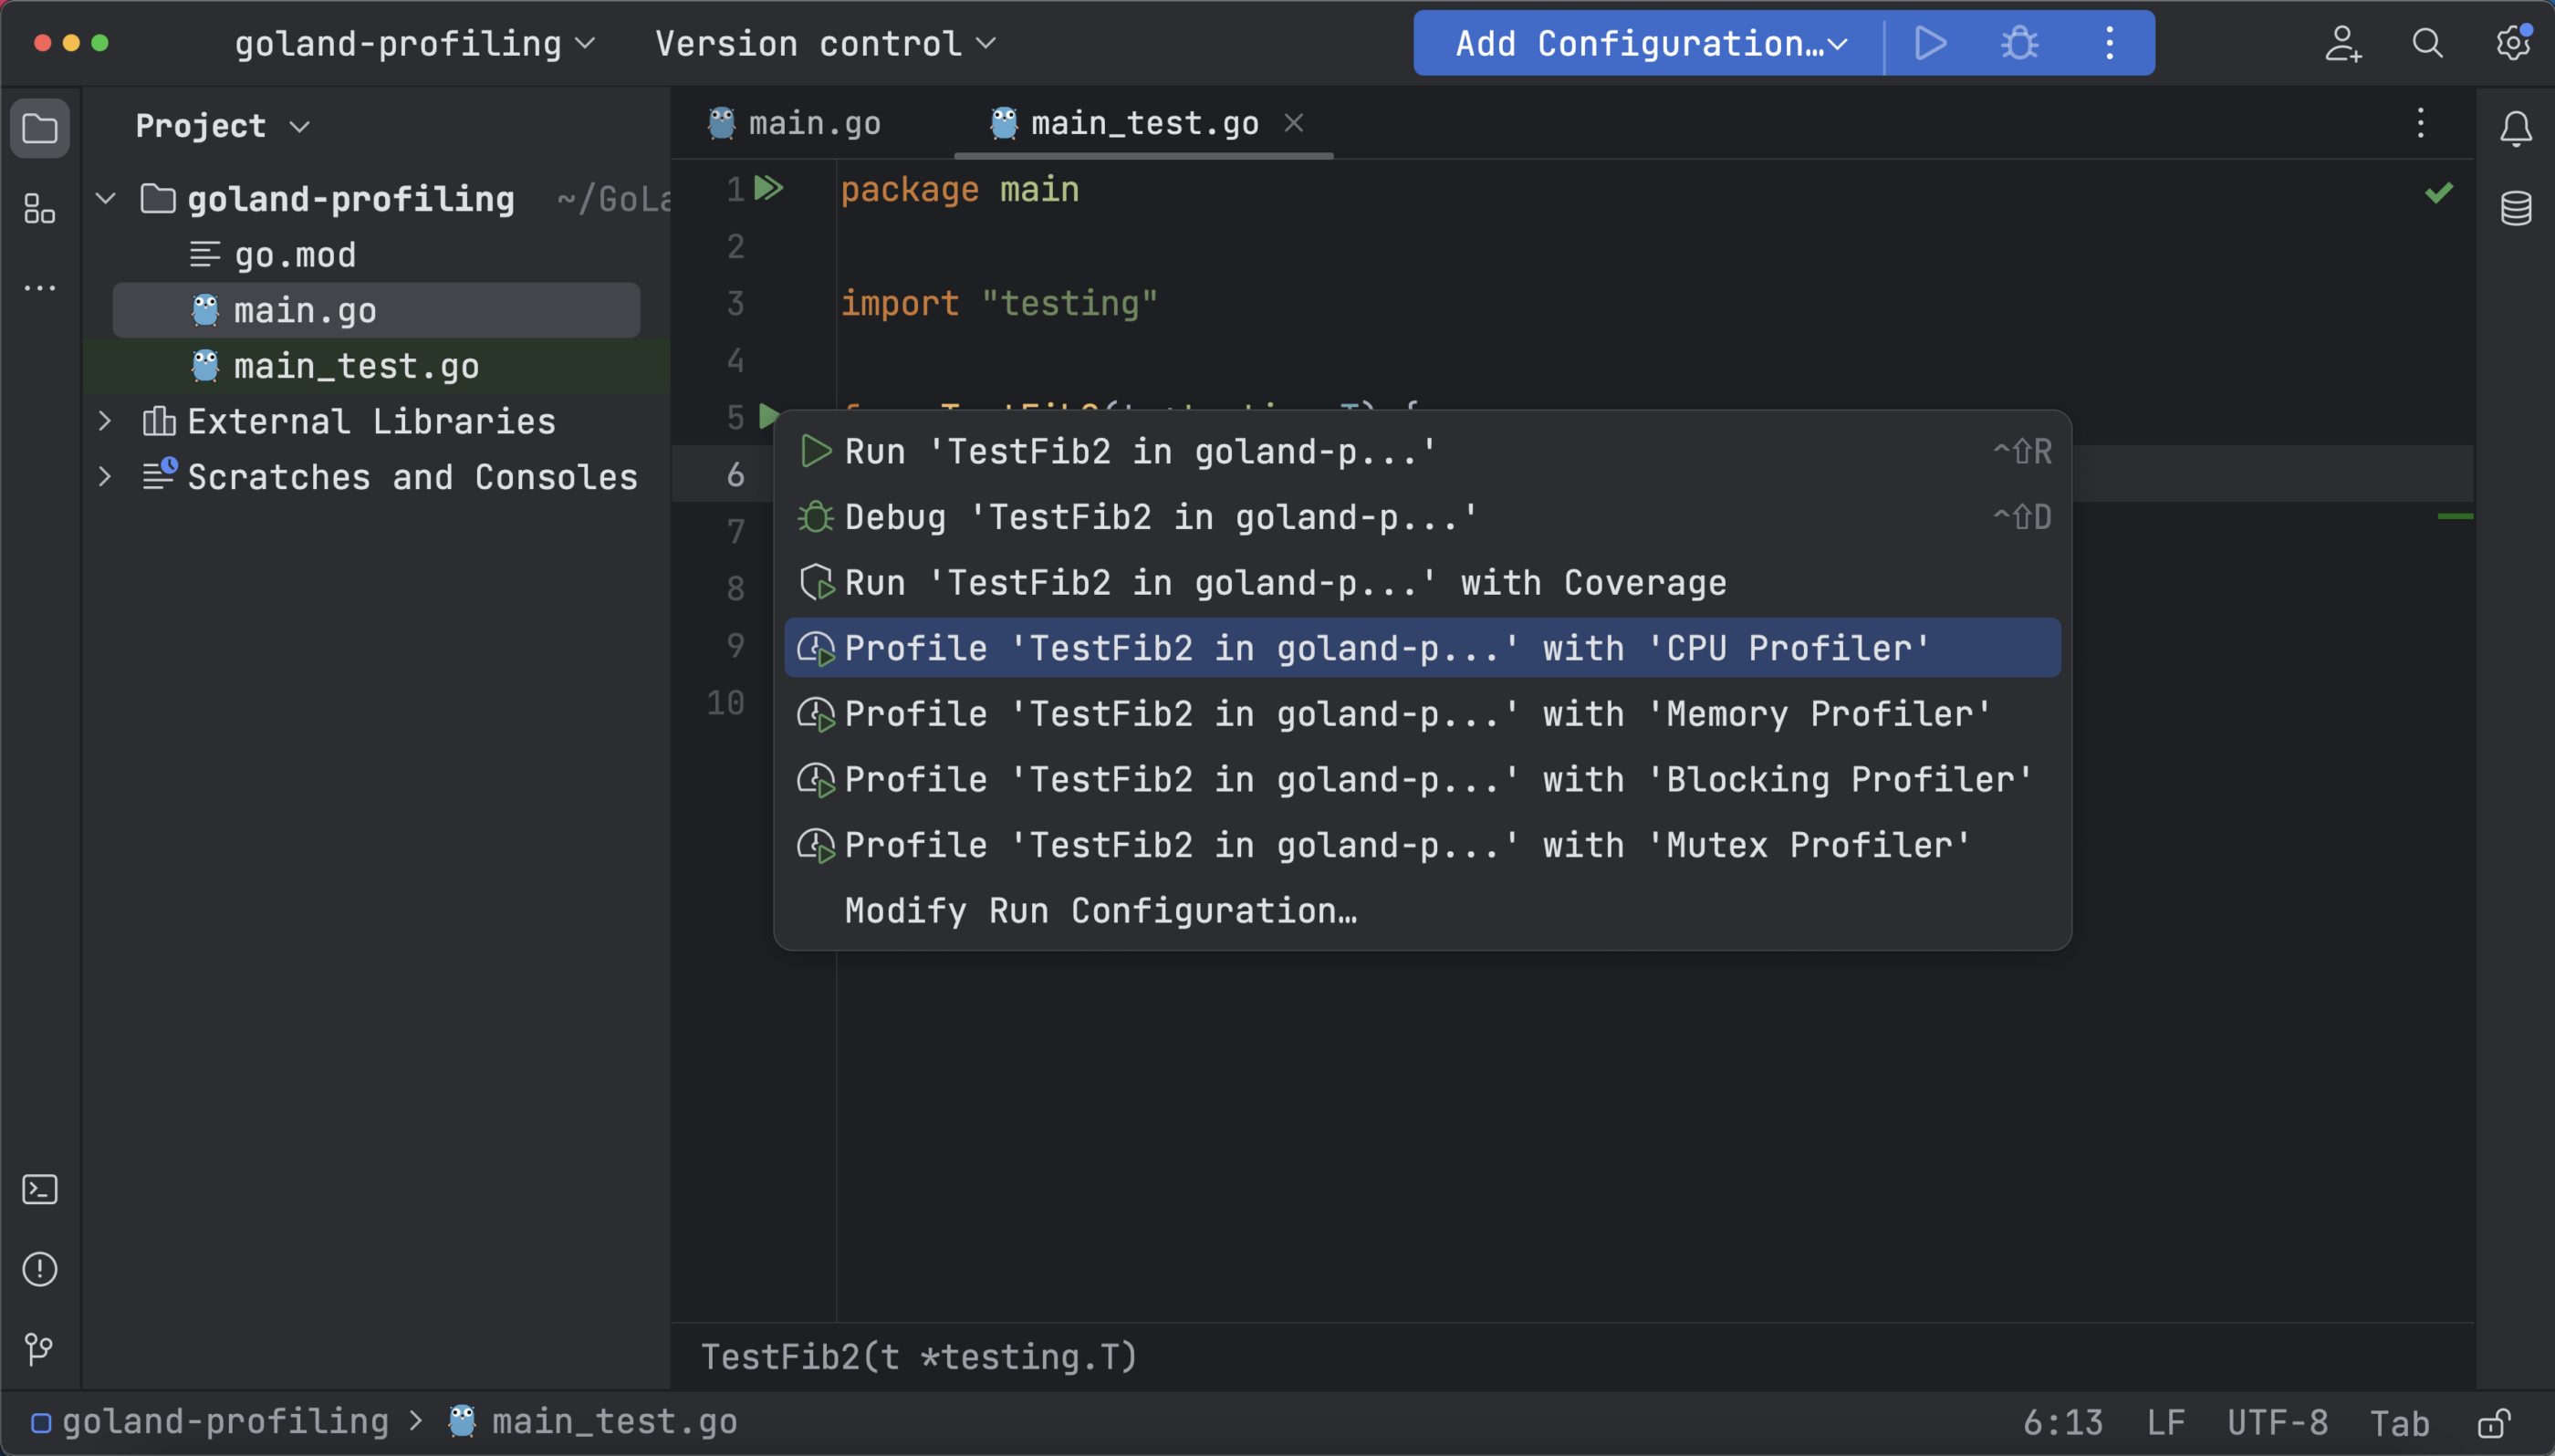
To test manually, use the go test command or, to run CPU profiling, open your _test.go file, go to the TestFib2 function, then click the Run icon in the gutter area and select Profile with ‘CPU Profiler’:
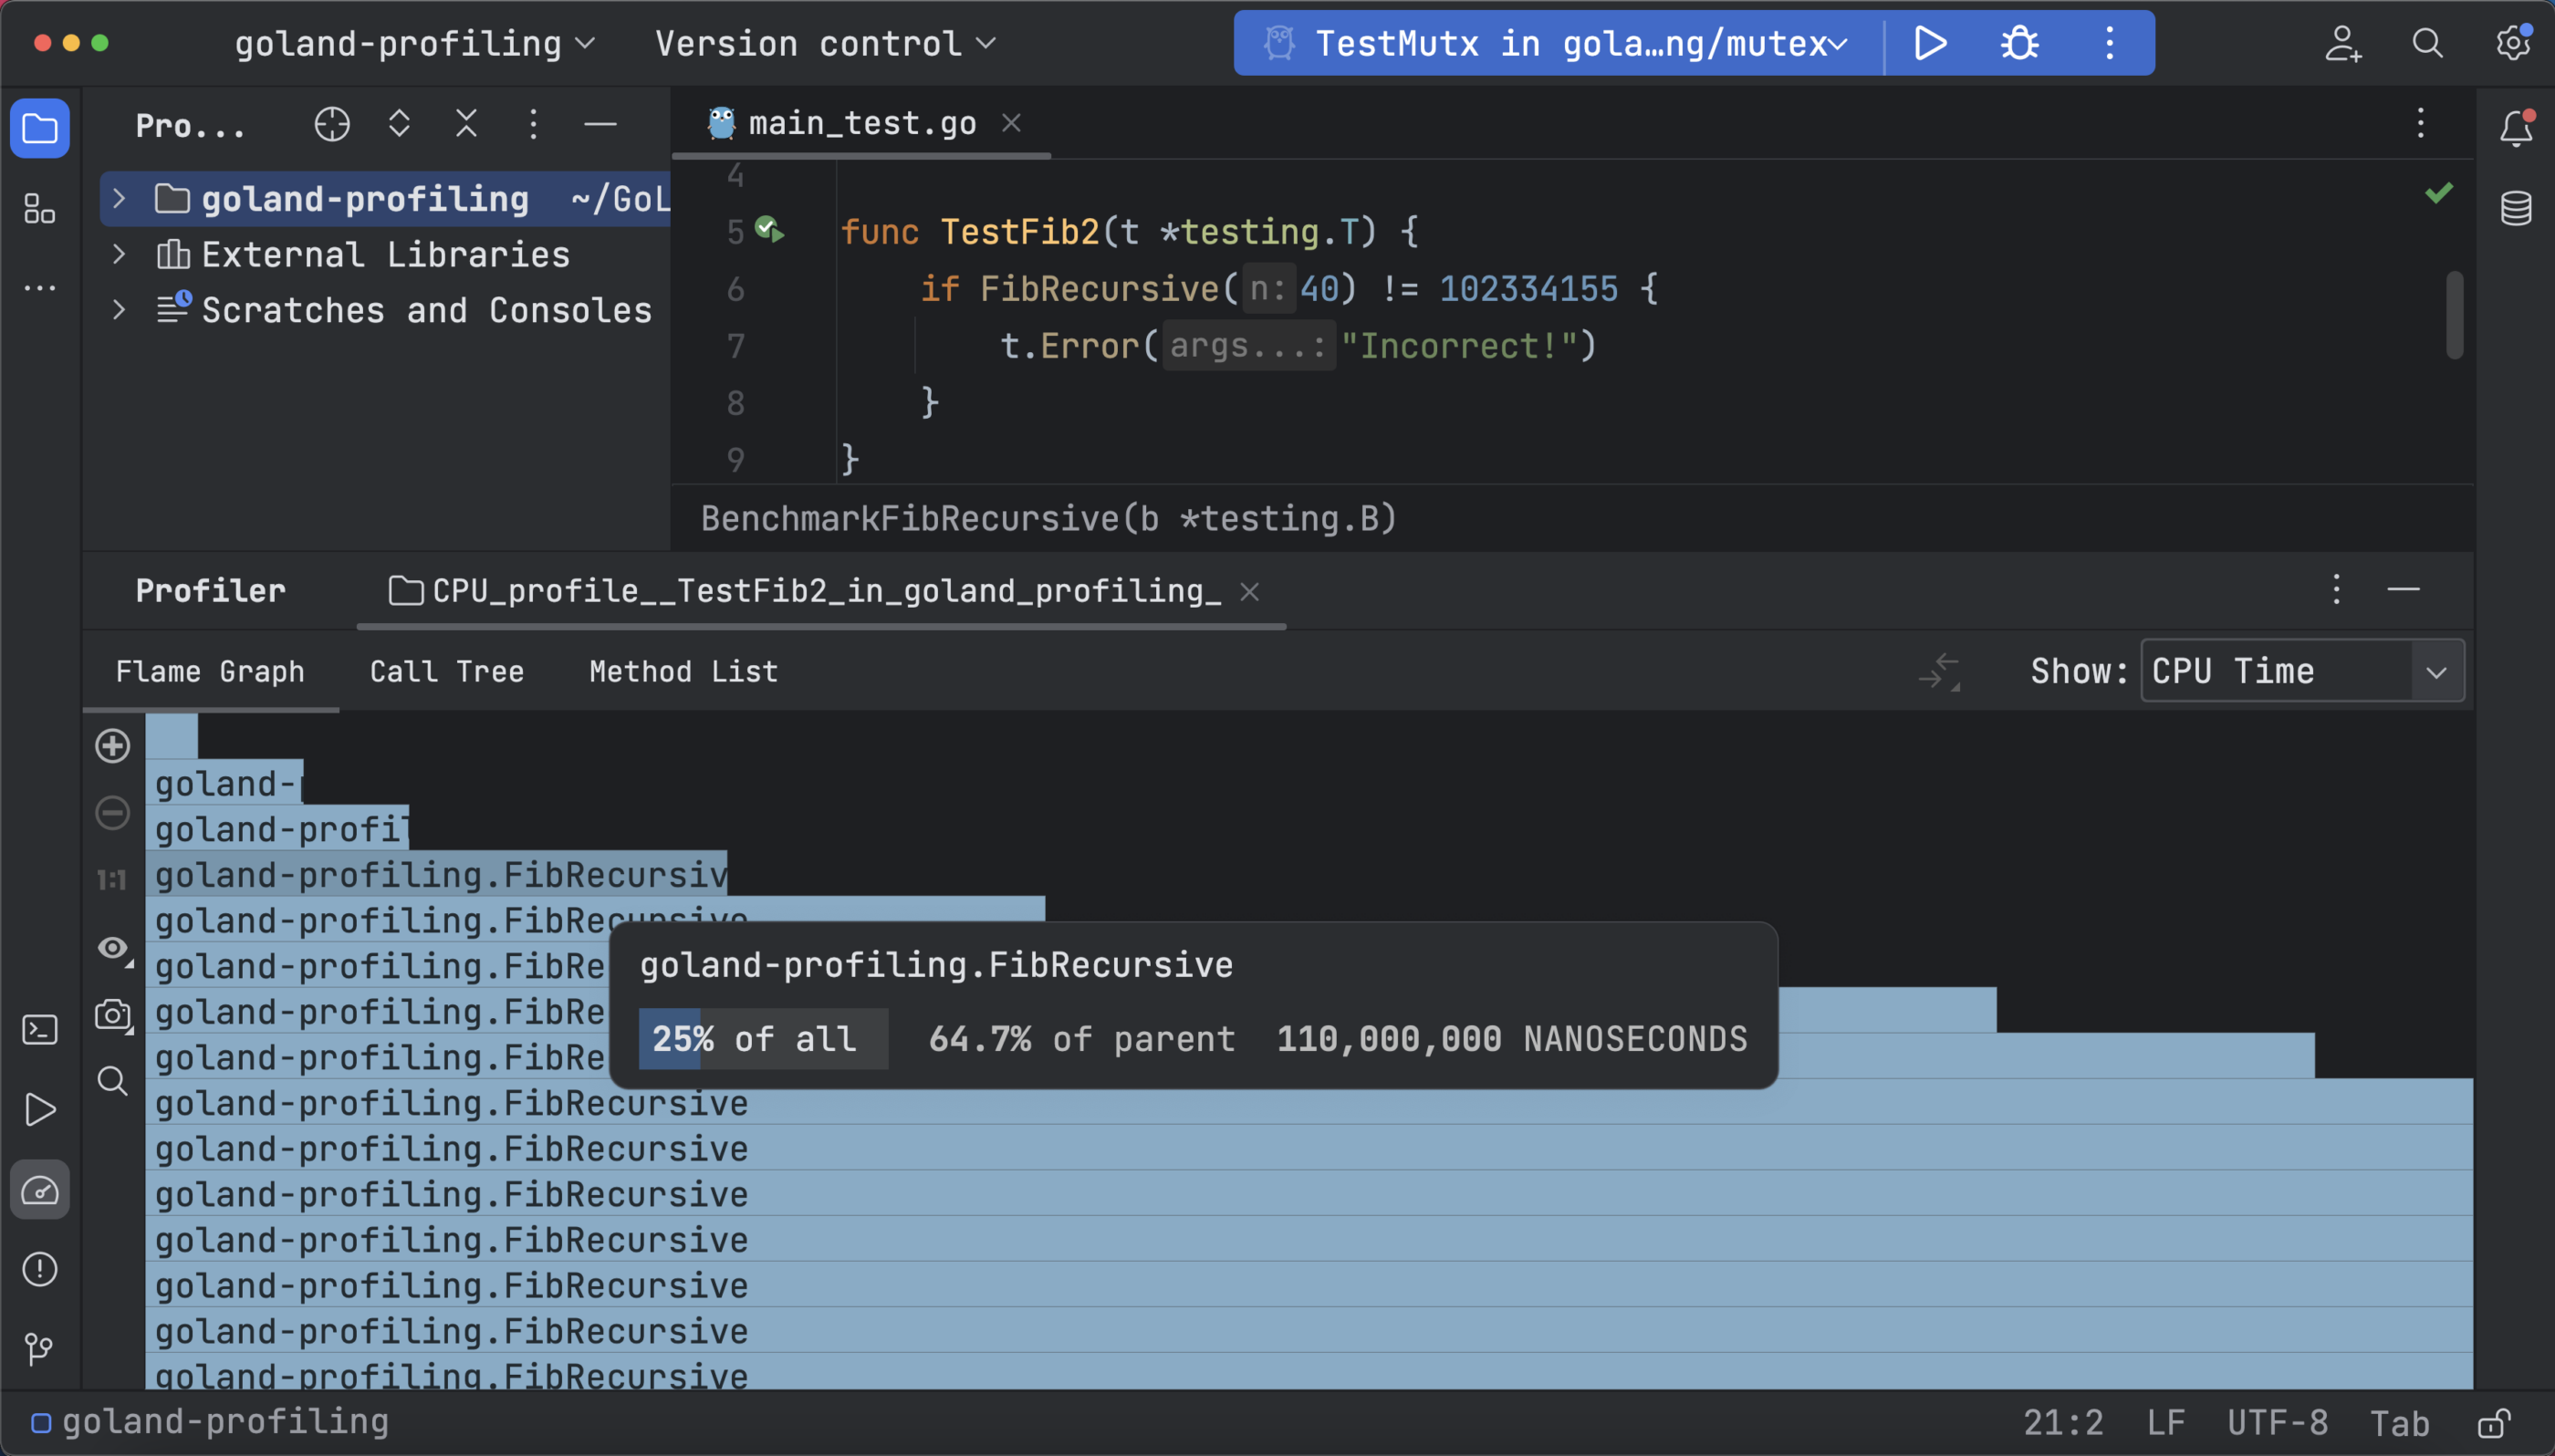
Now your profiling data is represented in a flame graph, call tree, and method list. The flame graph shows the CPU usage of functions with the help of stack traces. You can see that the testing function and other recursive calls take the most time. This time is represented by the widest blocks on the graph:
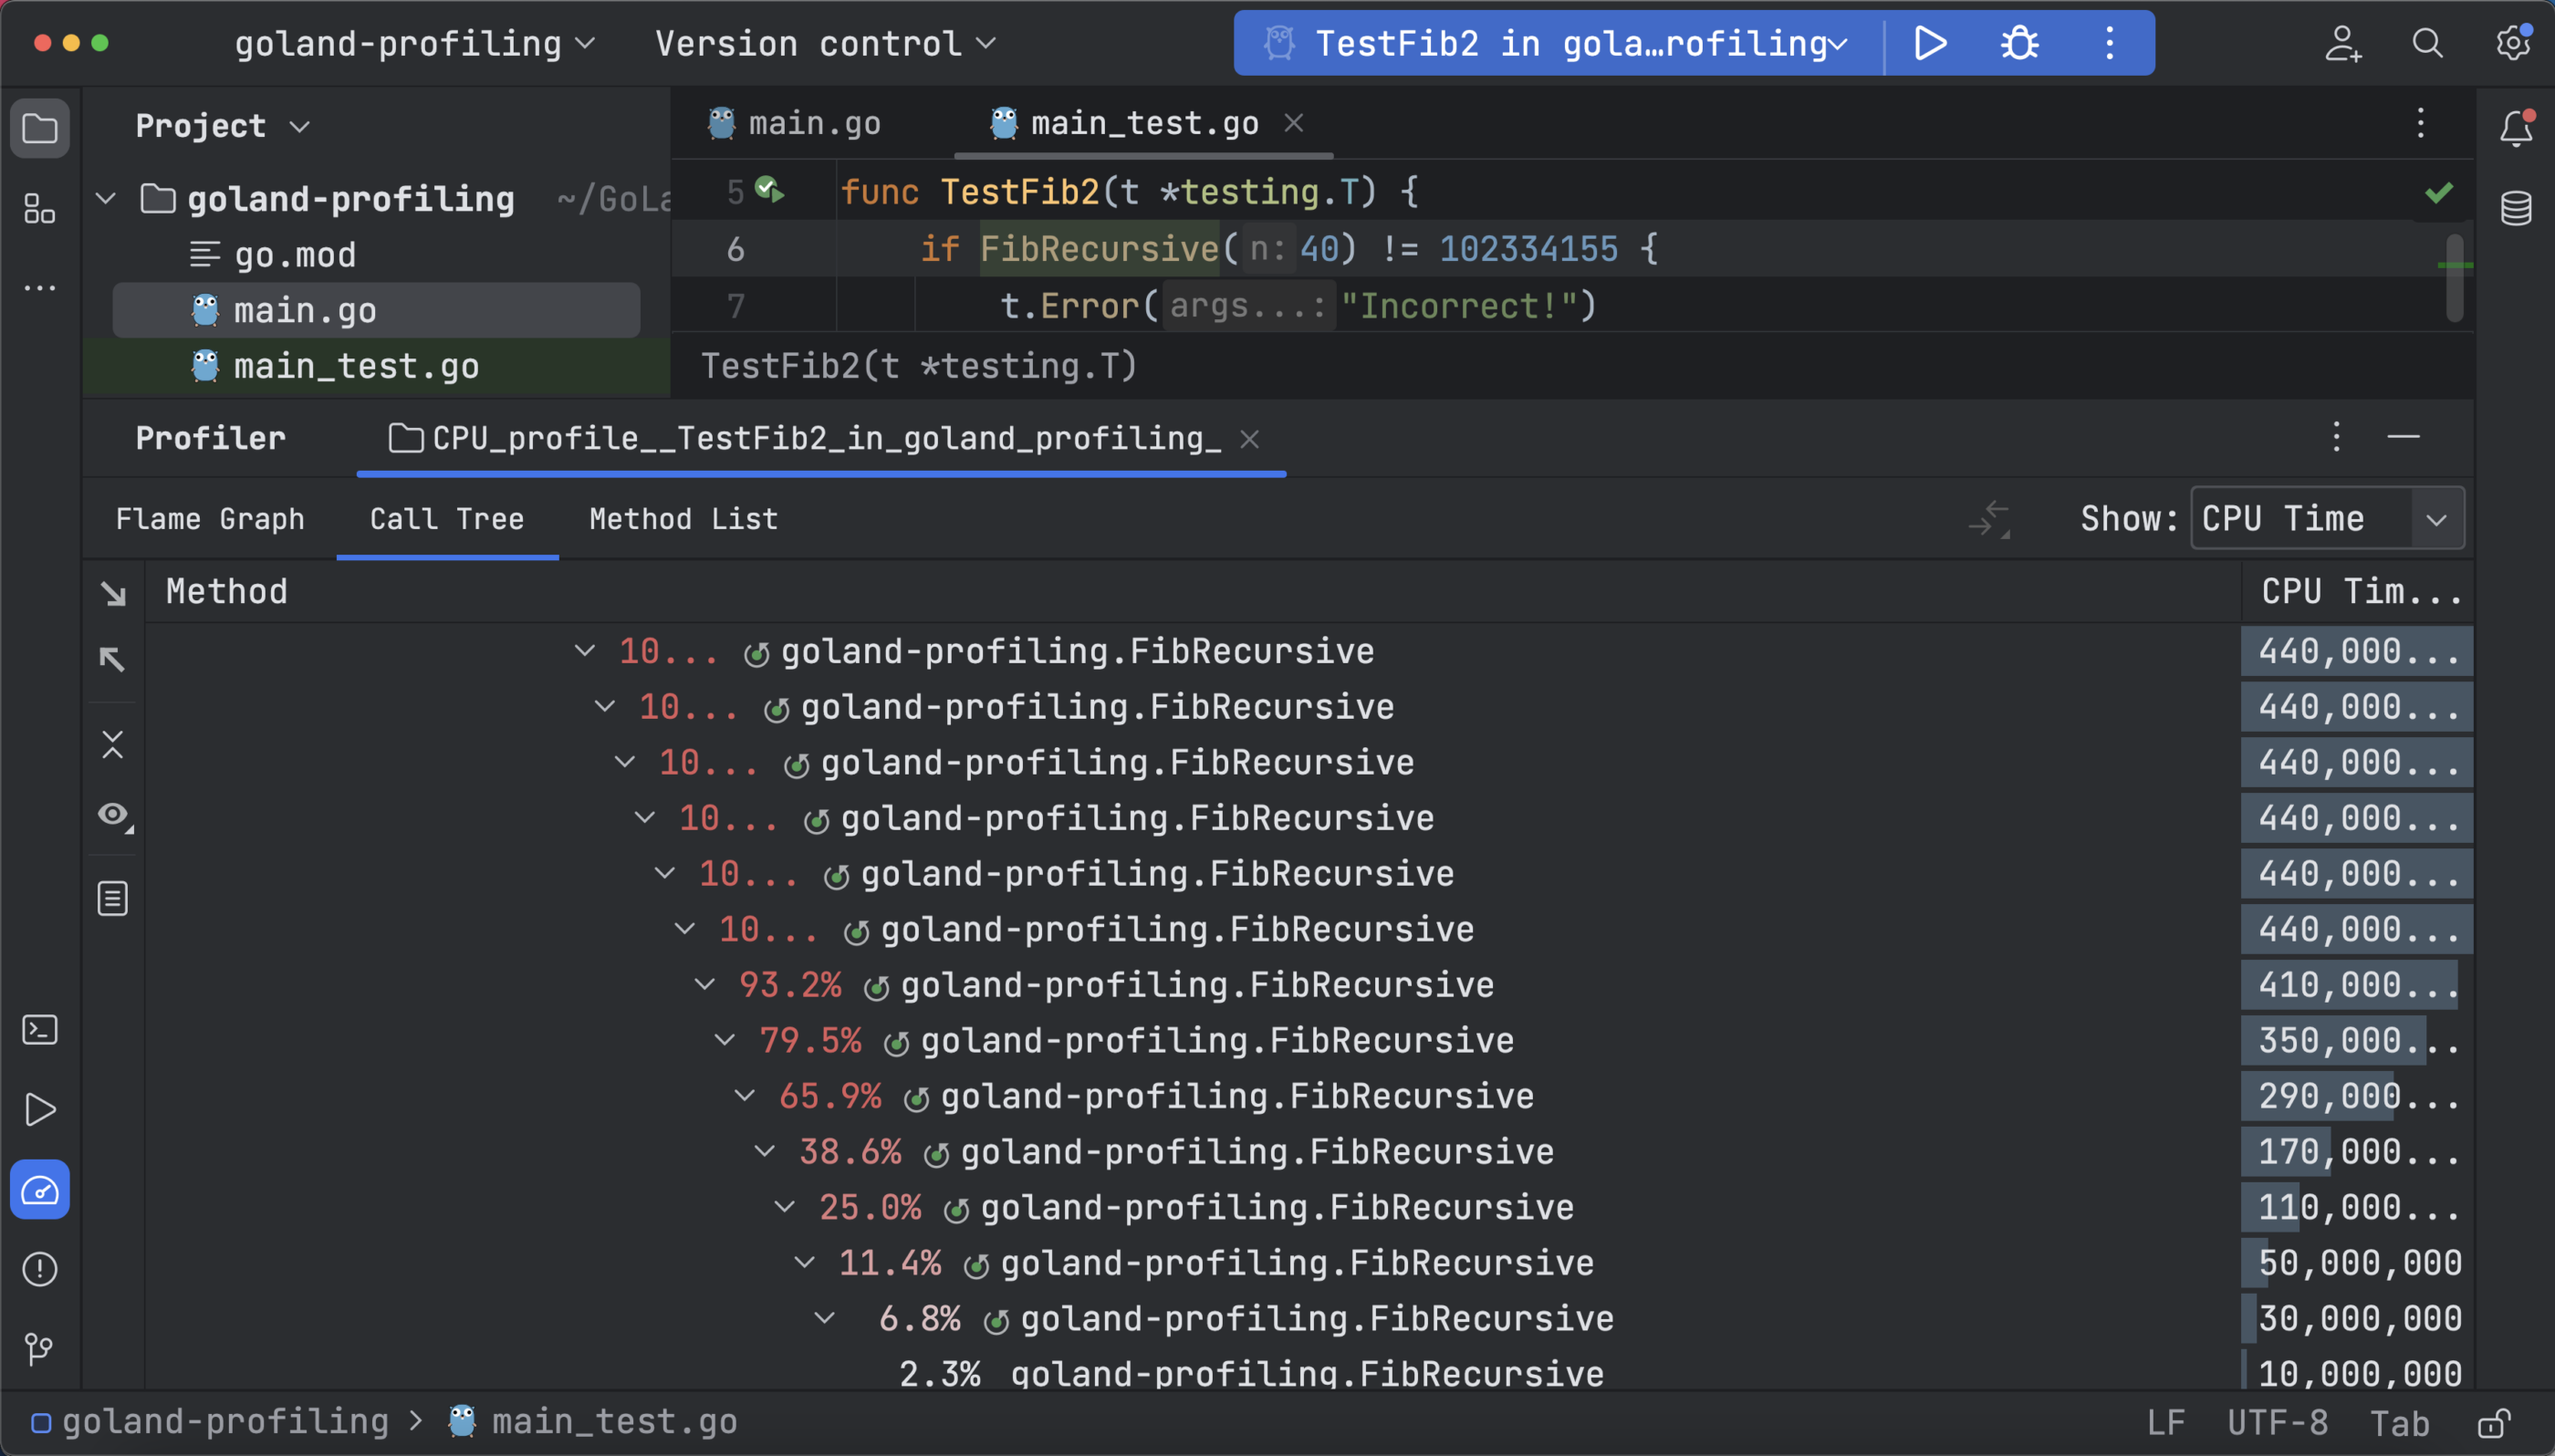
Call trees are helpful for understanding the sample call stack from the function and the associated metadata, and they have an option to filter the sequence of calls.
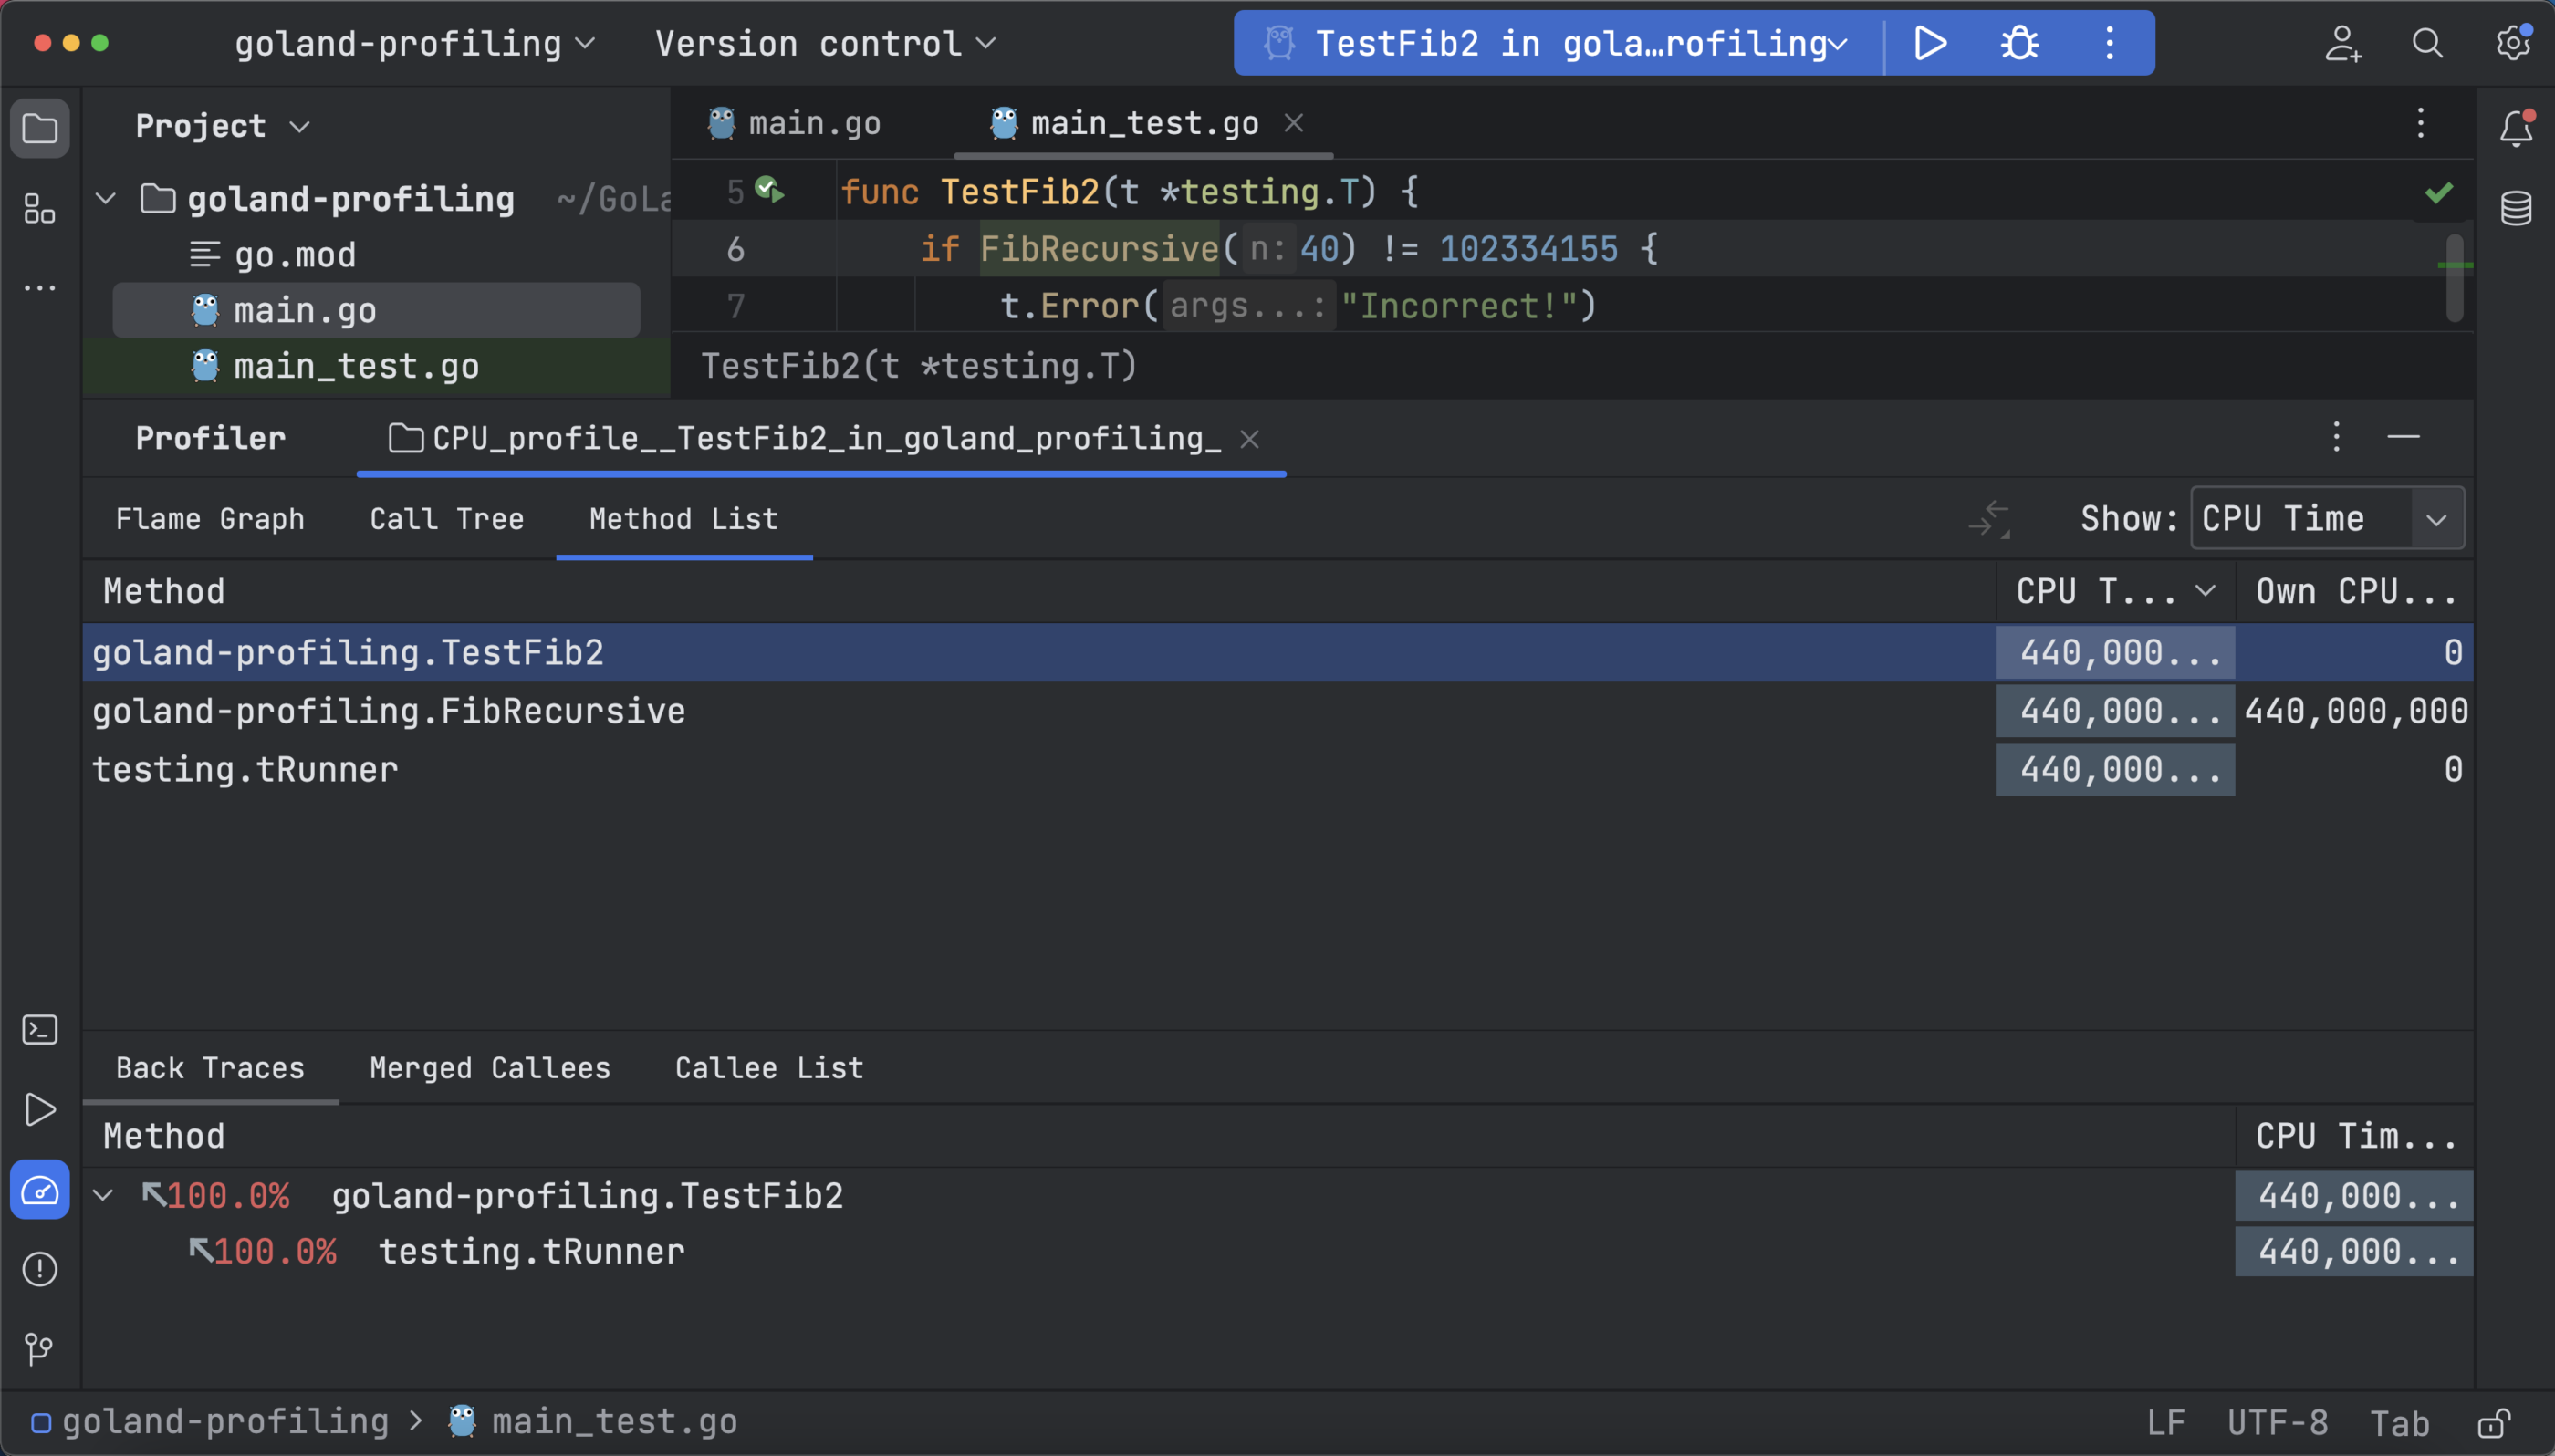
A method list can be used to collect all functions and sort them in a cumulative sample time with back tracing and merge callees support for each method. Below you can see merged callees of the recursive FibRecursive function and the call tree when CPU time is selected:
How Profiling Can Help
Profiling can help you understand how your application is performing and how you can make it more optimized. As a practical example, consider the Fibonacci series program. The CPU profile of that program shows that the recursive calls to the FibRecursive function take up most of the CPU time. Hence, optimizing the recursive calls should be the first priority.
To optimize a program with many recursive calls, you can set up an array to store the call values and cache the results using memoization:
package main

import "fmt"

var f [100010]uint64

func Fib(n int) uint64 {
    f[0] = 0
    f[1] = 1

    for i := 2; i <= n; i++ {
        f[i] = f[i-1] + f[i-2]
    }

    return f[n]
}

func main() {
    fmt.Println(Fib(3))
}
Running the CPU profiler with the updated program won’t show any profiling data, as the program now runs too fast for the profiler to collect samples. Since you were able to eliminate the recursive calls, this clearly shows an improvement.
To verify that the changes you made indeed improved performance, you can use benchmarking.
The Go standard library provides a testing package that allows you to create benchmarks and measure the performance of your code.
Here is an example benchmark to test the changes in the Fibonacci example:
func BenchmarkFib(b *testing.B) {
    for i := 0; i < b.N; i++ {
        Fib(1)
    }
}
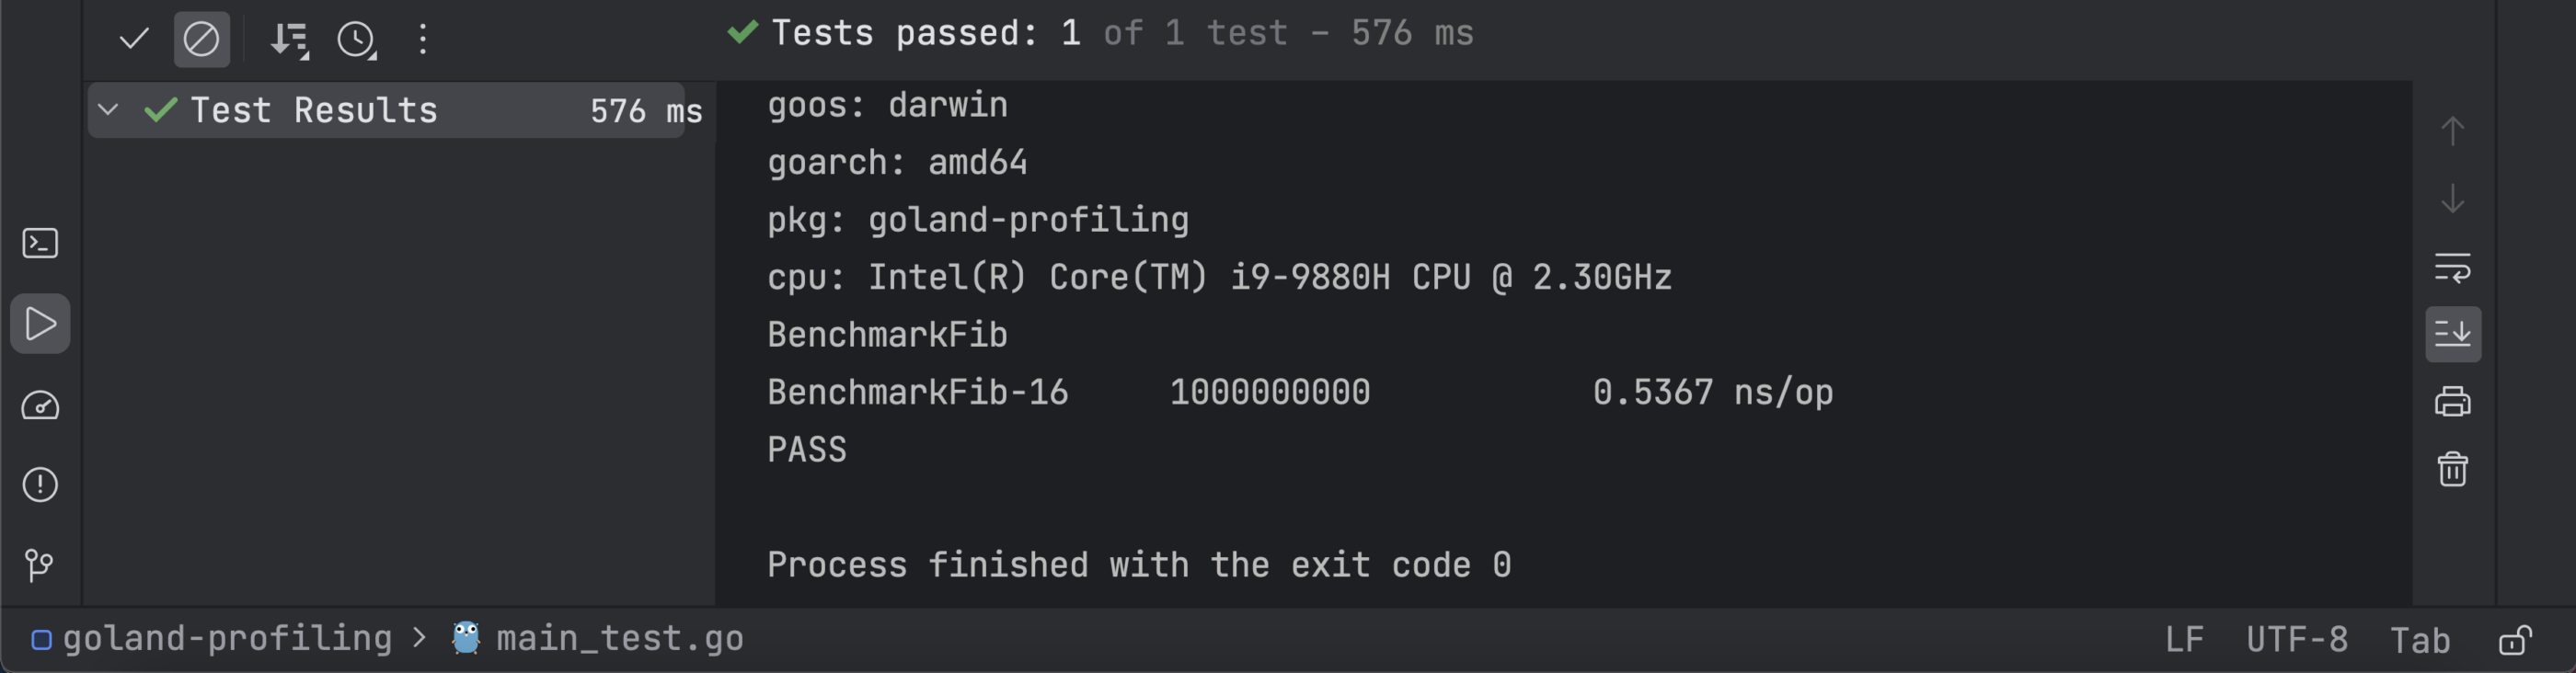
When you run the benchmark, you’ll get the following results indicating how efficient your program is:
Using the code below, you can benchmark your initial FibRecursive function:
func BenchmarkFibRecursive(b *testing.B) {
    for i := 0; i < b.N; i++ {
        FibRecursive(1)
    }
}
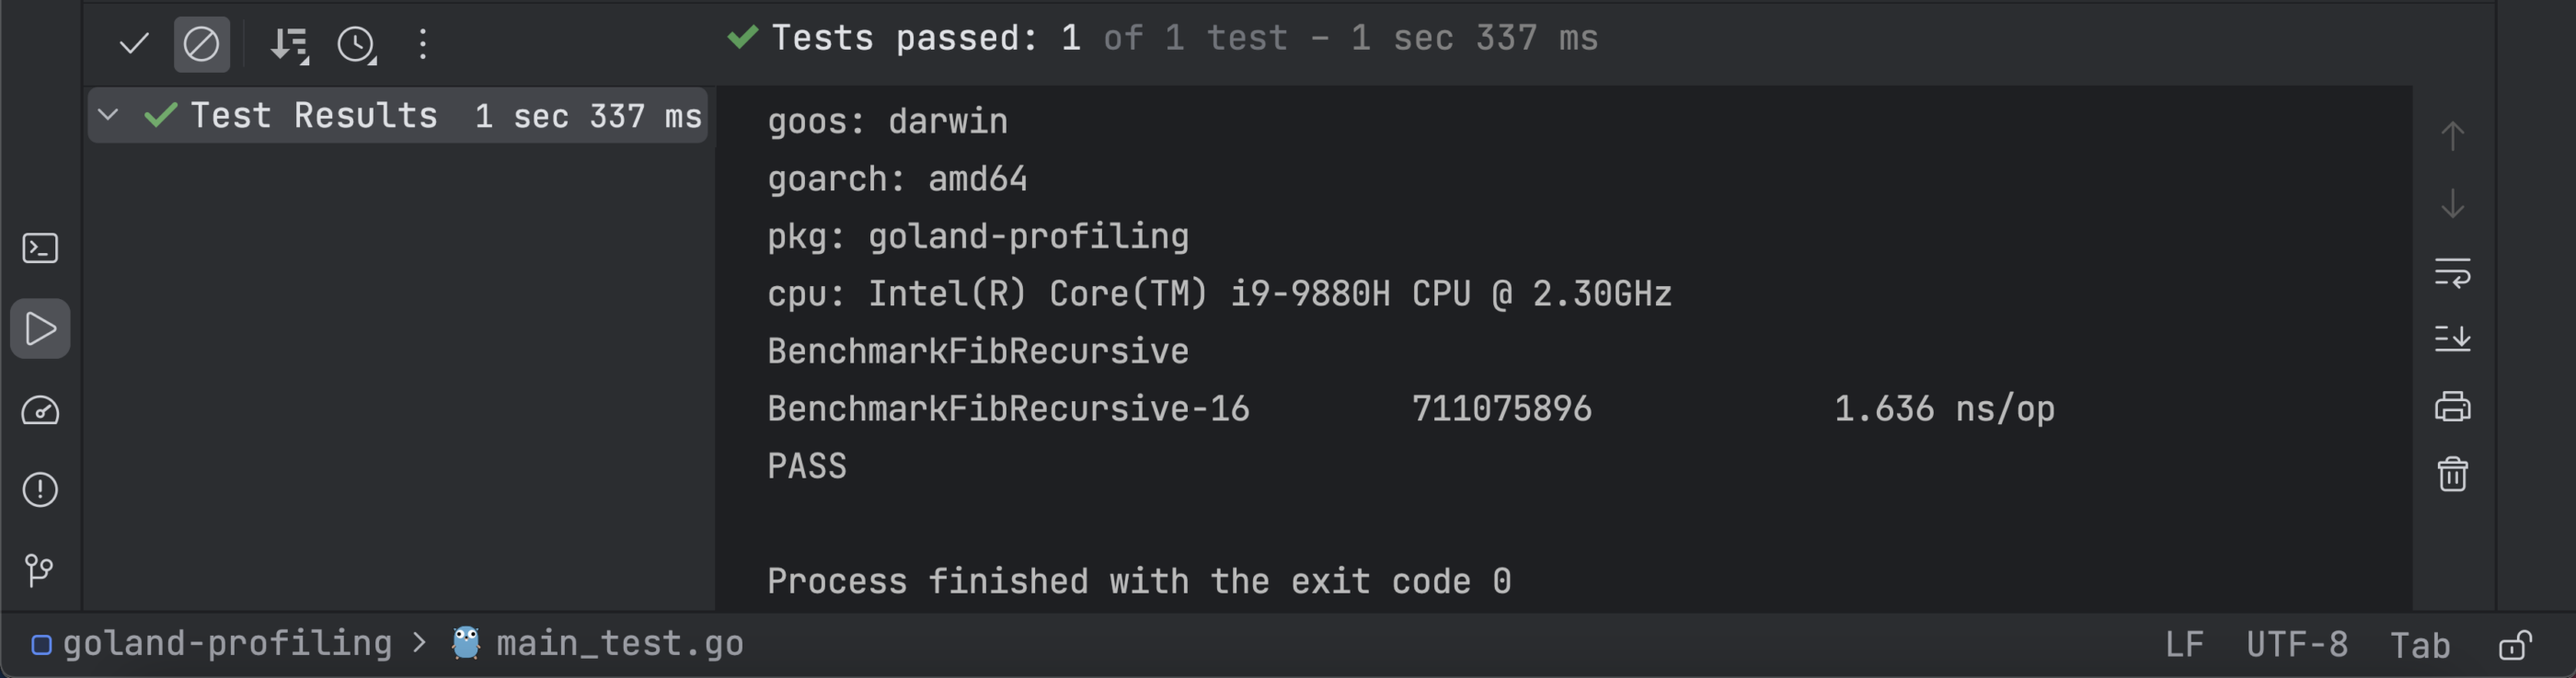
You can see that the Fib function takes much less time (0.5367 nanoseconds per operation) than the FibRecursive function (1.636 ns/op), indicating a significant improvement in performance.
Memory Profiler
The memory profiler analyzes and identifies memory leaks and overall memory usage by displaying the functions and allocated heap. To run memory profiling, open your _test.go file, click the Run icon in the gutter area, and select Profile with ‘Memory Profiler’.
Your profiling data here is also represented in the same three ways: a flame graph, call tree, and method list. The flame graph data below shows you the allocated space and objects with a more detailed view that shows the in-use object and space:
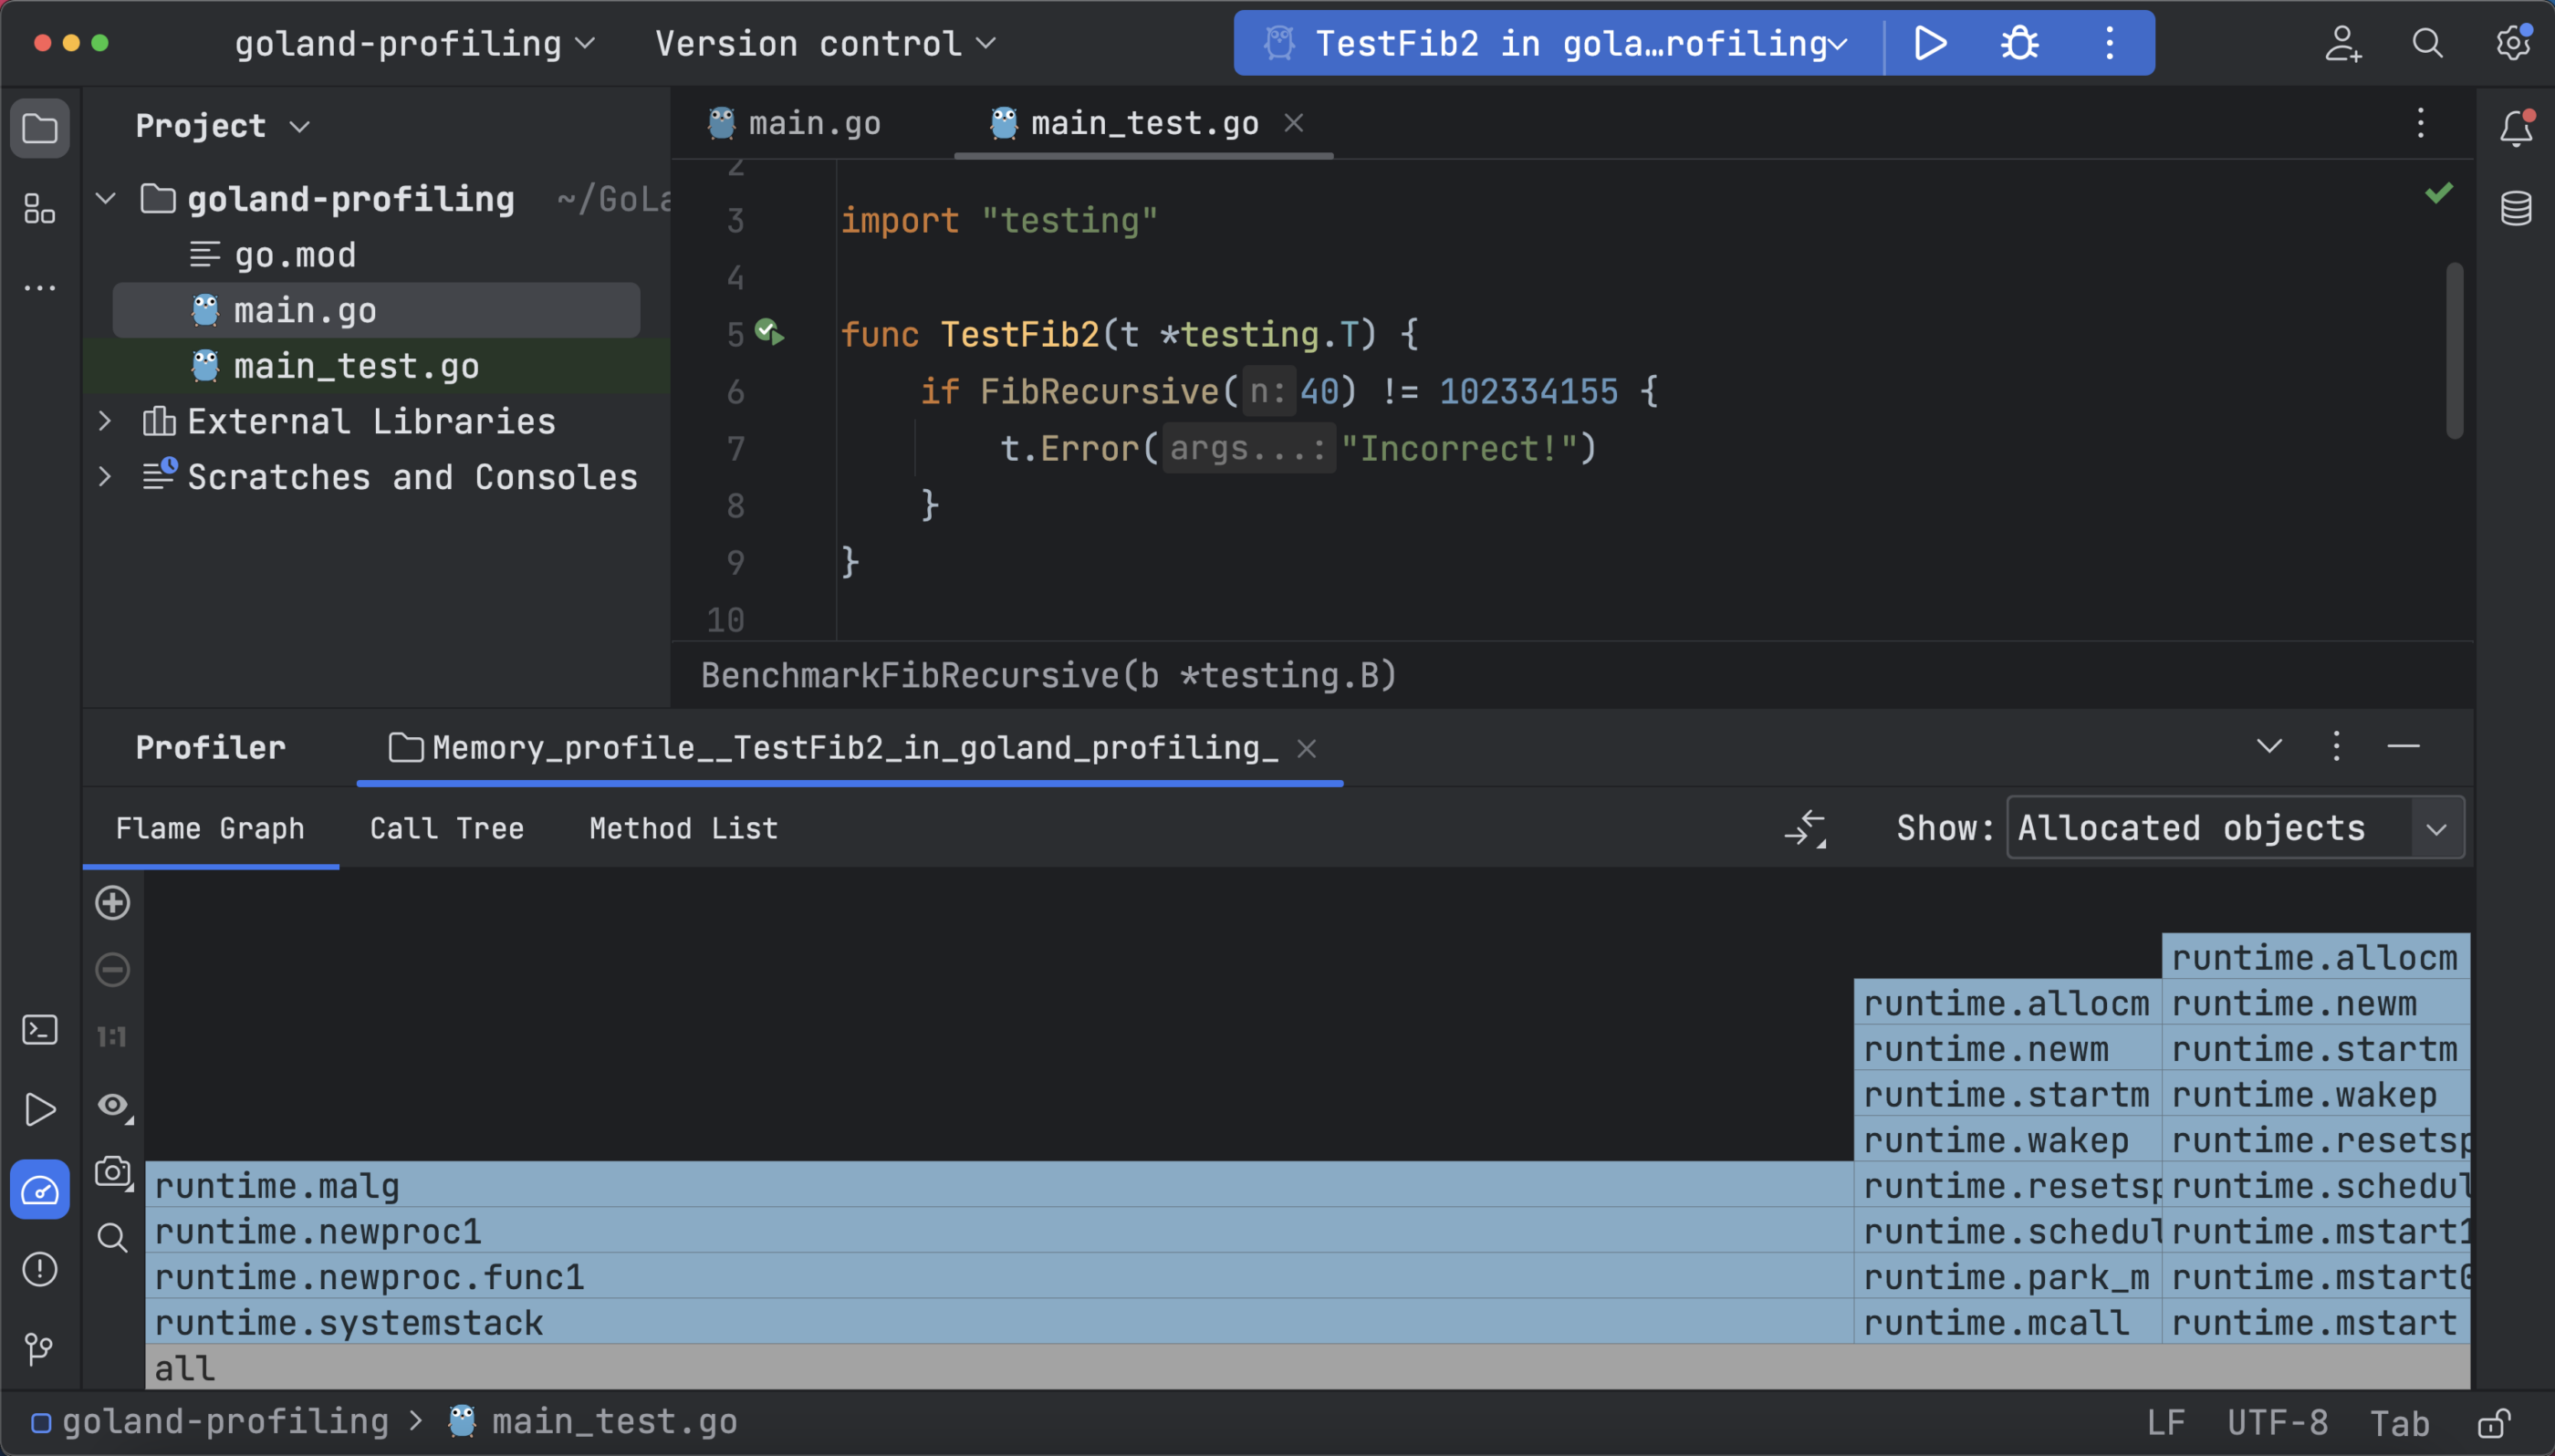
Since small allocations directly affect execution speed, memory optimization can be achieved by reducing the number of small objects.
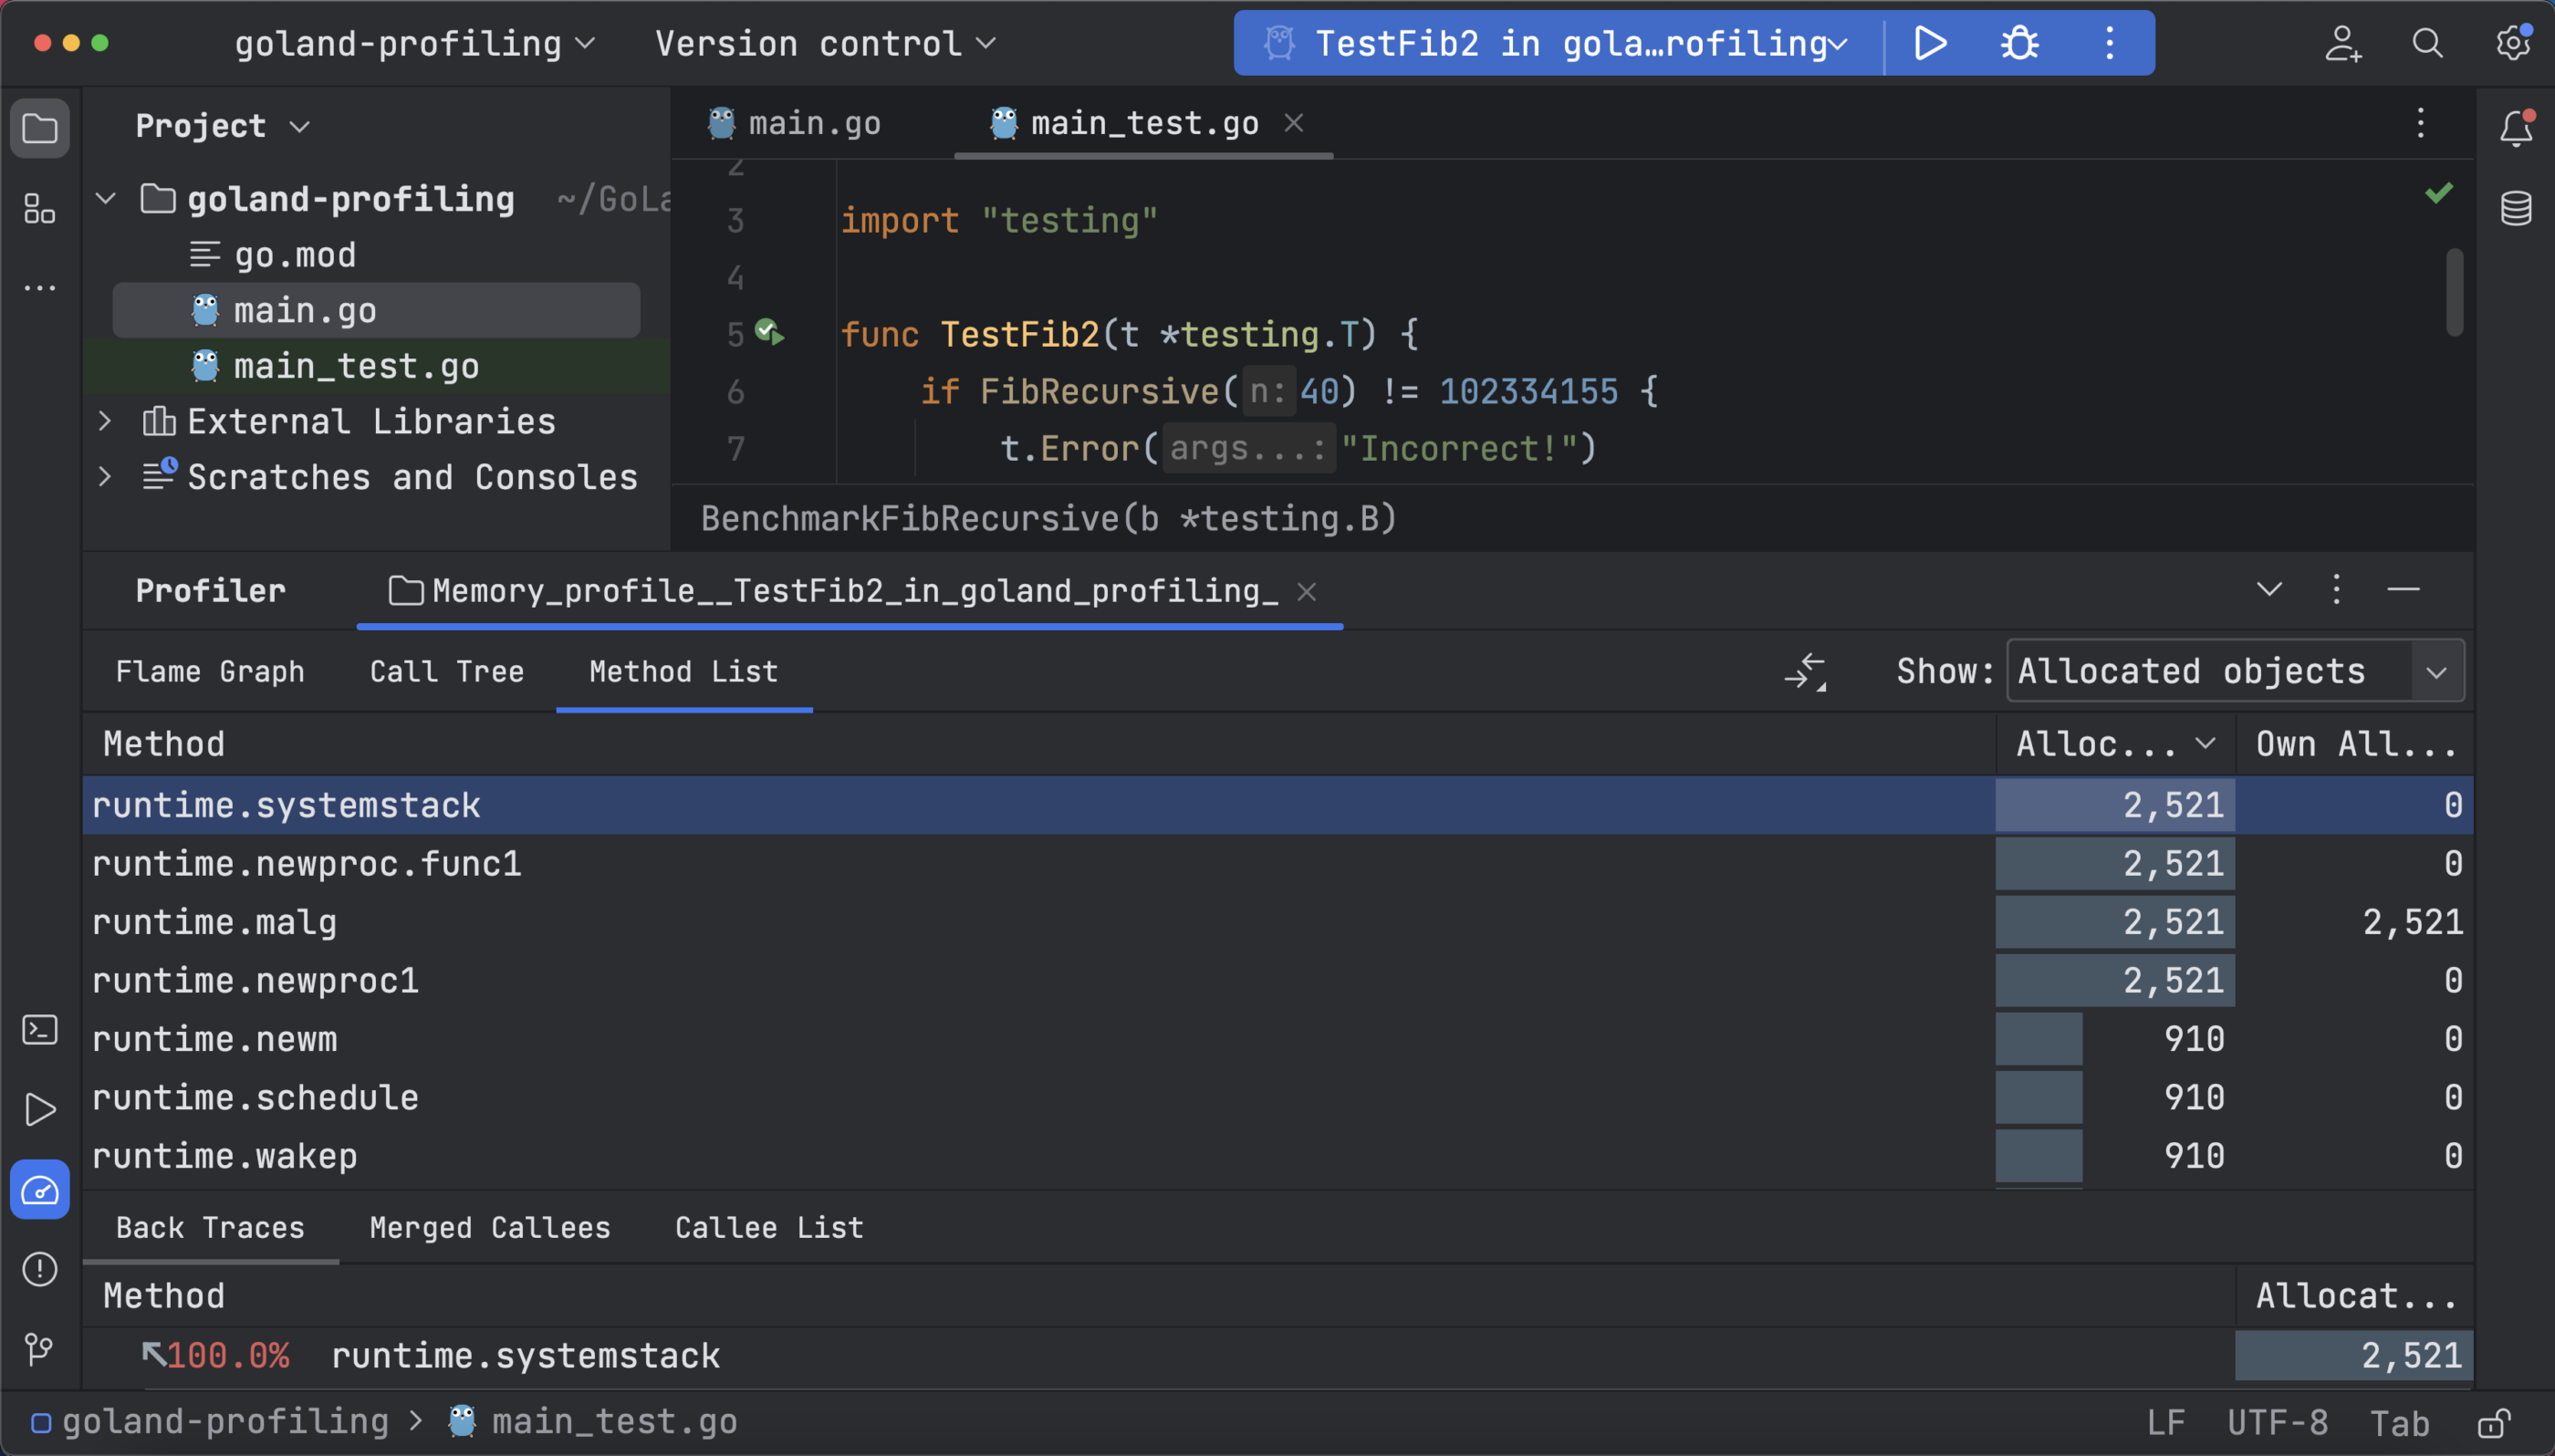
The call tree shows the memory usage of the objects in memory, and the method list shows the same data as the flame graph but in a tabular way, allowing you to explore the individual methods and filter calls:
Blocking Profiler
The blocking profiler is useful for locating unbuffered or full channels, sync.Mutex locks, or any other bottlenecks since it displays the time period during which goroutines are not running (waiting). Select Profile with ‘Blocking Profiler’ to run this profiler after you have added the following code to main.go:
package main

import (
    "sync"
    "time"
)

var ch = make(chan int)

func Block() {
    // WaitGroup is used to make the function wait for G1 and G2 to finish
    wg := sync.WaitGroup{}
    wg.Add(2)
    go G1(&wg)
    go G2(&wg)
    wg.Wait()
}

func G1(wg *sync.WaitGroup) {
    // Write to the channel
    ch <- 100
    wg.Done()
}

func G2(wg *sync.WaitGroup) {
    // Sleep for 1 second
    time.Sleep(time.Second)
    // Read from the channel
    <-ch
    wg.Done()
}
In the above code, G1 is getting blocked because it can’t write to the channel before G2 wakes up from sleep and is ready to read.
The following test checks for the Block function:
func TestBlock(t *testing.T) {
// Call the block function
    Block()
}
The following flame graph shows how long the function was waiting (if you have Delay selected) or number of contentions (if you have Contentions selected) and the percentage difference between procedures in the call tree that belong to the same parent:
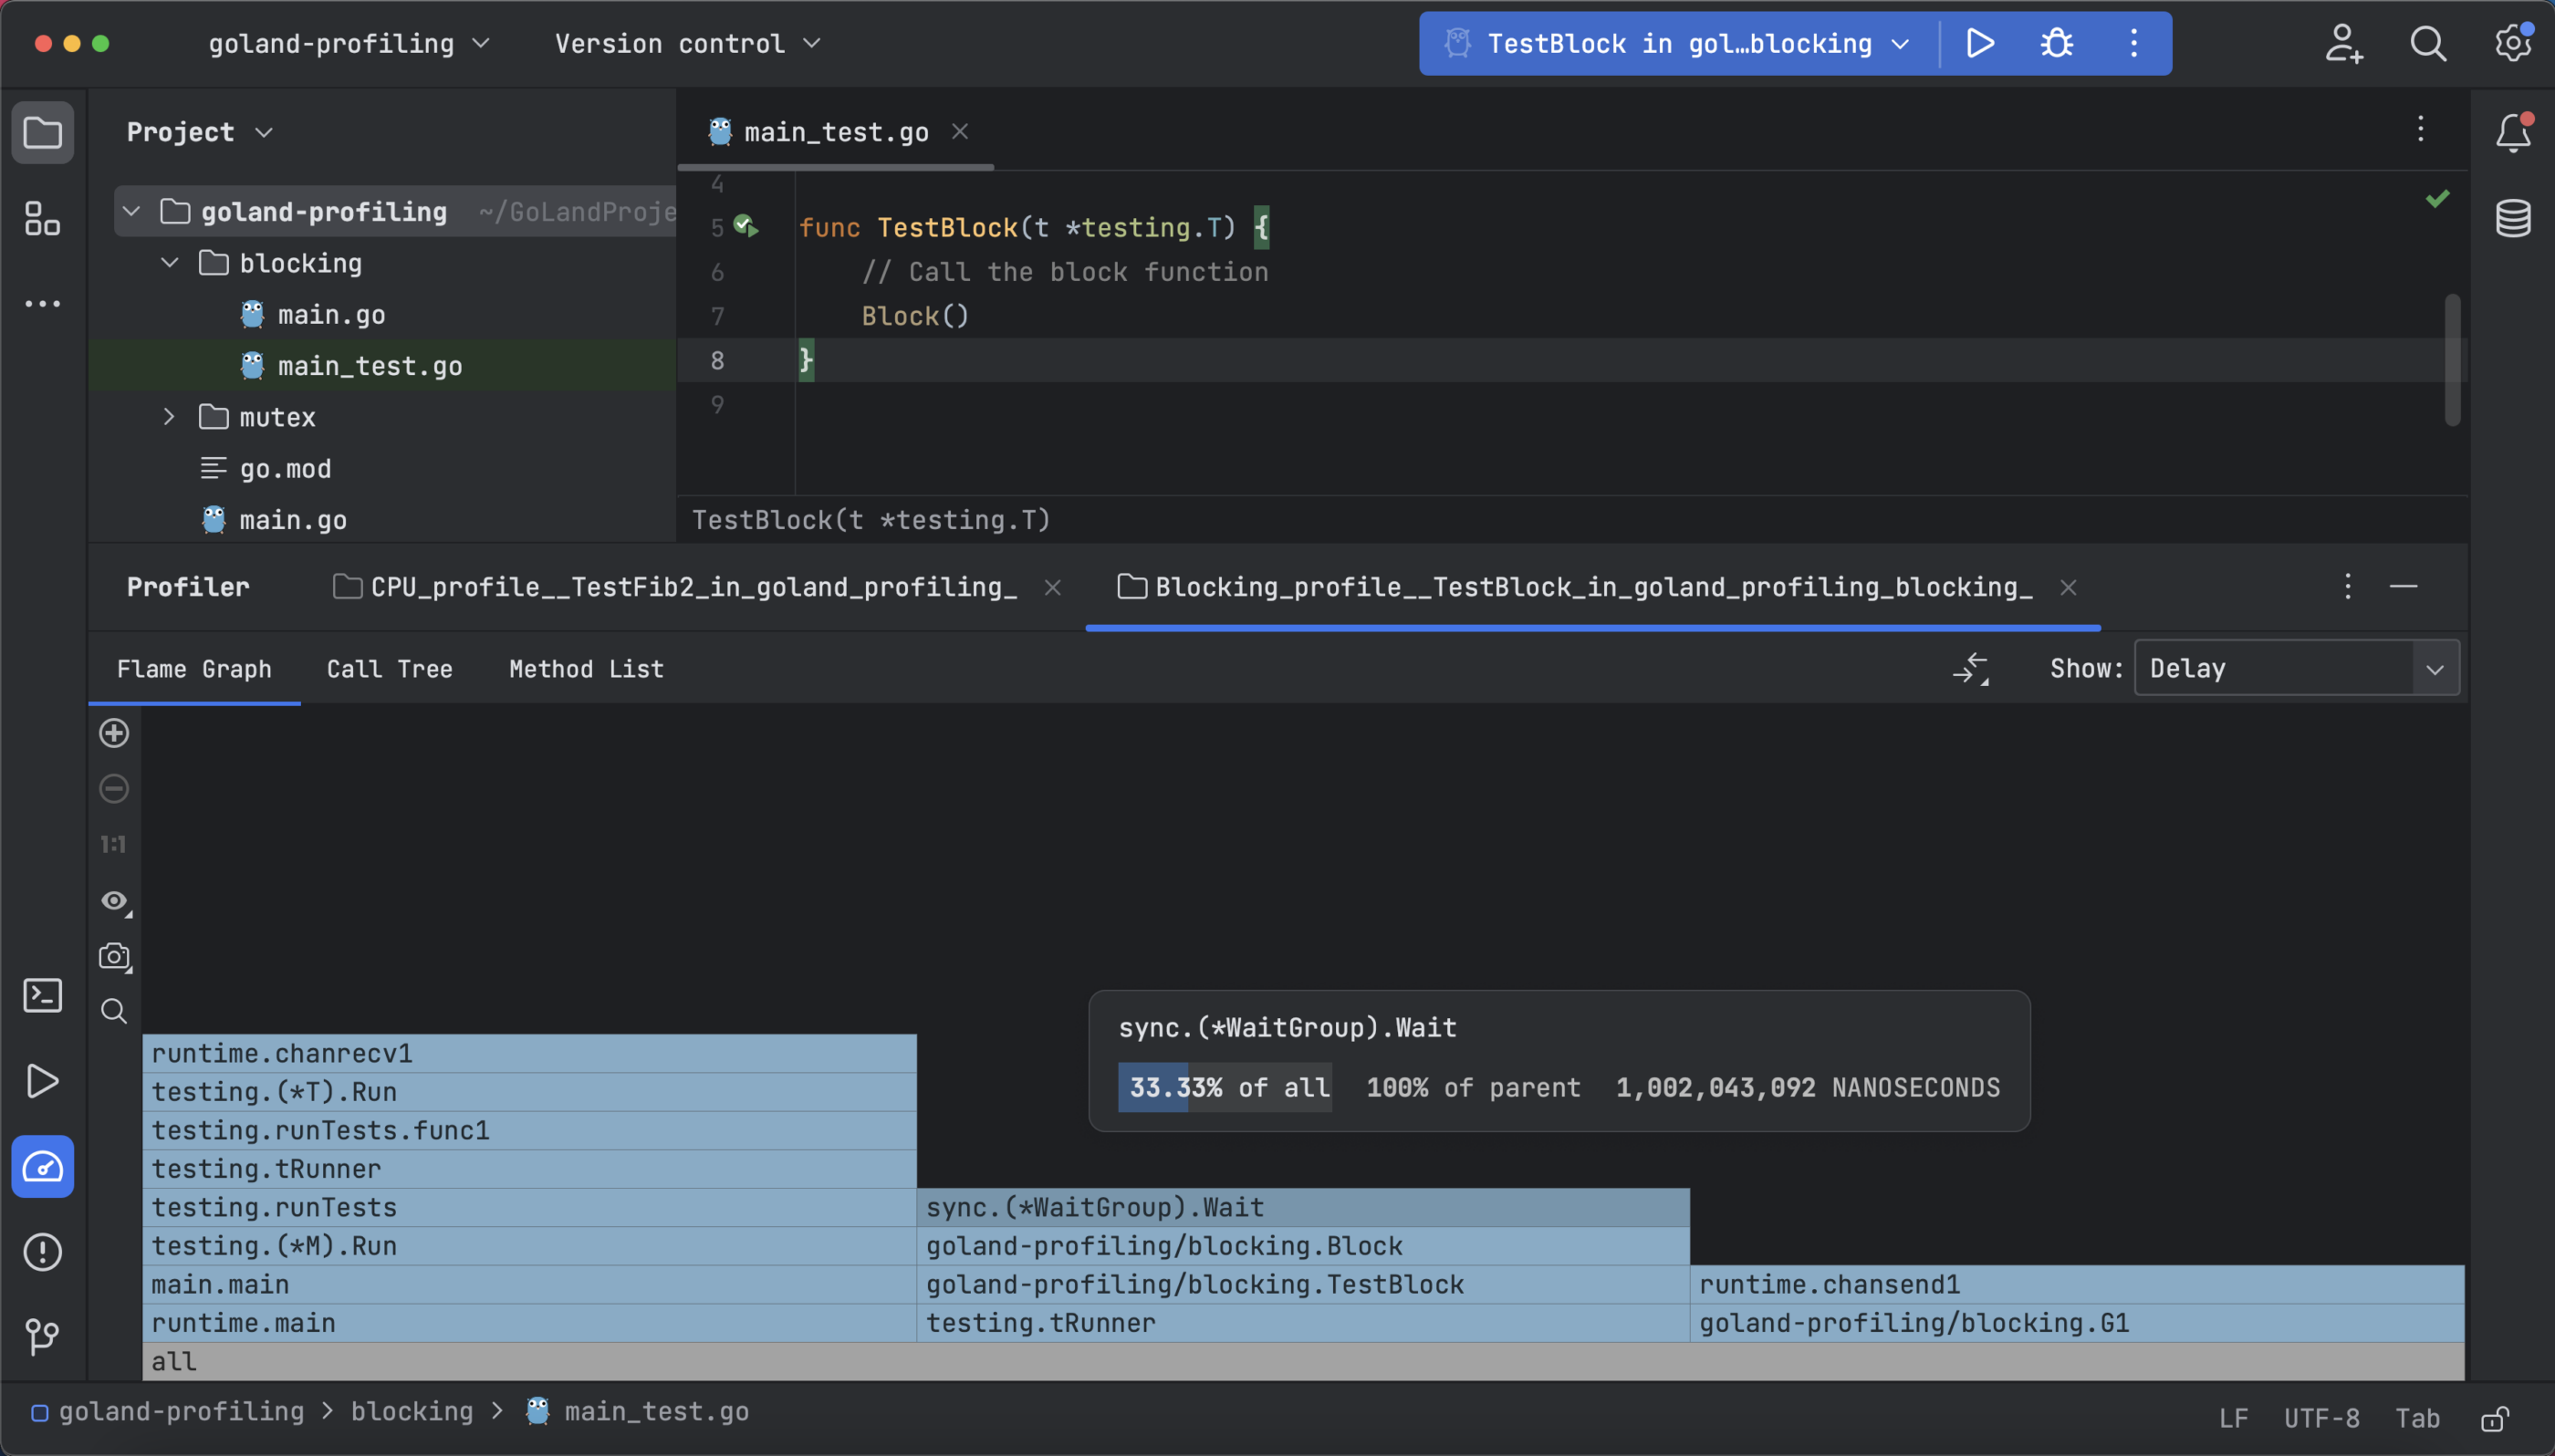
The method list shows the number of contentions and the call tree shows contentions with delays in each function, depending on if you have Delay or Contentions selected.
Mutex Profiler
You can use the mutex profiler to analyze concurrent code and see fractions of stack traces for goroutines that have concurrent mutexes to understand what’s blocking the threads.
The mutex profiler also has three types of data representation. To generate the profile, you can use the following sample:
package main

import (
    "sync"
    "time"
)

func Mutx(s int) int {
    var mu sync.Mutex
    wg := sync.WaitGroup{}
    wg.Add(1000 * 1000)
    // Launching 1,000,000 goroutines
    for i := 0; i < 1000*1000; i++ {
        go func(i int) {
            // Locking the mutex
            mu.Lock()
            // Unlocking the mutex
            defer mu.Unlock()
            defer wg.Done()
            s++
        }(i)
    }
    wg.Wait()
    return s
}
In the above code, a million goroutines are launched and they all try to increment a shared variable s by 1. For this, you create a mutex and lock it before incrementing the variable. After incrementing the variable, you unlock the mutex. A WaitGroup is set to wait for all goroutines to finish execution.
Use the following test to check the Mutx function:
package main

import "testing"

func TestMutx(t *testing.T) {
    result := Mutx(4)
    t.Logf("%d", result)
}
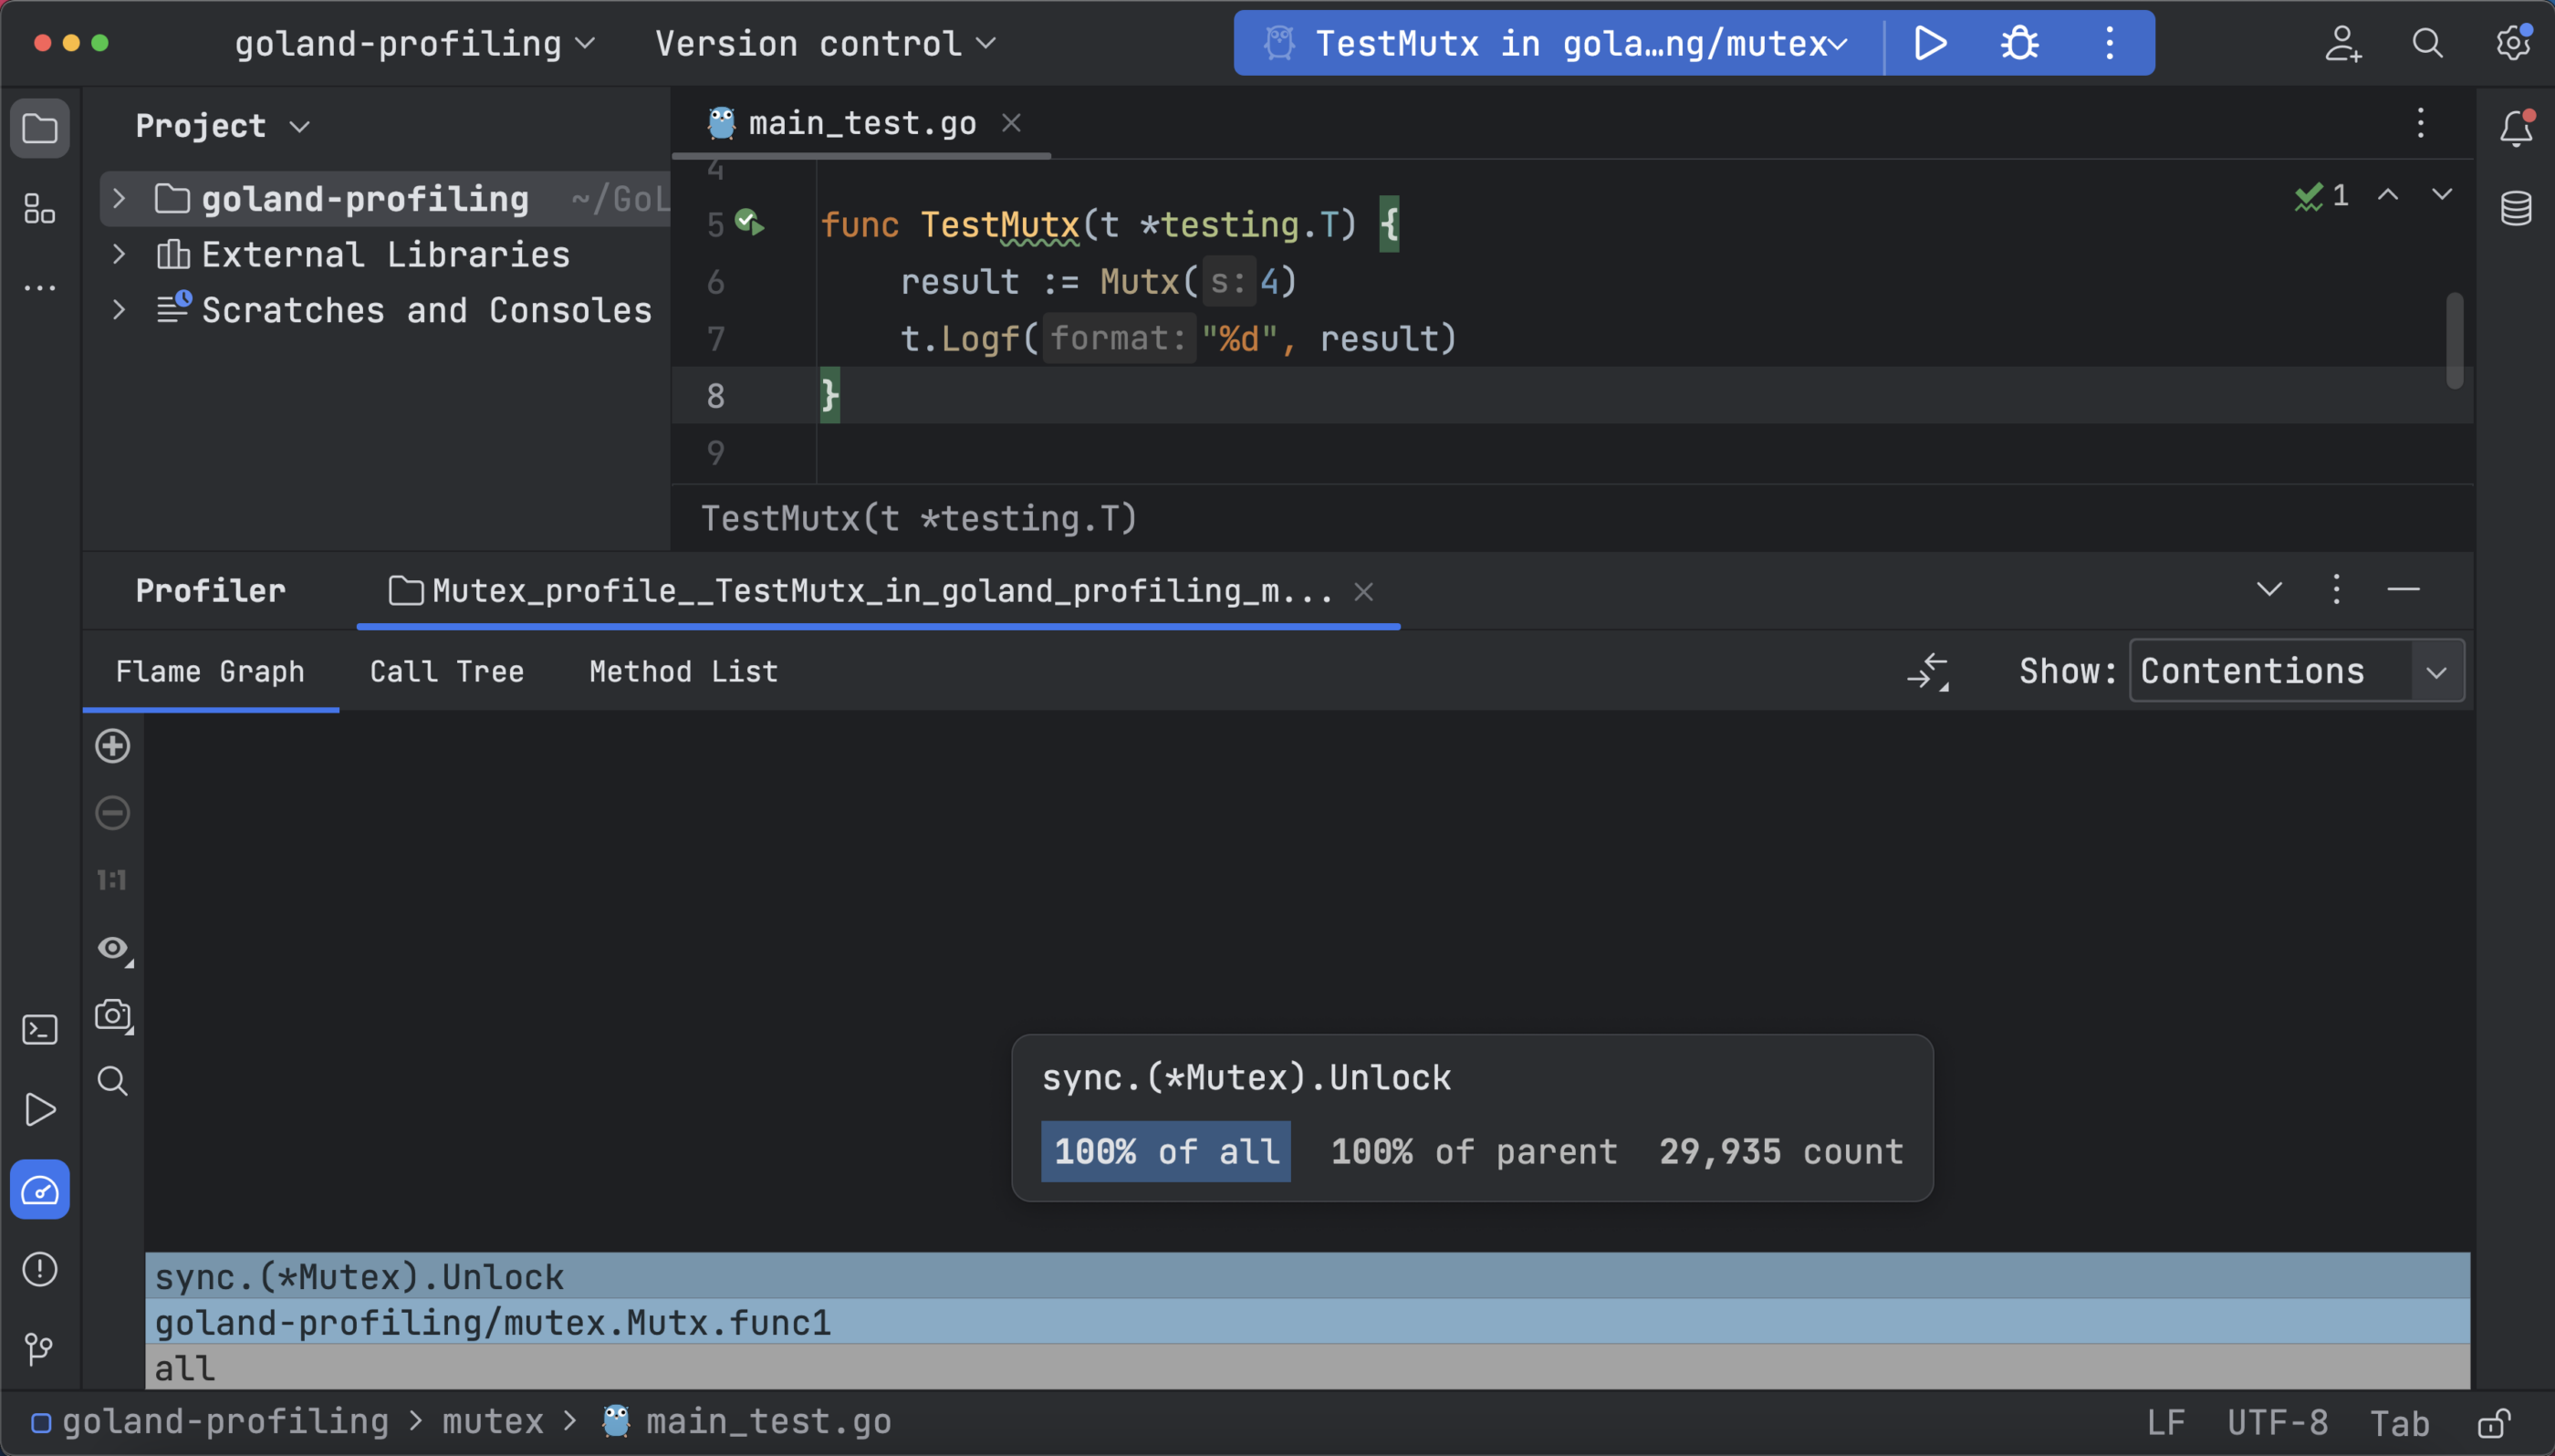
To run this profiler, open your _test.go file, then click the Run icon in the gutter area and select Profile with ‘Mutex Profiler’. The flame graph shows the number of delays or the amount of time waiting, depending on whether you’ve selected Contentions or Delay.
Final Thoughts
Profiling is an essential software optimization technique, and it’s worth learning the basics to boost your efficiency. Tools like GoLand can make the process more effective and straightforward. One thing to remember is that profiling is only a tool to help you understand your code. All of the real work is still on your end – you can check if your code is efficient and performant with the help of the CPU, memory, mutex, and blocking profilers, but if you identify any shortfalls, it’s up to you to fix them.
To learn more about profiling and performance in Go, check out the official docs.