ReSharper C++
The Visual Studio Extension for C++ Development
What’s New in ReSharper C++ 2018.1

We are pleased to introduce ReSharper C++ 2018.1, our first major update this year!
This release comes with two new important features. First, Debug Step Filters lets you avoid stepping into specific functions during debugging. Second, Includes Analyzer helps investigate the dependencies between header files that affect build times. Read on for more details about these features and other highlights of the 2018.1 release:
- Debug step filters
- Includes analyzer
- Navigation improvements
- Command-line code cleanup
- Code inspections
- More ways to configure inspection severity
- Clang-Tidy integration updates
- Other changes
Debug step filters
ReSharper C++ 2017.3 was the first release to add debugging-assistance features — inline values, searchable DataTips, and breakpoint navigation. ReSharper C++ 2018.1 delivers Debug Step Filters, a brand new feature which lets you control stepping behavior during a debugging session.
When you invoke Step Into, the Visual Studio debugger will normally step into all the functions that are called from the current statement. However, there are functions (like simple getters, setters, or dereference operators), which are either trivial or so well tested that you never want to step into them. This is where step filters come in: with this feature, you can specify the functions that should always be stepped over.
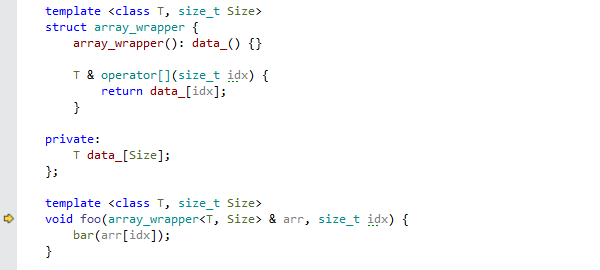
A step filter is defined by a regular expression, which is matched against the name of the function that the debugger is stepping into. You can inspect, configure, disable, or enable back step filters on the Tools | Debugging | C++ options page, which lists all the available filters.
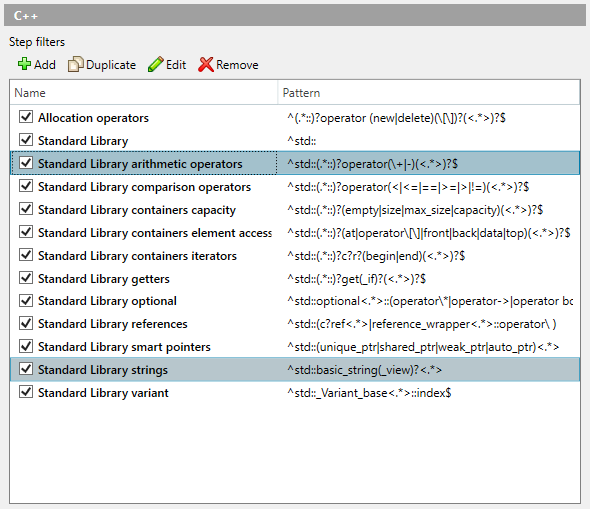
ReSharper C++ comes with a predefined collection of step filters for the standard library, but you can easily add your own. You can come up with a custom regular expression that matches the names of functions to step over and manually add a filter from the options page. Or you can have ReSharper C++ automatically create one during a debugging session.
When you step into a function and decide that you want to step over it in the future, you can use a context action to quickly add a new step filter. For template functions, there are separate context actions to add either only the current instantiation of the function template or all of its instantiations. If a matching filter has already been added to the list but was temporarily disabled, a context action will be available to enable it back.
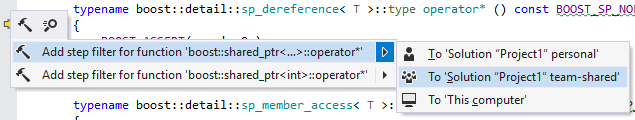
The filters are stored using ReSharper’s layered settings. By default, the action to add a new filter follows the Smart Save logic, but you can use the action’s submenu to choose the layer to which the filter should be saved to. For example, you can use the Solution team-shared layer to make the new filter available to your teammates.
You might remember that Visual Studio has a built-in way to customize stepping behavior in C++, which is a part of C++ Just My Code. However, no user interface is provided for configuring this feature from the IDE, so you need to manually edit .natstepfilter XML configuration files to change existing or add new rules. Furthermore, there is no way to add solution-specific rules, since the configuration files are global. Please note that at the moment Visual Studio’s support for .natstepfilter files gets disabled if ReSharper C++ is installed.
Includes analyzer
Long build times is one of the biggest problems in large real-world C++ projects. ReSharper C++ already has a few tricks up its sleeve to aid you. For example, it will mark unused #include directives or automatically create forward declarations for unresolved names instead of simply including the headers with the required declarations.
ReSharper C++ 2018.1 introduces Includes Analyzer, a brand new code inspection tool that helps you speed up the compilation process.
Includes Analyzer is meant to help you locate and eliminate unnecessary header dependencies. A typical project might contain many thousands of #include directives, and it’s not clear which of them are worth investigating. Includes Analyzer attempts to estimate the contribution of each header file to the build time, based on the number of lines of code that it adds to the total compilation workload. While this is not a precise metric, it’s a useful starting criterion which can help you find and prioritize the most included header files.
After you identify the header dependencies that potentially have the biggest impact, you can try getting rid of them one by one via the standard approaches. These include: using forward declarations wherever possible, removing unneeded #include directives, applying the Pimpl idiom, splitting header files into smaller ones, and so on.
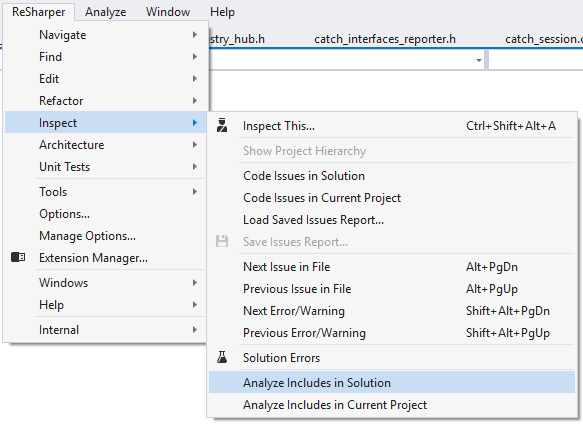
To start the analysis, invoke one of the ReSharper | Inspect | Analyze Includes in… actions from the main menu, or select Analyze Includes from the Solution Explorer context menu.
ReSharper C++ will analyze the files in the given scope and present a report in a dedicated tool window, where you can explore the dependencies between the files. The Includes analysis window provides two separate views, Includees and Includers, both of which present include dependencies as a tree where each node corresponds to a file. You can switch between the views via the corresponding toolbar buttons, or by navigating to the same file in the other view from the context menu.
The Includees view helps you understand how many lines of code the header file in a top-level tree node contributes to all source files that directly or indirectly include it. Child nodes in this view represent files that include the file from the parent node. Consider the following analysis of the entire Catch2 solution:
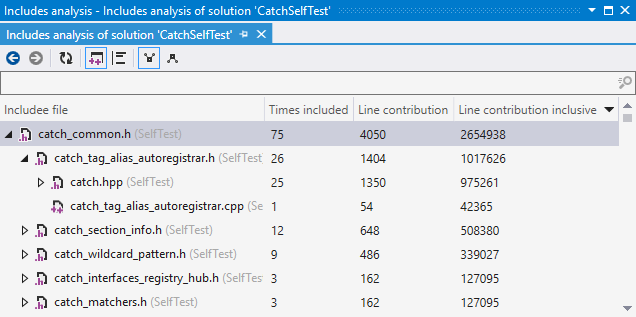
There are three metrics for each node in the tree:
- Times included shows how many source files include the header in the top-level node through the path to the current node. In the example above,
catch_common.hwas included into 75 source files in total, of which 26 includedcatch_common.hthrough the#include "catch_common.h"directive incatch_tag_alias_autoregistrar.h. - Line contribution shows how many lines of code the header in the top-level node contributed through the path to the current node by itself, without transitively included files.
catch_common.hcontributed 4,050 lines of code in total, which is 75 (the number of source files that include it) times 54 (the number of lines of code in the file). Out of 4,050 in total, 1,404 lines were contributed because of#include "catch_common.h"incatch_tag_alias_autoregistrar.h. - Line contribution inclusive is similar to Line contribution, but this metric takes into account all headers transitively included into the file in the top-level node. E.g.
catch_common.h, together with the headers included into it, contributes 2,654,938 lines in total during compilation of the entire solution. 1,017,626 of those lines were contributed because of#include "catch_common.h"incatch_tag_alias_autoregistrar.h. Line contribution inclusive is the default and arguably the most useful sorting criteria.
The Includers view is similar to the Includees view, but acts in the opposite way: the child nodes inside the tree represent files which are included into the file from the parent node.
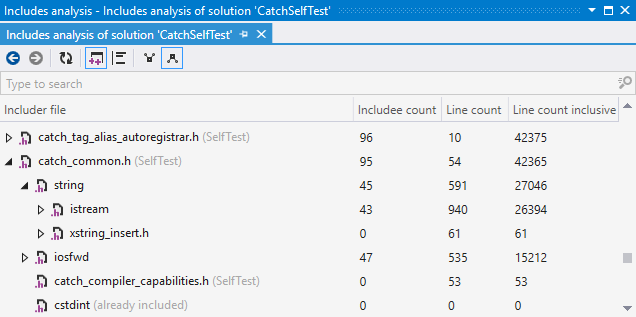
This view shows how many lines of code are transitively included into the file in a top-level node as if it was compiled as a standalone source file (e.g. catch_common.h together with all headers included into it comprises 42,365 lines of code, of which 27,046 were brought with #include <string>). The metrics that this view provides are Includee count (the number of included files), Line count (the size of the file itself), and Line count inclusive (the size of the file with all the header files it includes).
One important limitation of Includes Analyzer is that ReSharper C++ does not actually run a full preprocessing stage in order to speed up the analysis process. This means that the line count does not in fact include the results of macro expansions, and that include guards do not get handled as well. Instead, ReSharper C++ assumes that each header file starts with an include guard or a #pragma once directive, and gets included at most once in any source file. Each successive include of the same header does not count towards its number of contributed lines, which means that sometimes you may encounter Times included and other metrics equal to zero next to an internal tree node.
In addition to navigation controls and the refresh button, the toolbar in the Includes analysis window lets you change two options:
- Show only root nodes belonging to some project will hide top-level tree nodes that correspond to files not belonging to any project. This is a quick way to filter out library files if you want to concentrate only on headers inside your solution.
- By default, ReSharper C++ skips blank lines and comments during an analysis. The Count blank and comment lines button lets you change this behavior.
Watch Includes Analyzer in action by the link.
We would like to give a shout-out to Header Hero, which inspired our own implementation of the same underlying idea. Check out the Caring by Sharing: Header Hero blog post, which introduces this great little tool and gives a few tips for improving project build times.
Navigation improvements
ReSharper C++ 2018.1’s biggest navigation update is the redesigned Go to File Member (Alt+\) dialog.
We have updated the dialog in several ways:
- Class members in the open file are now grouped by their containing class in the results list.
- With no search string active, file members are sorted in the order of their declarations inside the file.
- The scrolling list with the results accommodates more items.
Together, these updates make the dialog more usable as they provide clearer insight into the structure of the current file.
In all Go to dialogs and several other places, ReSharper C++ now attempts to shorten symbol names that are excessively long, by omitting function and template parameters.
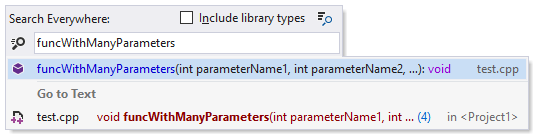
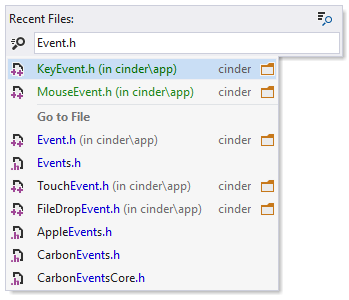
When you perform a search using the Recent Files dialog (Ctrl+,), Go to File search results are also appended to the results list after the Recent File items.
Finally, the option to remember the last search in the Search Everywhere dialog is now on by default. You can revert to the old behavior through the Environment | Search & Navigation | Remember last search setting.
Command-line code cleanup
ReSharper Command Line Tools, a free standalone collection of tools that can be used from the command line or as part of the continuous integration process, can now perform code formatting and cleanup in C++ projects. This instantly eliminates code style violations in a project or solution, and helps ensure a uniform code base.
To run the code cleanup tool on your solution, invoke cleanupcode.x86.exe from the command-line tools distribution with the path to the solution file. It will automatically reformat your code, fix common code style violations, remove redundant code, and optionally apply Clang-Tidy fix-its.
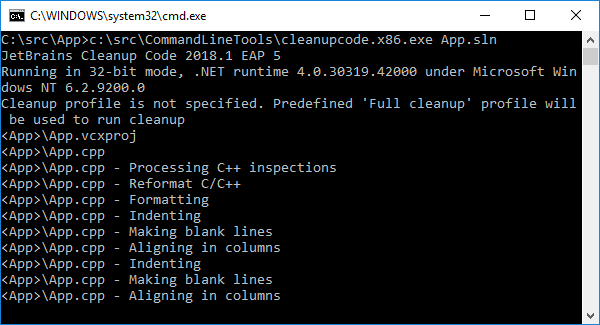
By default, command-line tools will use the predefined Full Cleanup profile, which includes the formatting stage and most (though not all) fixes for common code style issues, but skips the Clang-Tidy analysis stage. The other built-in profile is Reformat Code, which will apply only code formatting preferences. To use it, pass the profile name via the --profile command-line argument of cleanupcode.x86.exe
cleanupcode.x86.exe --profile="Built-in: Reformat Code" YourSolution.sln
You can also create a custom code cleanup profile. See our previous blog post entitled Code Cleanup with the ReSharper Command Line Tools for instructions on how to do this and more details about using cleanupcode.x86.exe.
ReSharper 2018.1 also fixes bogus errors which were output by the InspectCode tool on x64 projects. In addition, the upcoming 2018.1 release of TeamCity is able to run InspectCode on C++ projects (see TW-48978 for details).
Code inspections
ReSharper C++ 2018.1 adds several new built-in inspections:
- A new inspection (with a corresponding fix and a code cleanup item) suggests replacing
ifstatements withif constexprwhen the condition is a compile-time constant expression.

- Attempted usages of deleted functions are now diagnosed as errors, including usages via implicit function calls.

- A new inspection warns about overriding destructors without the
overridespecifier. There’s still debate in the C++ community whether destructors should ever be marked withoverride(for example, C++ Core Guidelines recommend against doing that), so the inspection is turned off by default. If you wish to use this inspection, please enable it on the Code Inspection | Inspection Severity options page.

Control flow and usage checking analyses have been updated to handle lambdas. This means that all the related inspections (unused variables and function parameters, unreachable code, redundant jumps, and many others), that previously worked only with functions, are also now available inside lambda bodies.
Finally, a minor change fixes the interaction between the Declarator is never used inspection and C++17 structured binding declarations. Previously, ReSharper C++ warned you about each unused structured binding separately from all the other bindings in the same declaration. We’ve changed this behavior so that if at least one of the structured bindings is used, the inspection does not trigger on any of the bindings.
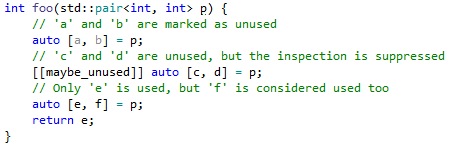
Now all the major C++ compilers follow this logic, including MSVC starting with the update shipped in Visual Studio 15.7. If none of the bindings are used, you can still use the [[maybe_unused]] attribute to silence the inspection, but in practice you probably won’t ever need to.
More ways to configure inspection severity
In previous ReSharper C++ releases, inspection severity could only be set for the entire solution. But it is often required to be able to configure severity settings independently in different parts of the codebase, for example in legacy or test projects. In ReSharper С++ 2018.1, you can optionally enable the ability to have separate severity settings via the Read settings from EditorConfig and project settings option on the Code Inspection | Settings | General options page.
With this option turned on, you can set custom inspection severity using one of two approaches:
- EditorConfig files. ReSharper C++ inspection severity can be specified inside an EditorConfig file using
resharper_[severity id]_highlightingproperties, where[severity id]is the name of the severity spelled in lower case with underscores. Depending on your needs, you can assign any value ofdo_not_show,hint,suggestion,warningorerrorto the property.[*] resharper_cpp_overriding_function_without_override_specifier_highlighting = error resharper_cpp_local_variable_may_be_const_highlighting = hint [*_test.cpp] resharper_cpp_declarator_never_used_highlighting = do_not_show
Please refer to the Index of EditorConfig properties web help page for the list of all EditorConfig properties that ReSharper C++ recognizes.
EditorConfig supports wildcard patterns in filenames, which means that inspection severity can be set independently even for specific files. A previous blog post entitled Configuring inspection severity with EditorConfig goes into more detail about using EditorConfig files, but do remember that you need to enable the option Code Editing | General Formatter Style | Enable EditorConfig support in order to have EditorConfig available.
- Per-project DotSettings layers. If you do not want to use EditorConfig files, you can rely on ReSharper layered settings instead and create a project-level settings layer. Unfortunately, ReSharper C++ still does not include a dedicated UI for managing per-project DotSettings, but you can consult the Per Project Settings or How to have different naming styles for my test project blog post for instructions on how to create a project-specific settings file.
Please note that enabling granular inspection severity might have a noticeable performance impact on the speed of code analysis, depending on your configuration and the number of issues in a given file.
Clang-Tidy integration updates
Clang 6.0 was released this March. To keep up, we have updated the Clang-Tidy binary bundled with ReSharper C++, with several user-visible changes:
- The following checks have changed their prefix from misc- to bugprone-: misc-argument-comment, misc-assert-side-effect, misc-bool-pointer-implicit-conversion, misc-dangling-handle, misc-fold-init-type, misc-forward-declaration-namespace, misc-inaccurate-erase, misc-move-forwarding-reference, misc-multiple-statement-macro, misc-string-constructor, misc-use-after-move, misc-virtual-near-miss.
- The following checks have changed their prefix from misc- to performance-: misc-inefficient-algorithm, misc-move-const-arg, misc-move-constructor-init, misc-noexcept-move-constructor.
- The following new checks have been added: bugprone-copy-constructor-init, bugprone-misplaced-operator-in-strlen-in-alloc, fuchsia-default-arguments, fuchsia-overloaded-operator, fuchsia-virtual-inheritance.
Another new Clang-Tidy feature from the 6.0 release is the extended syntax of the NOLINT comment, which now accepts an optional list of check names to silence. ReSharper C++ adds a new inspection action that utilizes the new syntax and lets you disable a specific Clang-Tidy diagnostic on the current line:
We have also received several reports of Clang-Tidy crashes, with Windows displaying crash notifications as a result. While the ReSharper C++ team cannot fix the crashes themselves, we have changed the default error reporting mode used by the clang-tidy binary to prevent the annoying message boxes.
Other changes
Unit testing support includes two minor updates:
- ReSharper C++ 2018.1.1 fixes compatibility with Boost.Test from Boost 1.67 (which was broken because of a bug in Boost.Test).
- The new setting Tools | Unit Testing | C++ Tests | Use command-line arguments… lets you manage whether ReSharper C++ should use the value of the Debugging | Local Windows Debugger | Command Arguments project property when running unit tests.
Other changes to ReSharper C++ include:
- The
#include_nextpreprocessor directive is now supported, for better compatibility with compilers that implement this GNU extension. - Typing assistance in C++ files automatically removes trailing whitespaces on Enter in order to keep your code clean of redundant whitespaces.
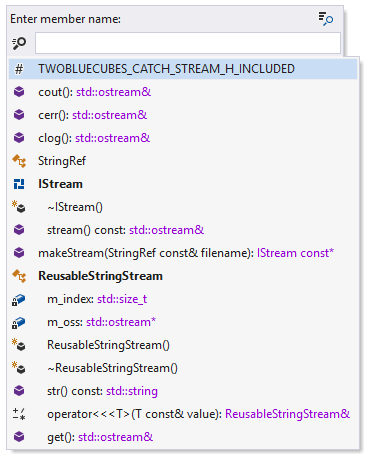
- If you select an expression and open the Quick Documentation window, it will show various information about the selected expression, such as its type, value, and value category. You can use this ability, for example, to quickly evaluate a type trait for a specific type:

- The
/Y-(ignore precompiled header options) and/Zc:__cplusplus(enable the updated value of the__cplusplusmacro) command-line MSVC compiler arguments are supported. - The performance of the completion pop-up and start-up time have been improved in several cases.
- Close to two hundred issues have been resolved.
If you’d like to learn more about how C++ tools can improve your development workflow, Anastasia Kazakova (C++ tools PMM at JetBrains) recently gave a talk at the ACCU 2018 conference entitled Debug C++ Without Running. In her talk, Anastasia discusses a few peculiarities of the C++ language that contribute to its notorious complexity and demonstrates some helpful features from ReSharper C++, CLion, and other C++ tools.
As usual, please share your feedback with us and report issues either in the issue tracker or on the support forum.