Scala Plugin
Scala Plugin for IntelliJ IDEA and Android Studio
Performance tips for IntelliJ Scala Plugin

A full-blown IDE is one of the most complicated applications you can find on an average laptop. This is why we – the Scala plugin team at JetBrains – from time to time receive reports that our product lags in certain situations or works slowly in general. In some of these cases we can help, but in others – for example, when your codebase is big and complicated, or when your machine is old – there is not much we can do. Instead, there are some things you can try yourself to improve your IntelliJ IDEA and the Scala plugin experience, like implementing configuration tweaks and maintaining good coding practices. We will quickly go through some of them.
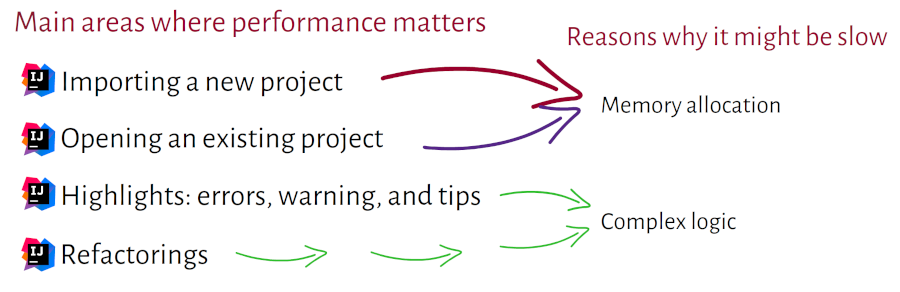
First, let’s talk about two main areas of IntelliJ IDEA where performance matters:
- One important moment is when we create or open a project. This one involves memory management.
- The second one relates to complex logic, meaning the CPU-heavy operations when the Scala plugin tries to identify and highlight errors and warnings or display tips on how to improve the code, and also when you perform one of the actions provided by the Scala plugin and have a large portion of your code edited automatically.
In both cases, we can improve performance in similar ways. We can:
- give IntelliJ IDEA more resources,
- disable inspections we don’t use,
- improve our coding practices,
- and disable some of the features.
Resources
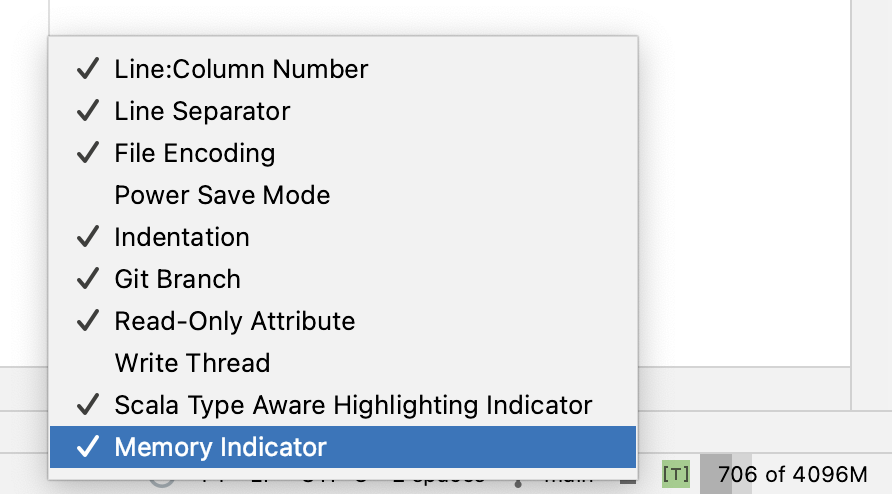
Let’s start with resources, which in this case basically means providing more memory. However, before you do that, I’d suggest you enable the memory indicator. You can do this by right-clicking on the bottom panel of IntelliJ IDEA and then, when the menu pops up, clicking on that memory indicator line there. It will tell you how much memory your IntelliJ IDEA actually uses, and you will be able to set the memory size accordingly.
An average laptop today has 8 gigabytes of RAM or more, which generally should be enough for IntelliJ IDEA, your other applications, and the operating system to all perform well.
After you check your IntelliJ IDEA memory consumption, open the idea.vmoptions file – you can do so by opening the Help menu and choosing Edit Custom VM Options – and change the -Xmx setting to a value slightly bigger than what the memory indicator showed you. Please note that over a certain value, increasing -Xmx won’t improve the performance anymore. In my case, increasing it to 4 gigabytes had some effect, but beyond that the additional improvement was negligible.
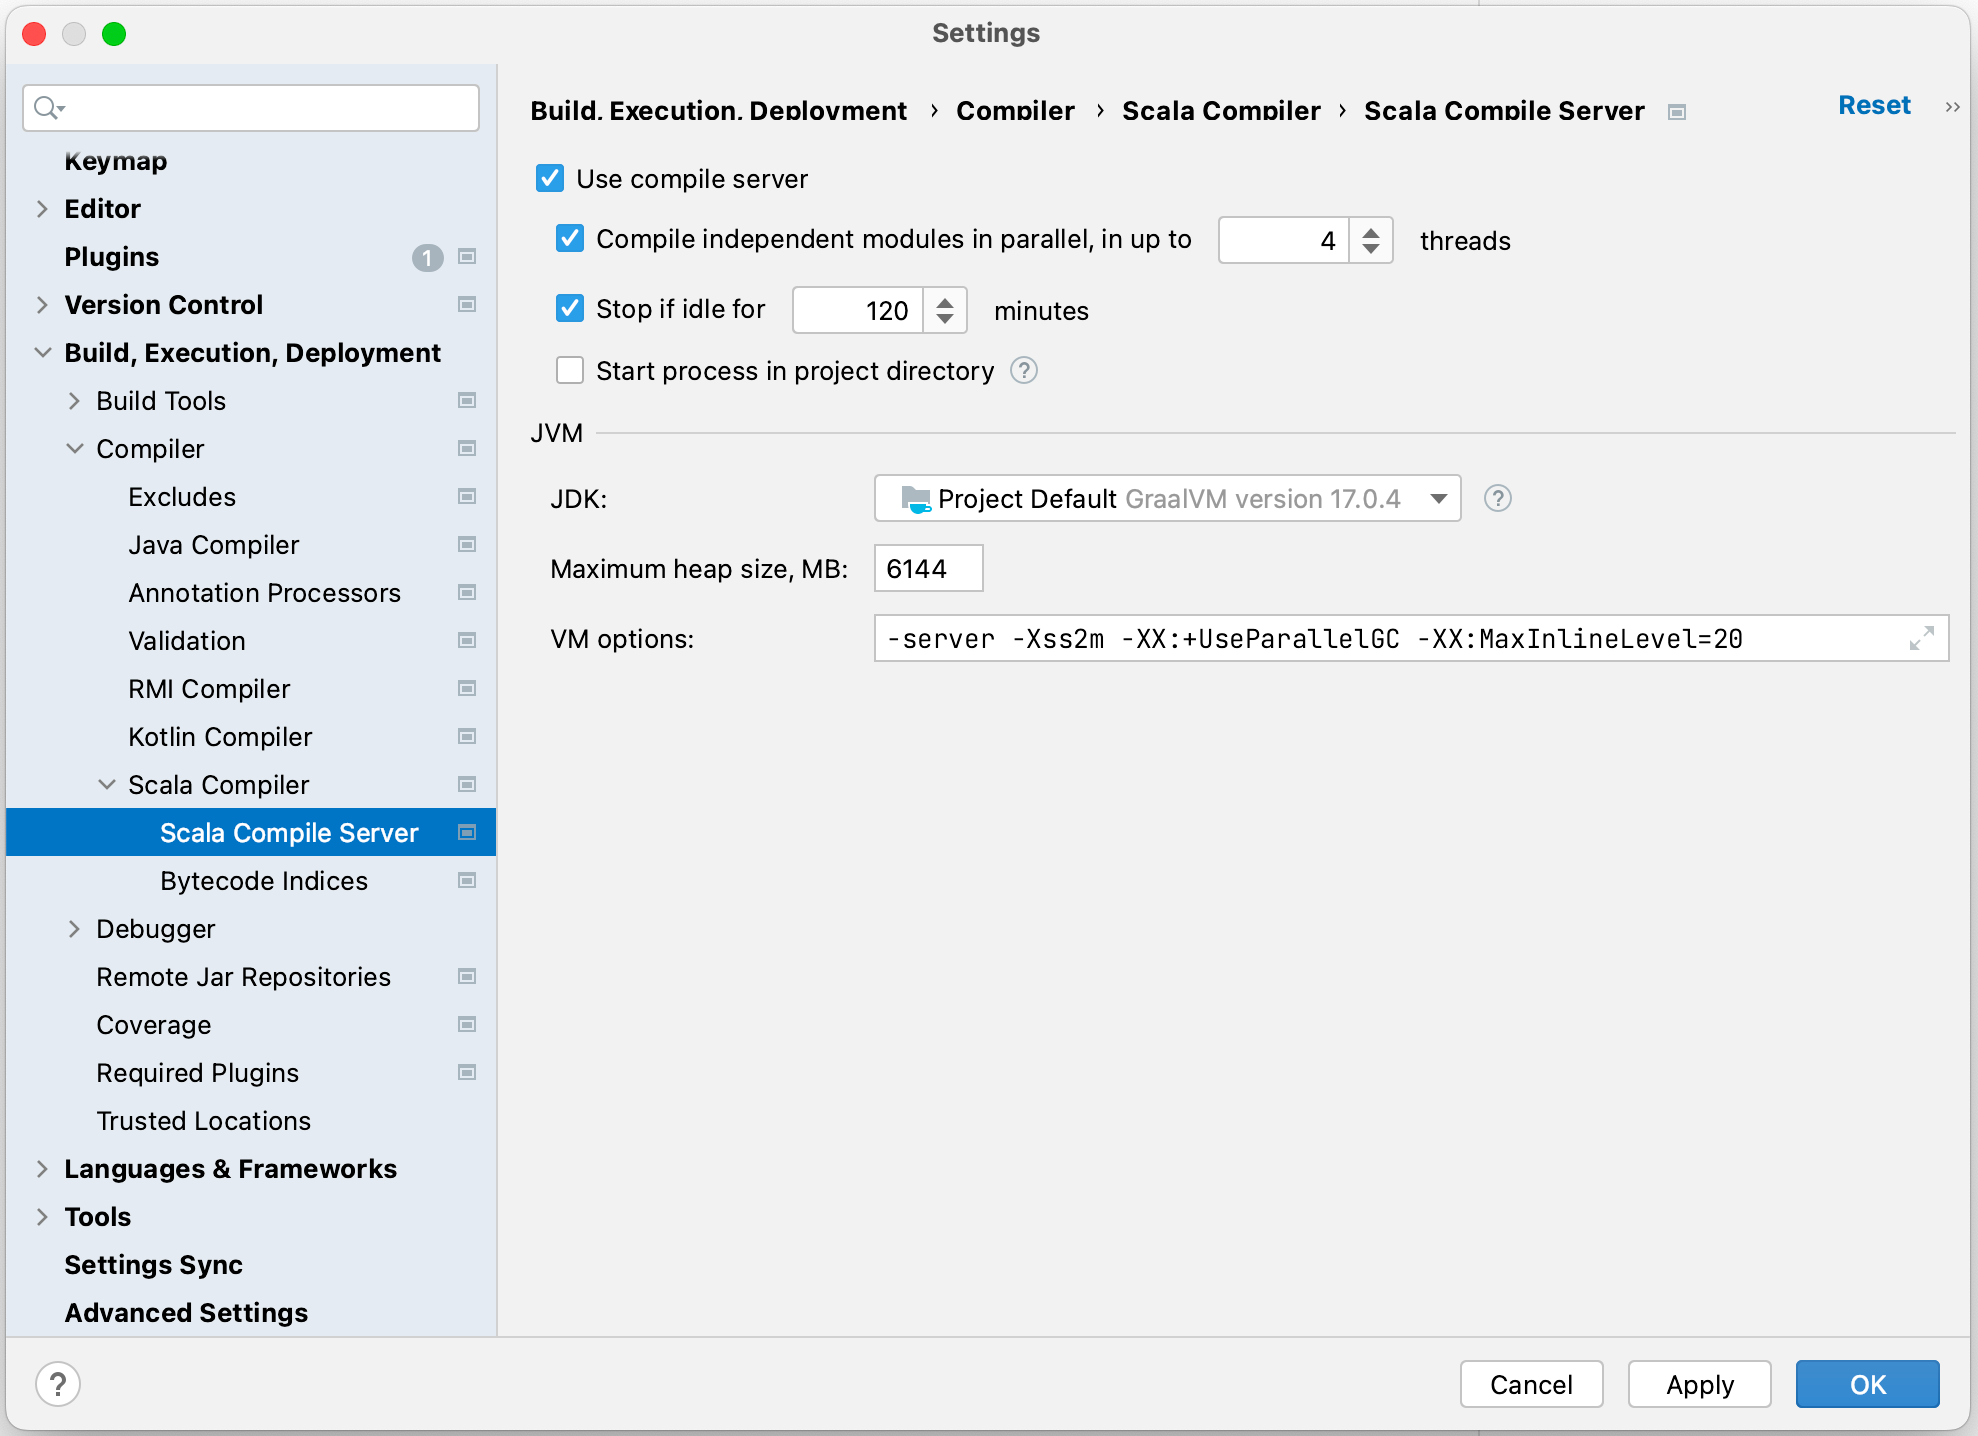
In the case of the Scala plugin, increasing available memory may also speed up compilation if you decide to compile your app from within IntelliJ IDEA. To do that, go to Settings | Build, Execution and Deployment | Scala Compiler Server, and modify the VM options there.
Inspections
Moving to the CPU side, one of the most important features of the Scala plugin – and one that can use a lot of CPU – is its set of inspections. An inspection is a piece of logic that, well, inspects your code, looking for a specific type of problem. Some of the problems are very simple, like a private variable that is never modified and so can be replaced with an immutable value. Others, like an unused public field, may take a long time to investigate.
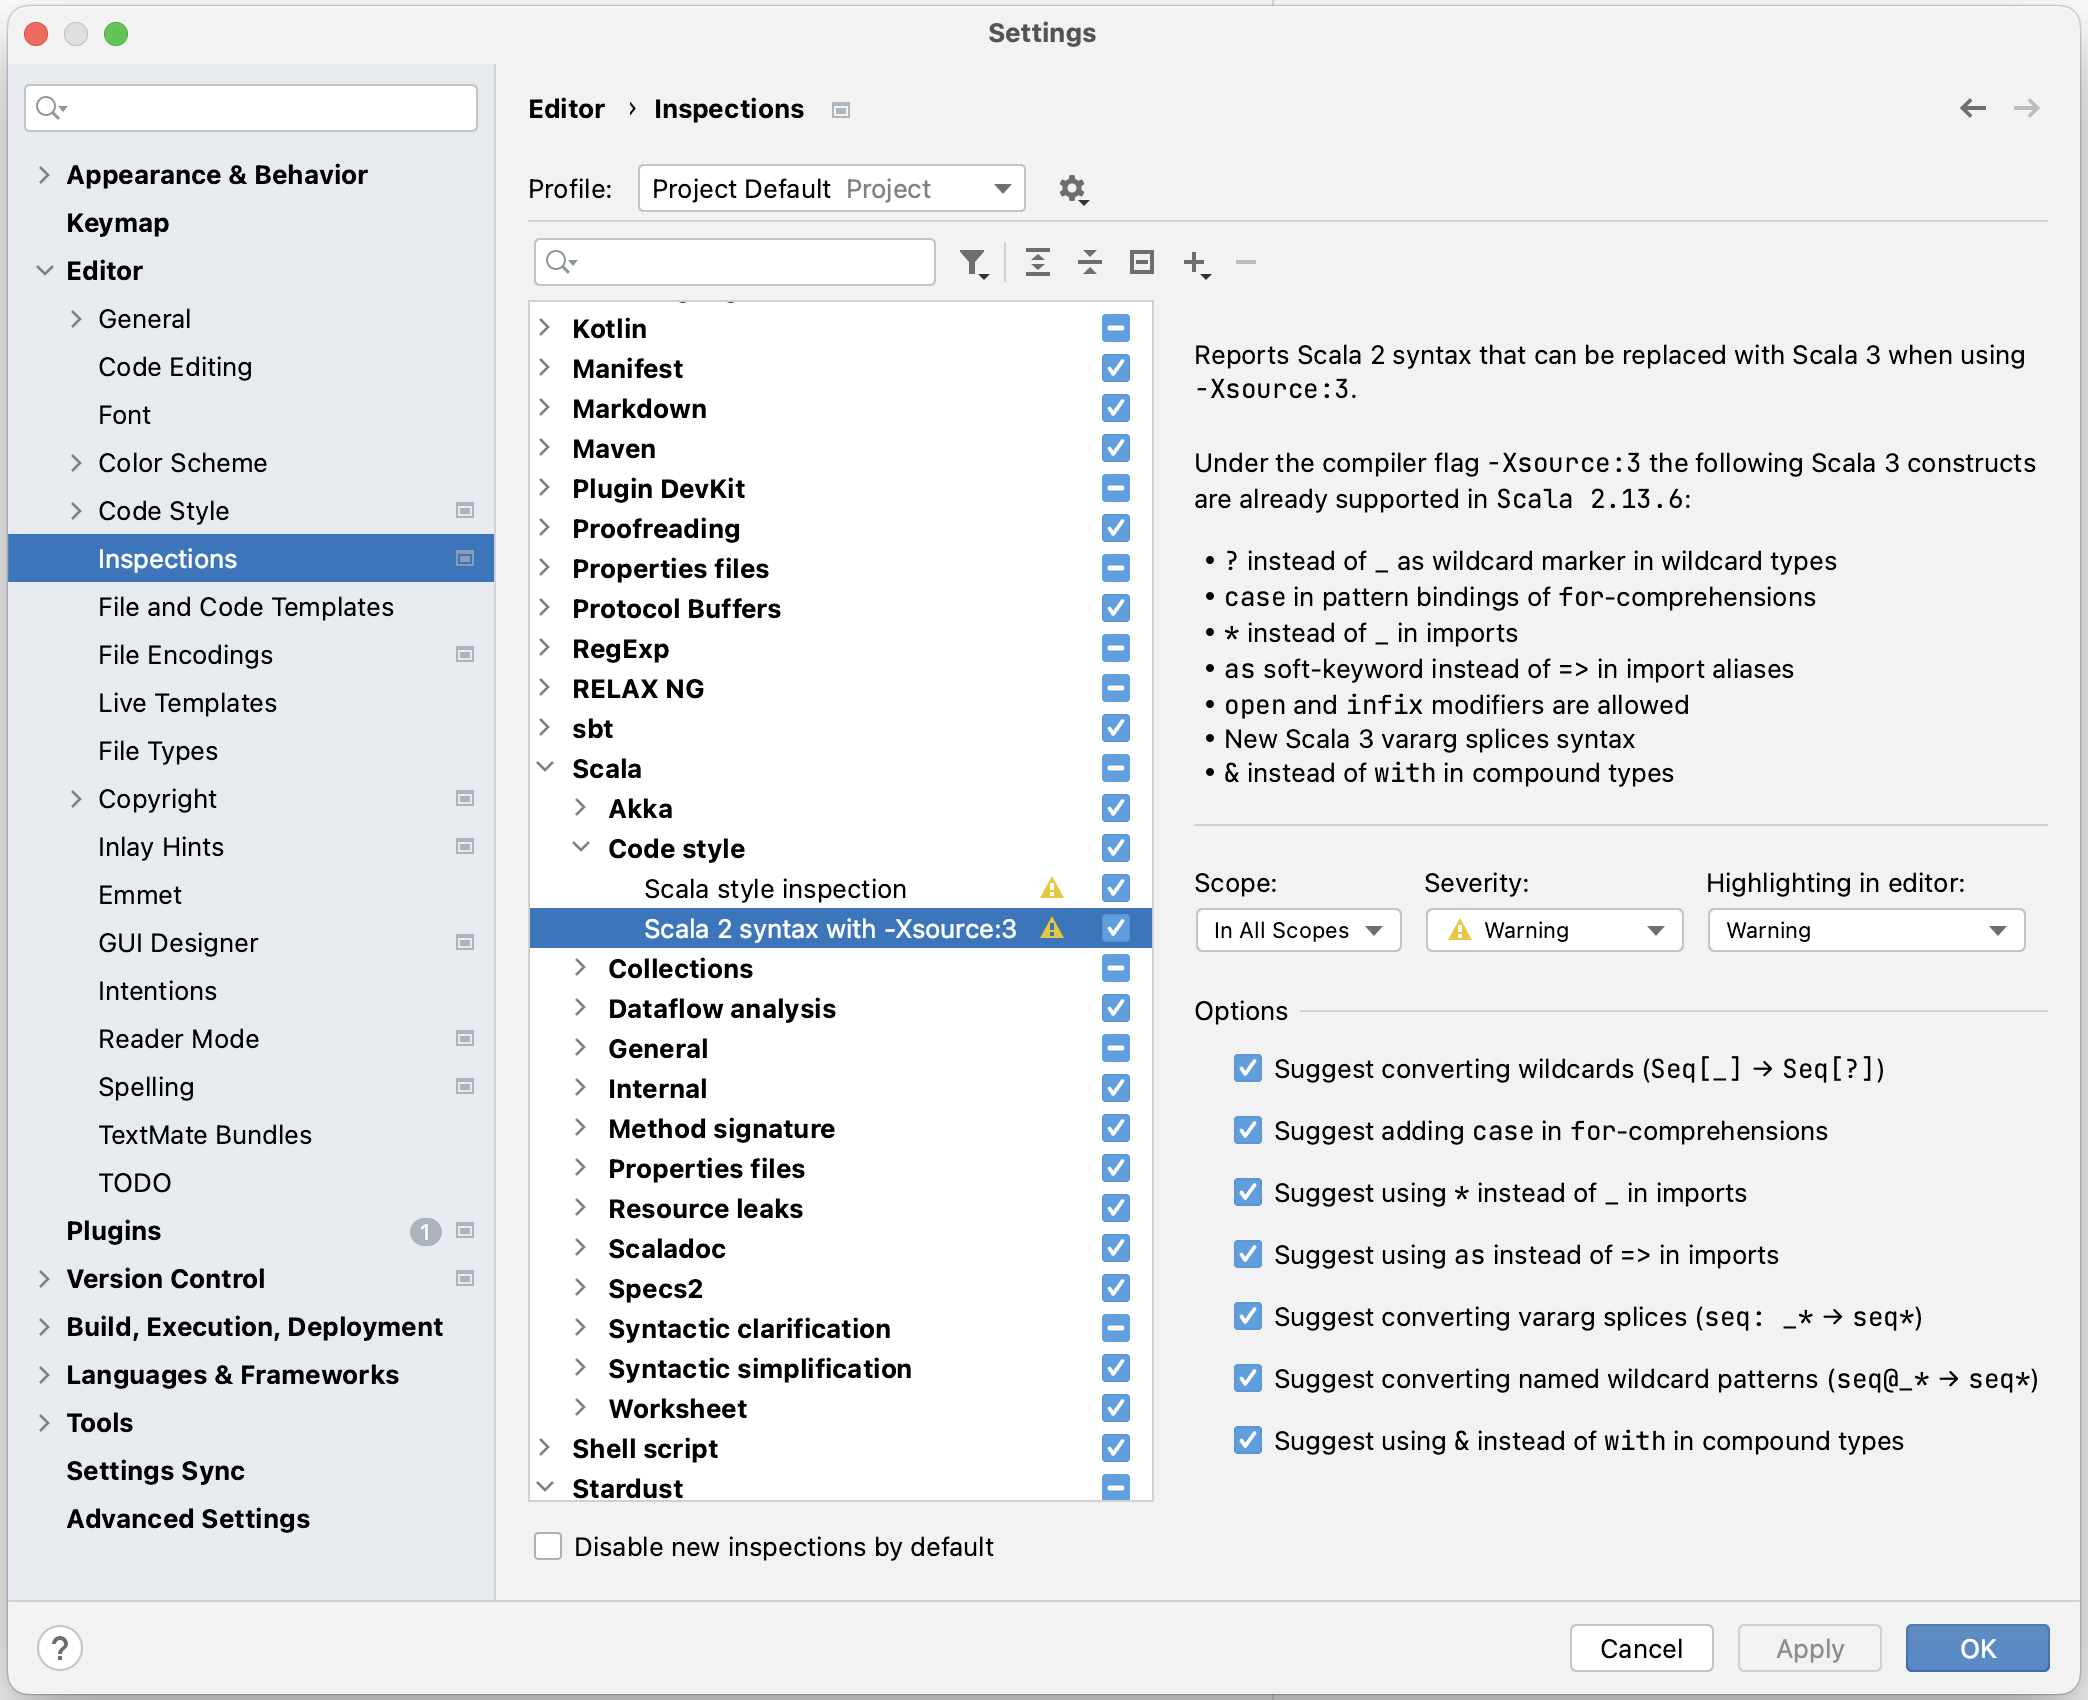
If you suspect some of those inspections are of no use to you, disabling them may improve highlighting speed. You can go to Settings | Editor | Inspections, look through the list of available inspections, and disable any that you don’t need. As a bonus, browsing the settings might present a good opportunity for you to learn what all the Scala plugin has to offer.
Next, we’ll take a closer look at 3 of the Scala plugin’s many inspections. Please note that even if you disable these 3 inspections, the performance boost will likely be negligible. Each inspection is only a small part of the plugin’s logic, and for every user it might have a different impact and be more or less valuable.
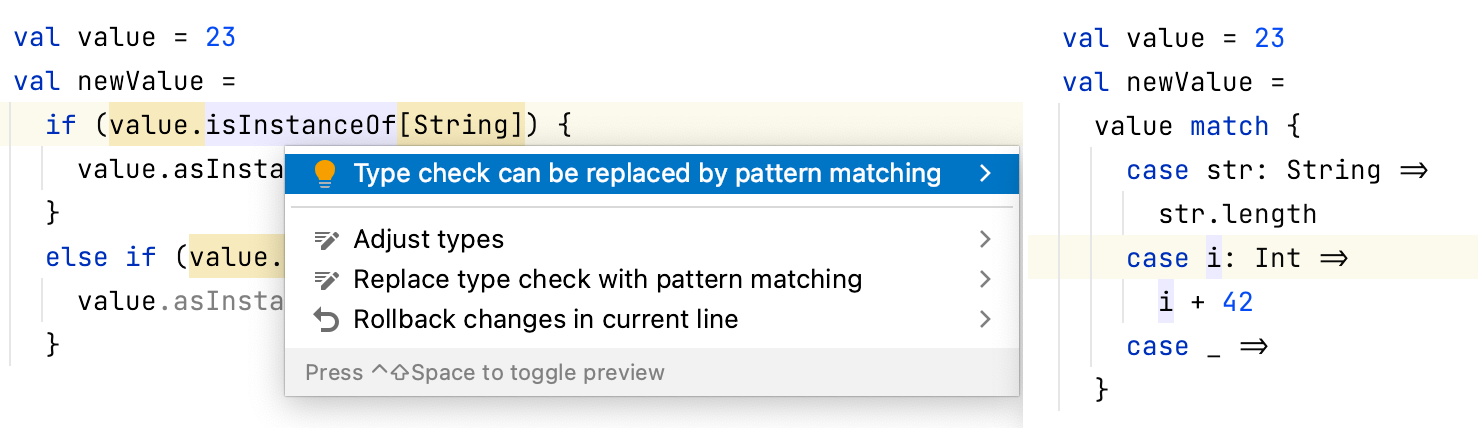
- Type check can be replaced by pattern matching
This inspection looks for type checks and type casts in a series of if-else statements and suggests replacing them with pattern matching. Please note that even the most complex inspections have quick paths for checking that they do not apply to the given piece of code (e.g. when there is no isInstanceOf in it). However, in certain cases, you might want to use code that looks like this, and if you want it to stay that way, you might consider disabling the inspection.
2. Scala 2 syntax can be replaced with Scala 3
This inspection works only if you have enabled the compiler option -Xsource:3. It reports Scala 2 syntax that can be replaced with its Scala 3 alternatives. If you use -Xsource:3 for compatibility, but you don’t need to rewrite your code, you can safely disable it.
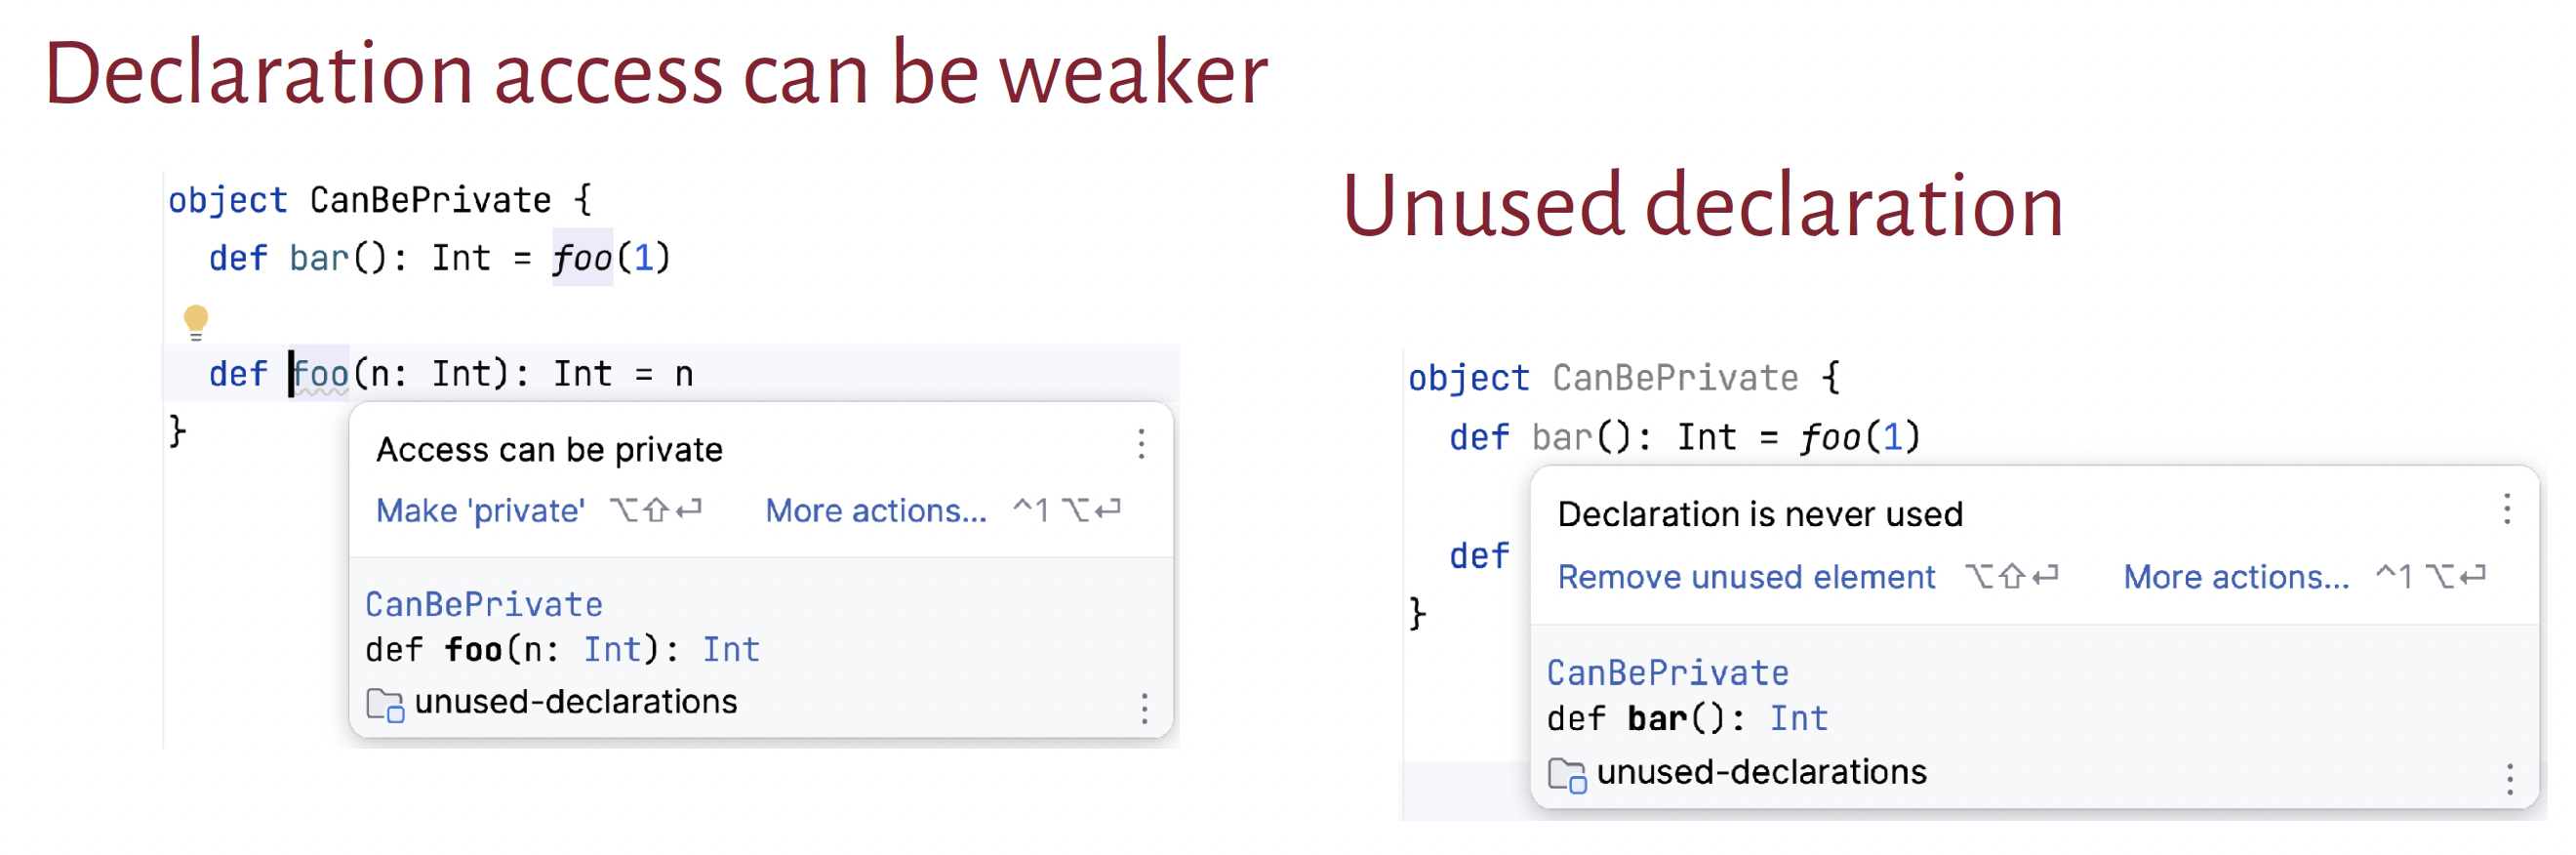
3. “Declaration access can be weaker” and “Unused declaration” inspections
For every declaration in your code, these two inspections will try to check how the declaration is used. The first one will work if the declaration is public or protected. It will check whether it is indeed used outside the scope of its own class, trait, or object. If it isn’t, the inspection will display a hint that the declaration can be made private. The second one works for every declaration – it goes through the declaration’s scope and checks whether it is used at all.
Coding practices
Scala lets us write complex code in concise ways and we tend to take full advantage of this. But there are costs attached: the more we leave for the IDE to figure out, the less performant it will become. As you could notice in the examples above, in many cases if you enforce strict coding practices, some of the inspections in the Scala plugin might become unnecessary. In fact, what the Scala plugin inspections do is not so different from what you or I would do if we had to figure out whether a declaration is unused or whether a variable could be a value. We would look around within the scope. We would try to find other elements that we might suspect of being connected to this one. We would look for subclasses, implicit conversions, and so on.
If a reviewer struggled with the complexity of your code, this might be a sign that your code could be improved and made easier to analyze. In a similar way, if you see that your IntelliJ IDEA slows down because inspecting your code takes too long, consider adjusting your coding practices:
- Set proper access modifiers to classes, methods, and declarations, to narrow the scope.
- Don’t overuse type inference.
- Limit the use of implicits.
- Prefer loose rather than tight coupling for components, so that the logic of the inspection will not have to follow too many paths.
- And in large projects, consider splitting your code into modules and submodules, again to limit how much there is for the inspections to cover.
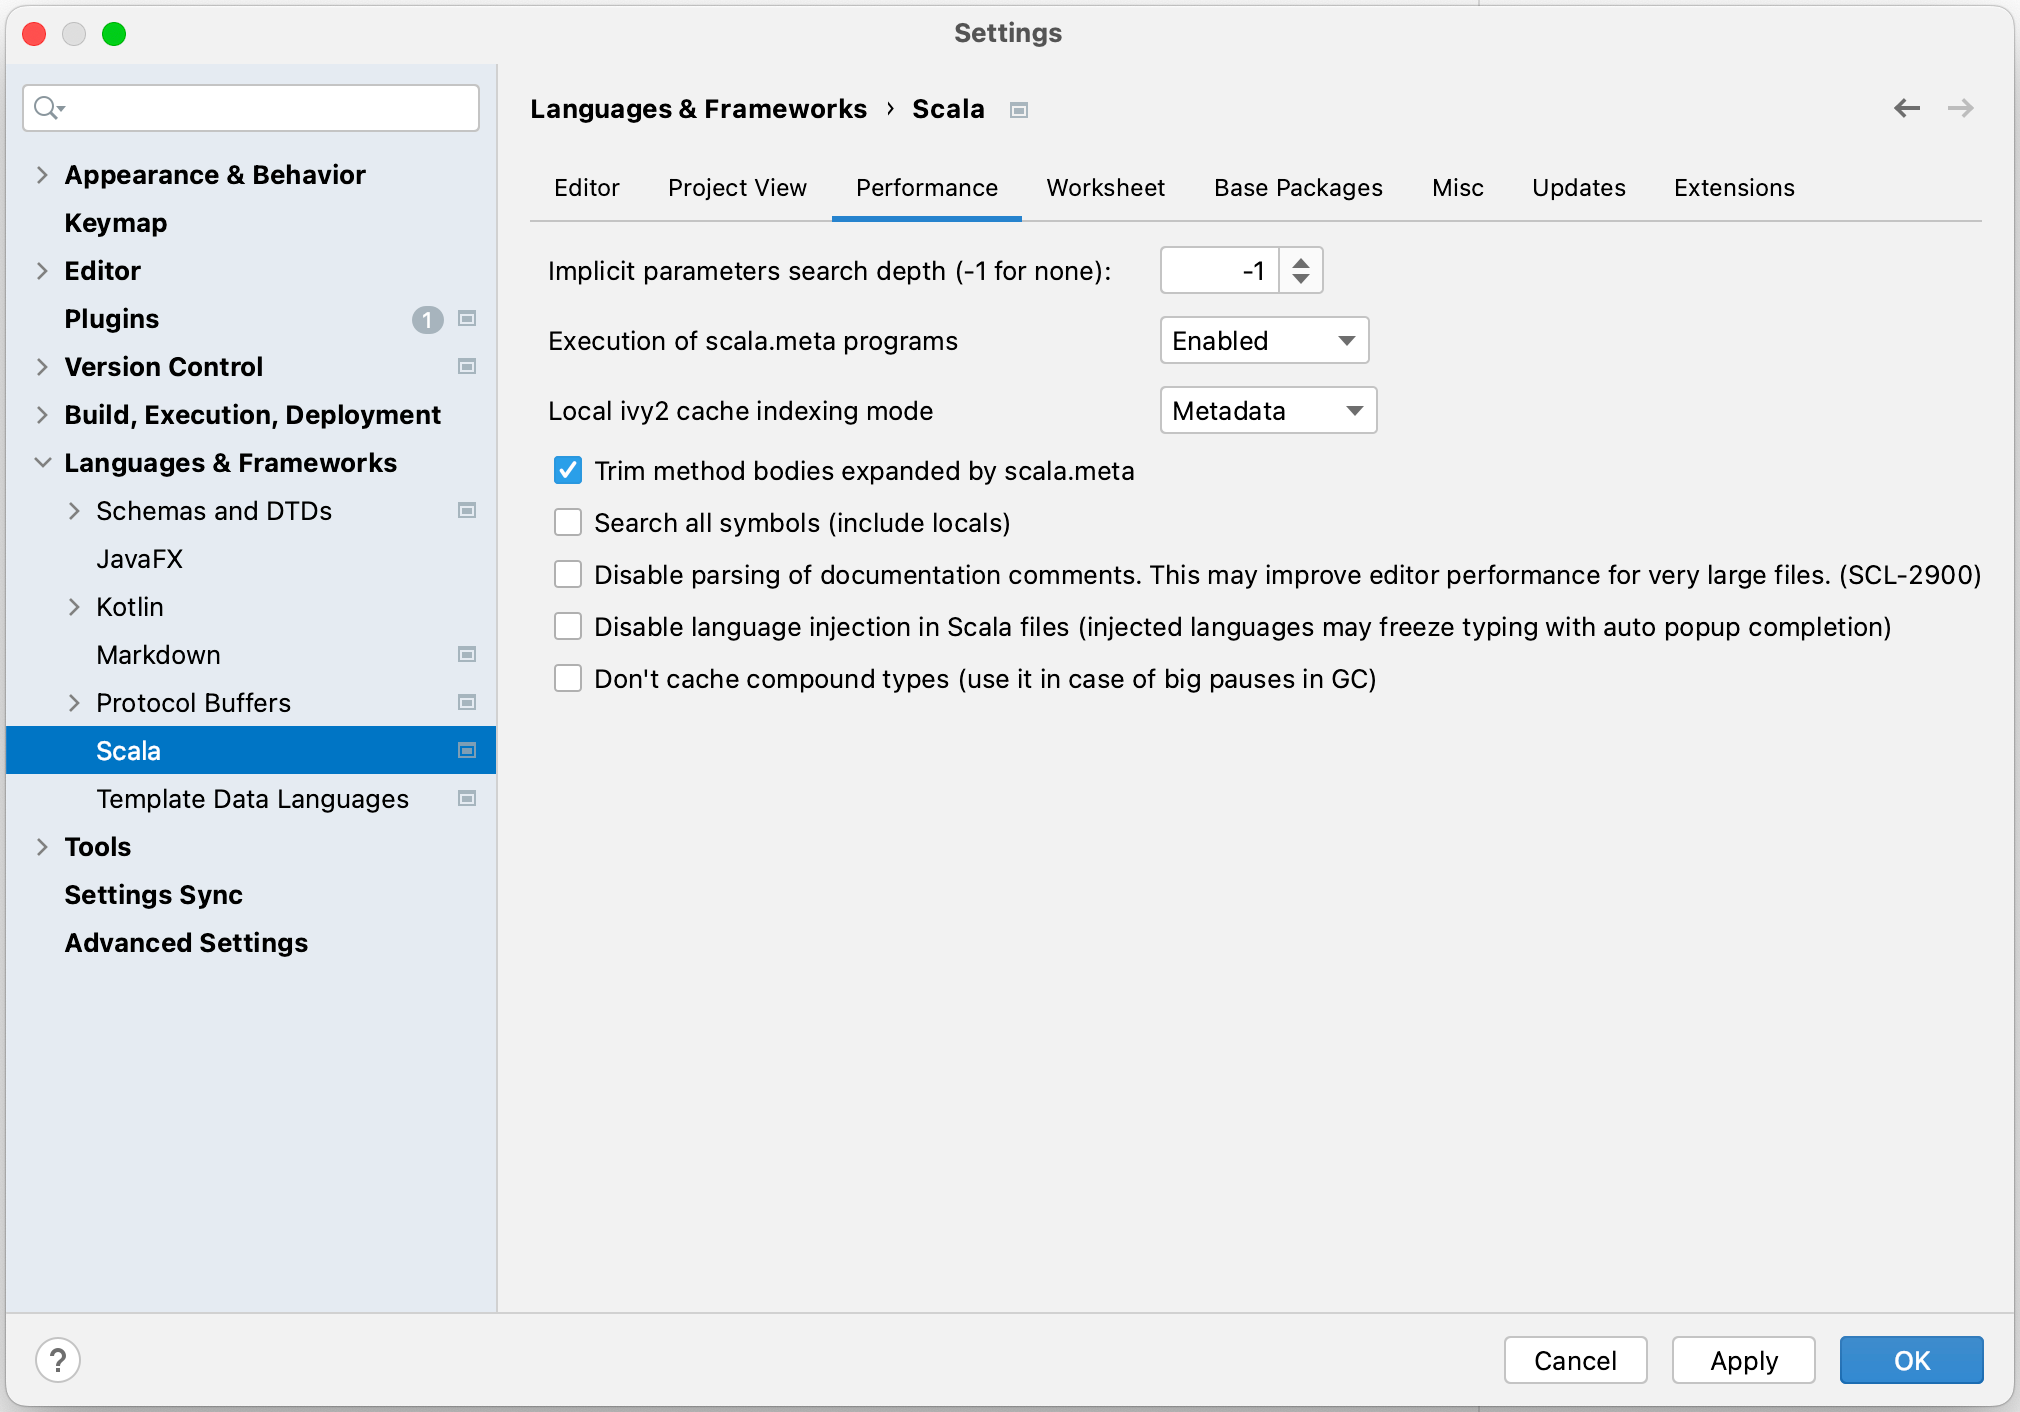
You can also go to the Performance tab in Settings | Languages & Frameworks | Scala, look at the controls there, and consider whether your project’s performance might suffer from one of the issues these controls address. For example, if you use a lot of implicit parameters, figuring them out may take a long time. Or if you use big files where for every class and method you have a documentation entry in the comments that uses code examples, the Scala plugin will try to highlight it properly. You can try disabling these functionalities, and a few others as well.
Features
All the hints we talked about so far may help you in some special cases. Usually, if your machine is good enough – and as I mentioned before, an average laptop is already good enough – IntelliJ IDEA’s performance should be just fine. Only if your project is especially demanding, should these hints be of use.
But it might be that for some reason you have to use IntelliJ IDEA on an old, weak computer. In such a case, you may try a few more things to make your experience a bit better. Go to Settings | Appearance & Behavior | Appearance, and disable antialiasing and smooth scrolling. Your fonts will appear less smooth, and when you scroll through the contents of your files, that will feel less smooth as well, but both of these features have some impact on performance. If that’s not enough, you can open the File menu and enable Power Save Mode. This will turn off a lot of IntelliJ IDEA’s features, so I suggest doing it only if nothing else helps.
If this is too extreme for you, you may try the Automatic Power Saver plugin, which you can install from JetBrains Marketplace. It will let you control when Power Save Mode should be automatically turned on and off, letting you still use IntelliJ IDEA’s more complex features when you need them.
Another option is to disable type-aware annotators. You can do it by clicking on the small “[T]” sign in the lower right corner of the IntelliJ IDEA main window.
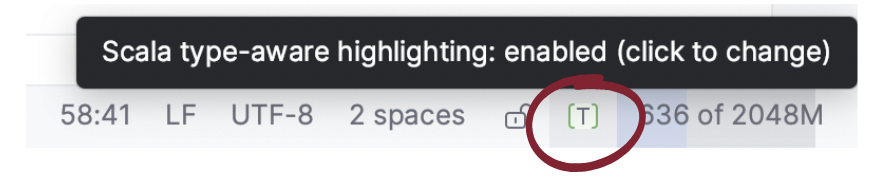
It will stop the Scala plugin from checking types in your code. Note that it will not disable all errors checks, but only those where an error is caused because the types don’t much, like for example when you try to pass a String as an argument to a method that accepts an Int.
Tell us about your issue
Last but not least, if you experience slow performance, especially in some specific situations that you can reproduce, this might be pointing to a problem within the Scala plugin. Please write to us about it. Even better, install the Performance Testing plugin, capture a performance snapshot, create a ticket in the JetBrains YouTrack system, and upload the snapshot there. Your feedback will help us identify the causes of the problem and fix them, making the Scala plugin more efficient and more enjoyable for all of us.