YouTrack
Powerful project management for all your teams
2017 In Review: Task & Project Management Trends

We hope that your 2017 was successful, productive and full of bright and memorable moments for you and your team. We wish you all the best for the holidays and hope you have a great start to the new year.
The end of the year is just the right time to take a retrospective review. What are the main usage trends in YouTrack? Which projects and boards are the most popular? Which reports do you use more often? We’ve collected the most interesting trends in YouTrack usage through 2017 and are excited to share them with you*.
Our Customers’ Location
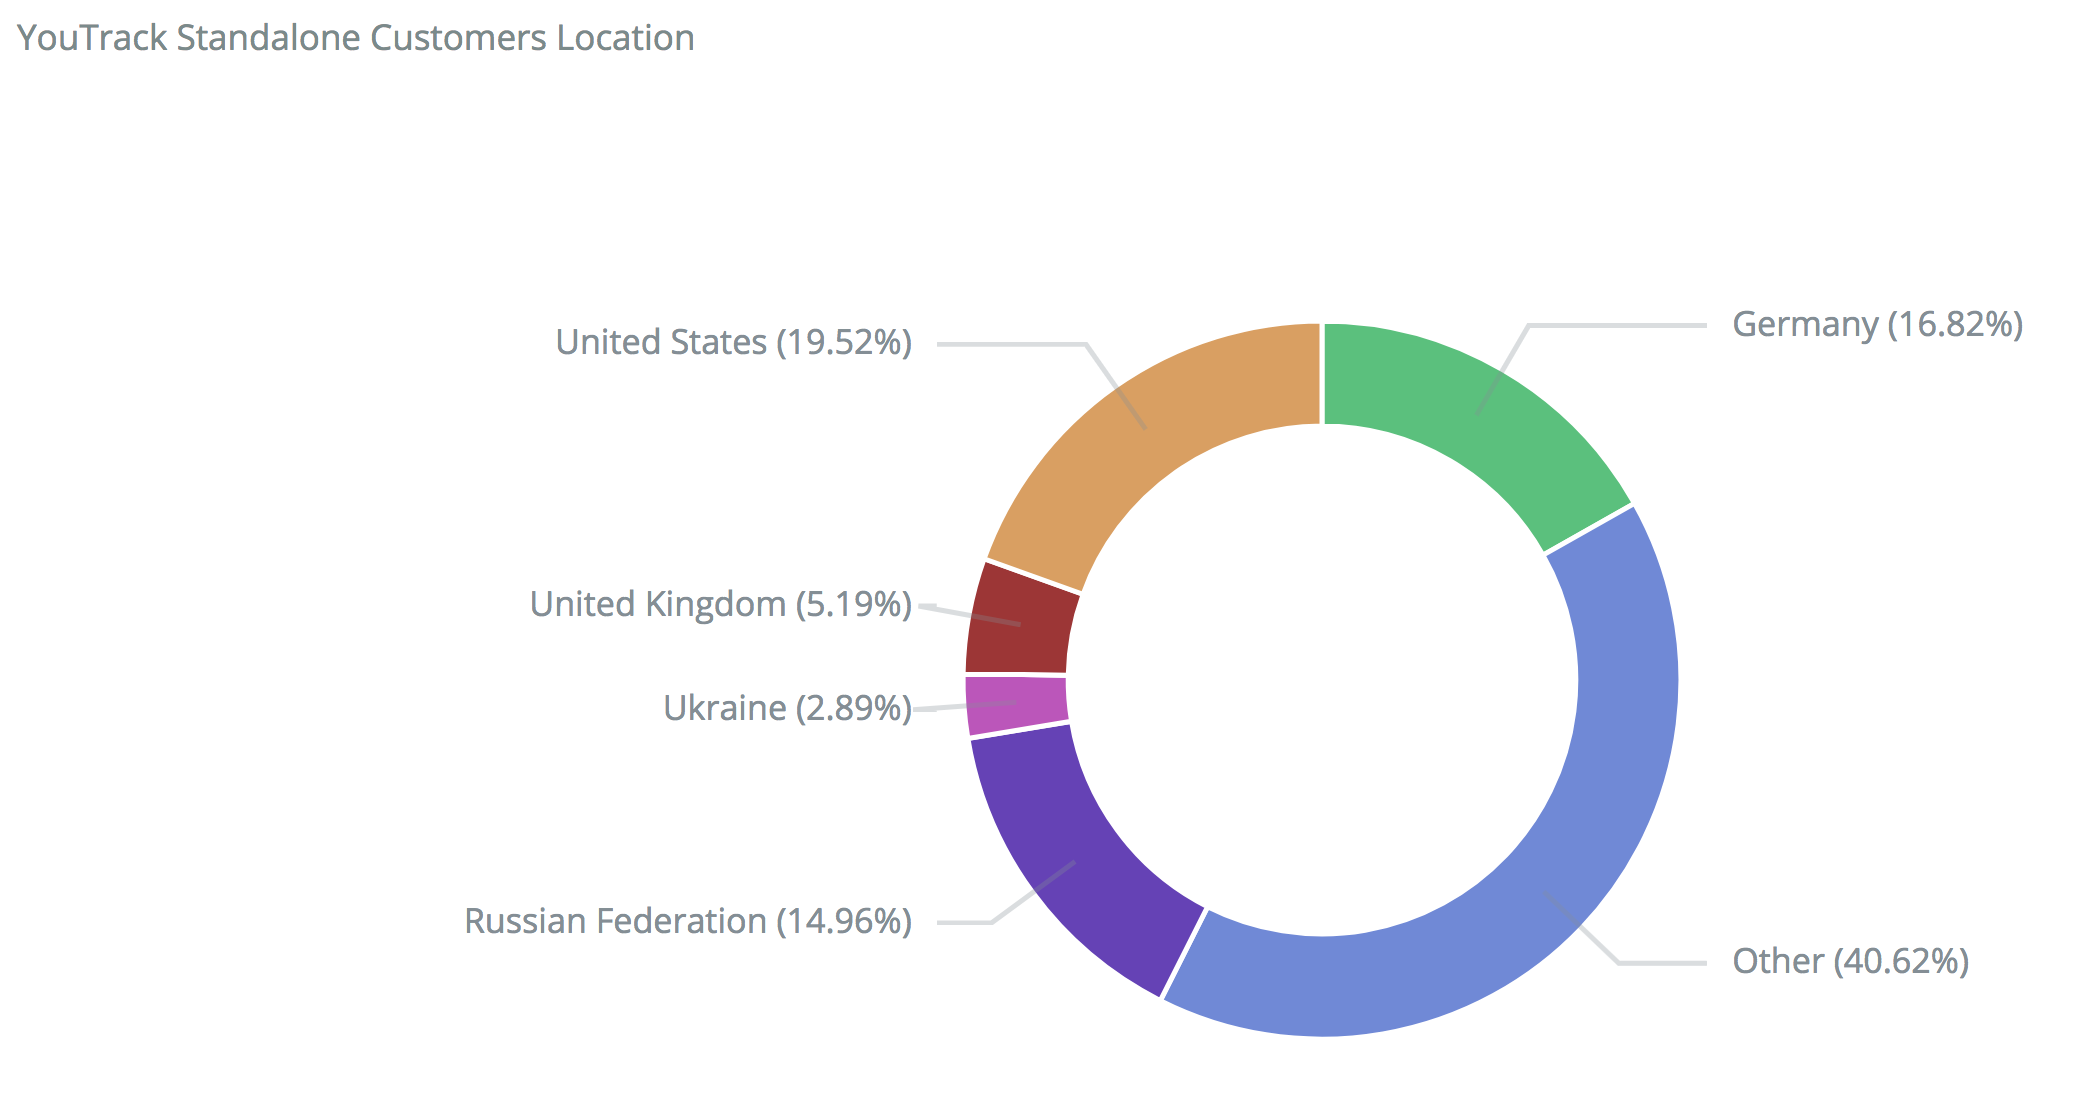
YouTrack Standalone
The biggest markets for YouTrack standalone are pretty stable when compared to the previous year: USA (20%), Germany (17%), Russia (15%), and the United Kingdom (5%), followed by Ukraine, France, Netherlands, China, and Canada.
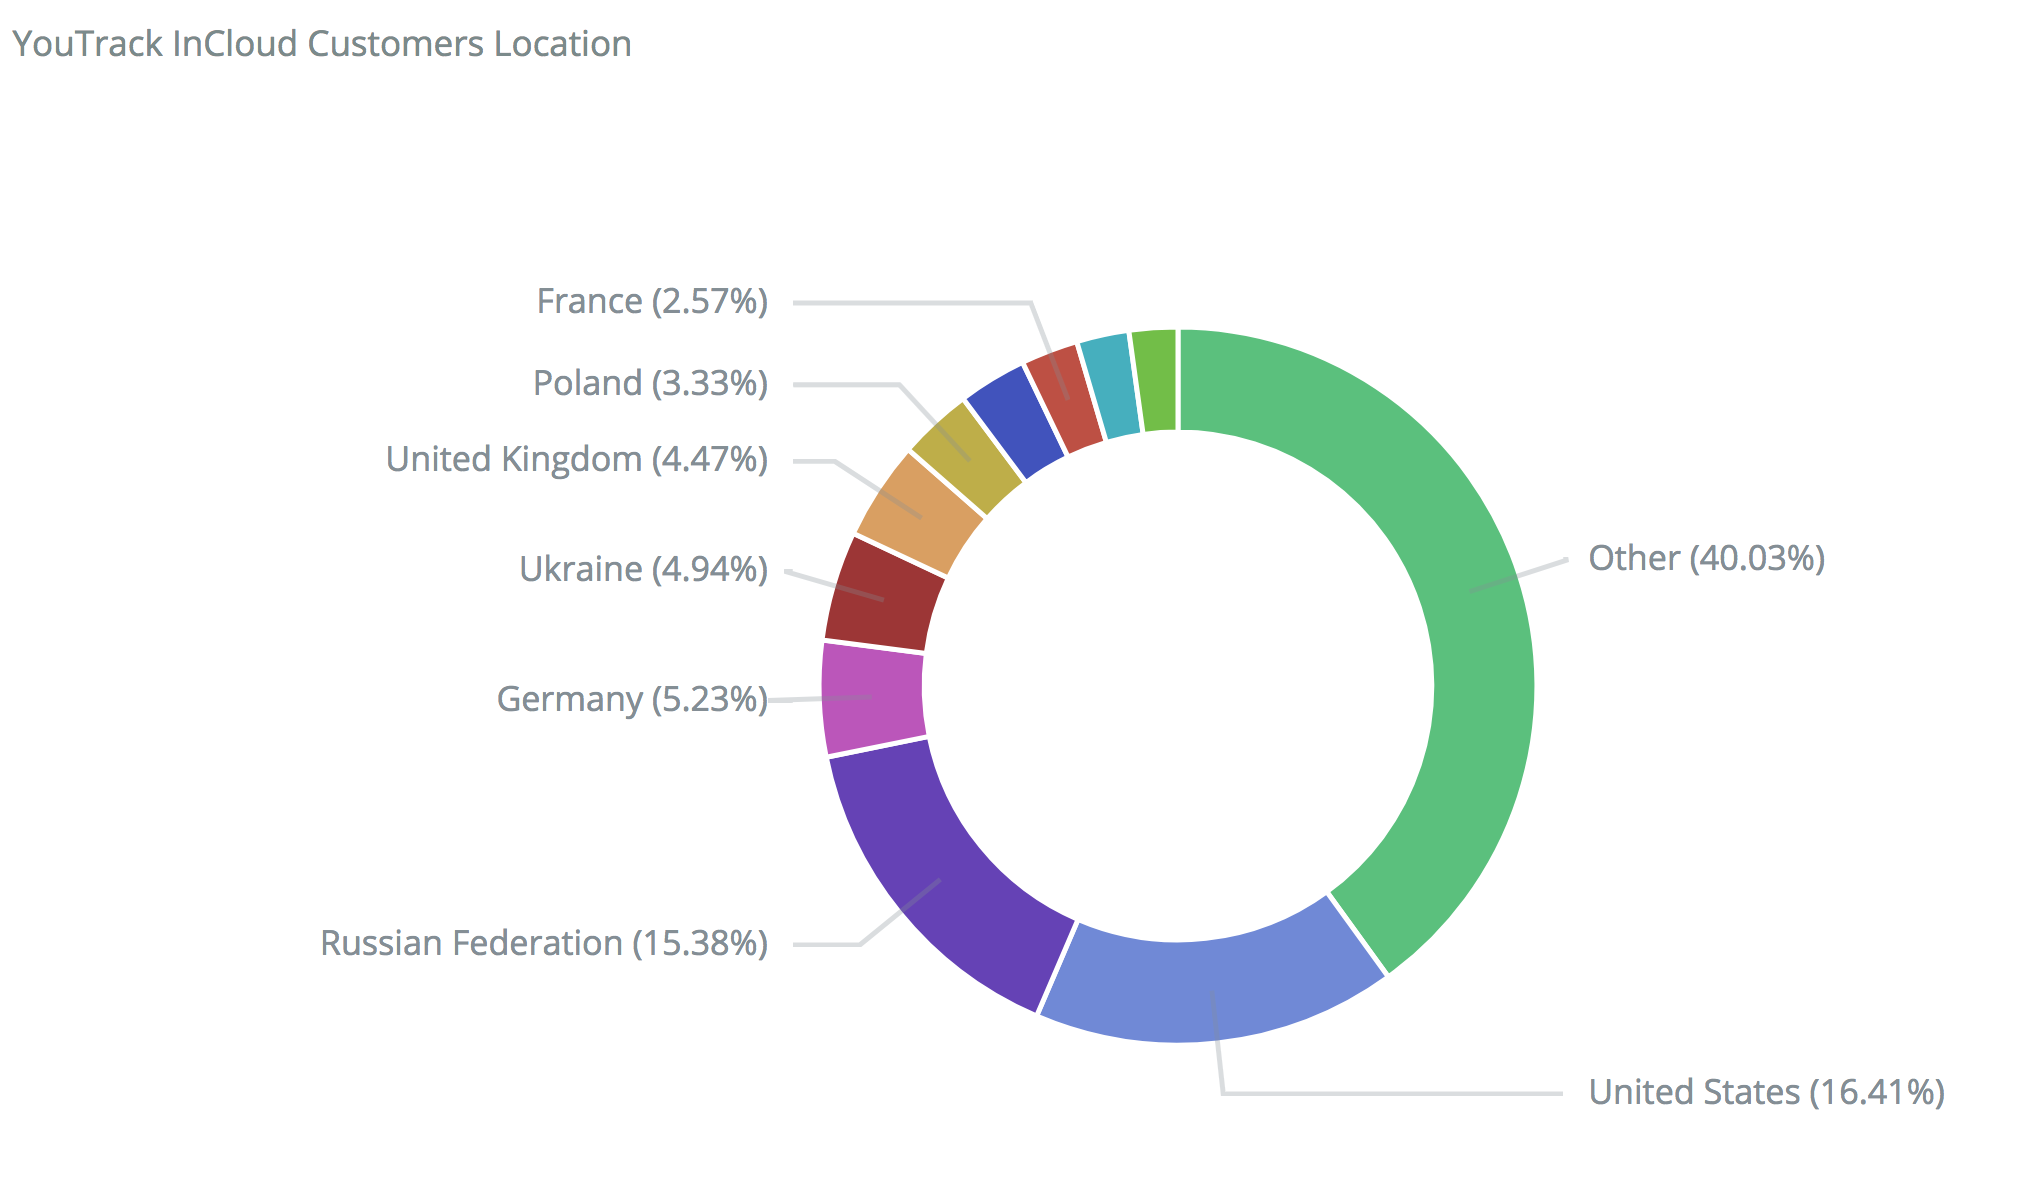
YouTrack InCloud
Most of the InCloud customers come from the same countries with only a slight change in how they are distributed: USA (16%), Russia (15%), Germany (5%), Ukraine (5%), the UK (5%). In general, InCloud customers are more distributed around the world, compared to standalone.
Popular Project Types
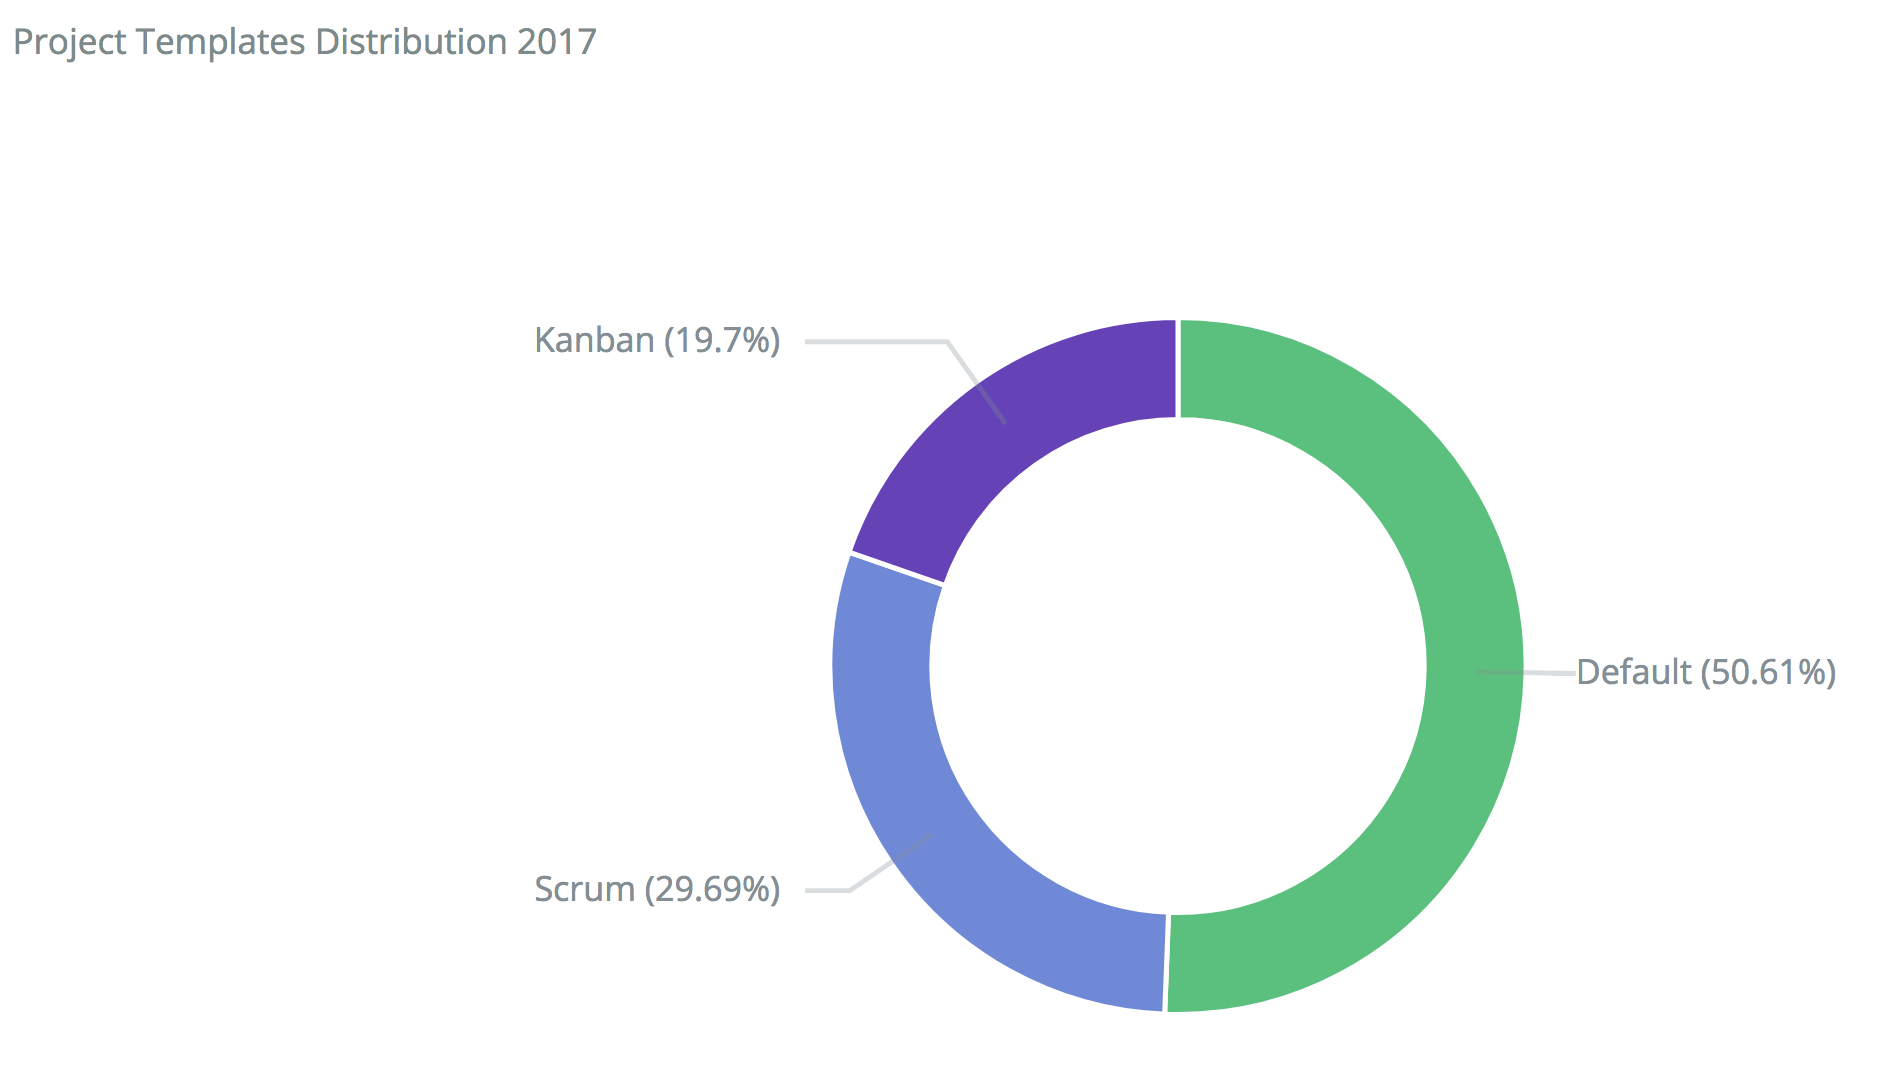
When you create a new project, YouTrack provides you with several options to choose from, which you can pick depending on your development process. The Pure issue tracking project is suggested by default with no specific process imposed; this contains a basic set of issue fields and workflows. This year the default template was the most popular template accounting for about 50% of all created projects. Agile project templates reflect the type of methodologies our users prefer to follow. Scrum (30%) is still more popular than Kanban (20%). However, Kanban is getting more weight compared to the last year. Good job, keep going!
Agile Board Flavours
Agile boards are really popular in YouTrack. Makes sense, as using the agile board is the easiest way to visualize your process, whether you follow any standard agile practices, mix and match them, or you have just invented your own process. This year we’ve added more templates to give you more means of getting started with your personal boards, support your custom process, or synchronize sprints on the board with the values of a custom field such as fix version, for example.
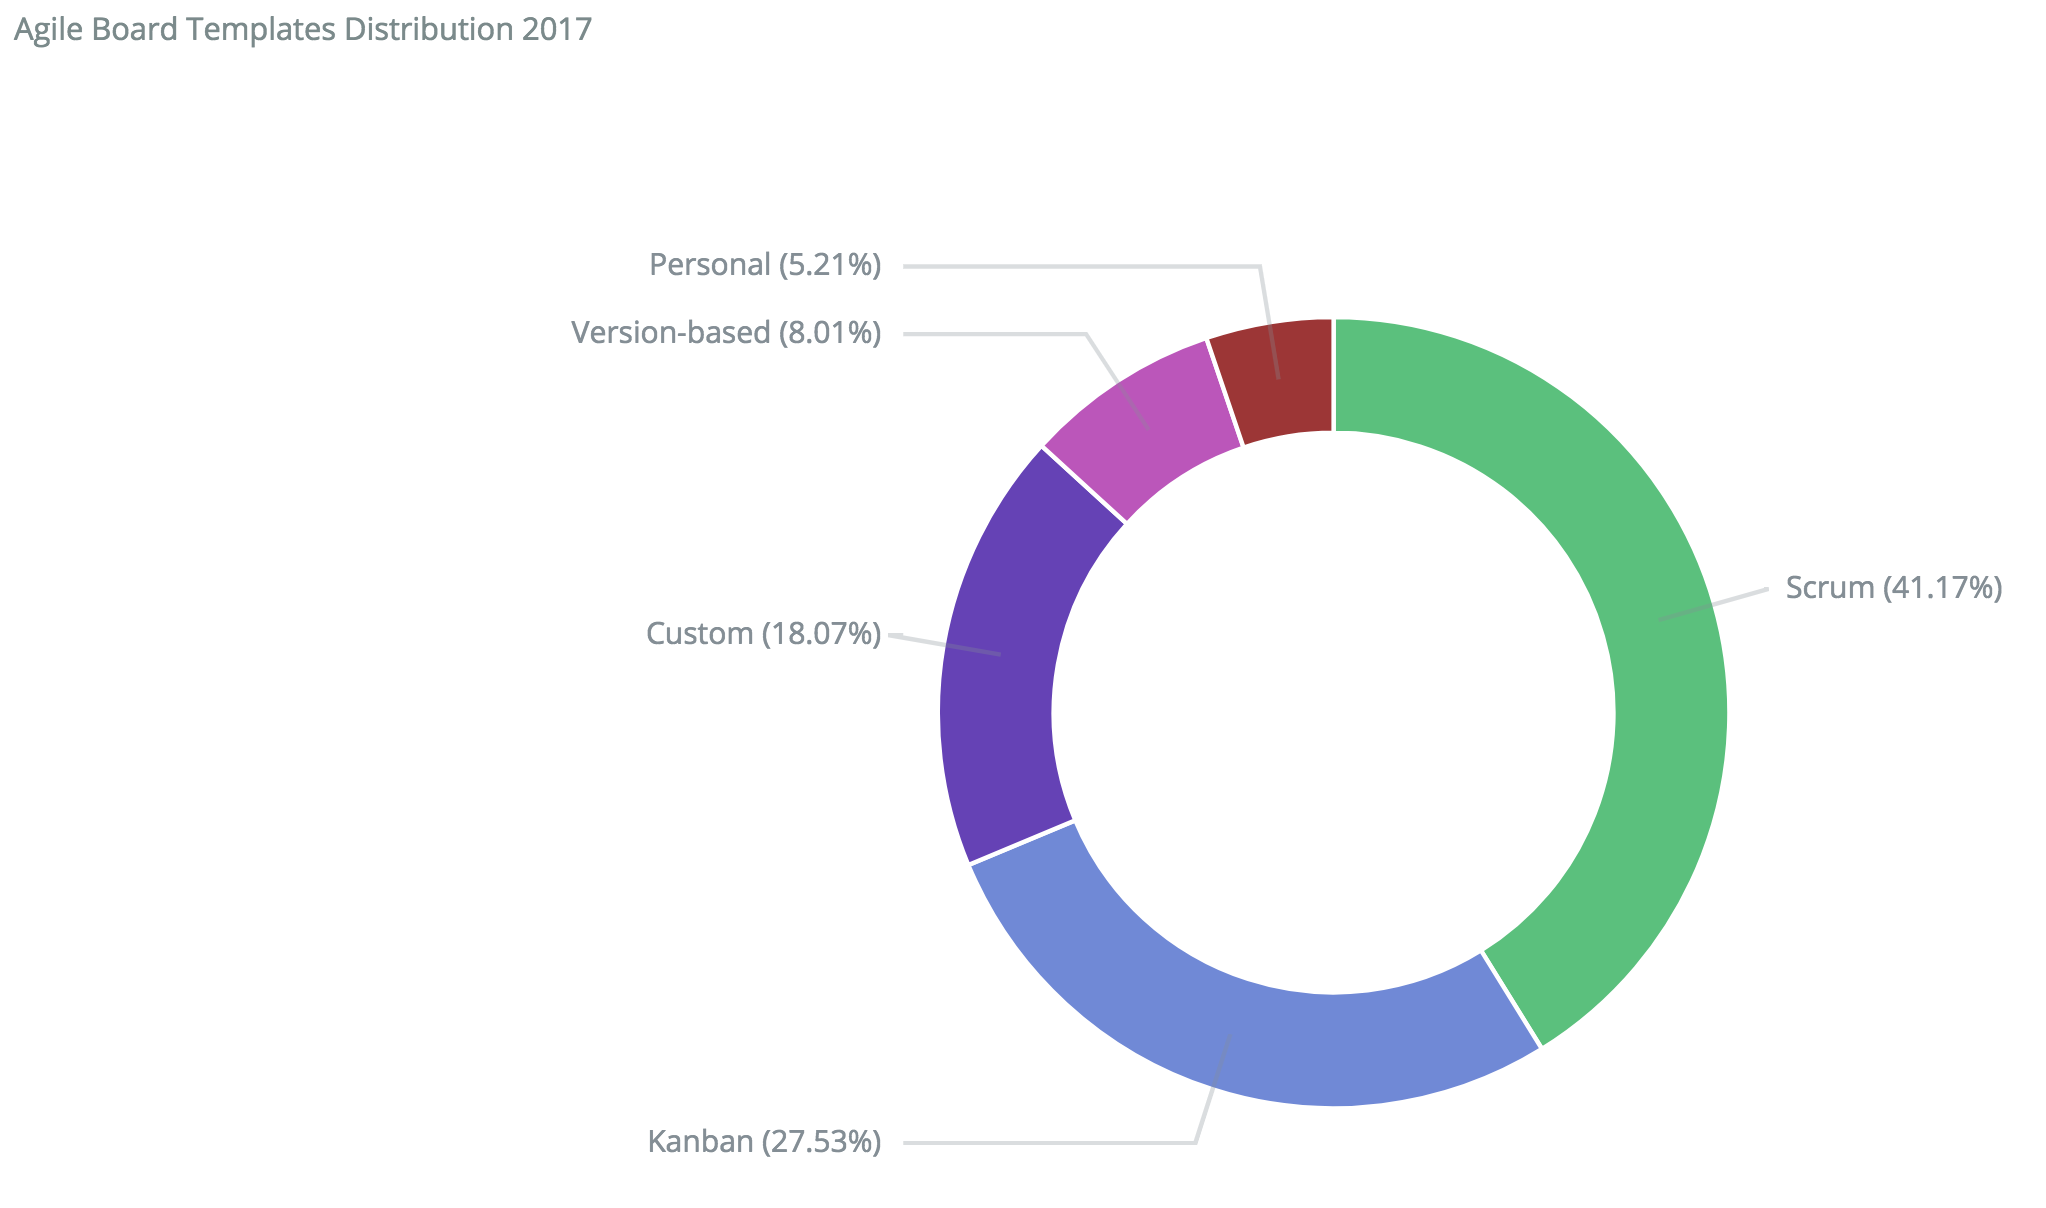
The results are pretty interesting: 70% of our users follow standard agile practices, still having the preference for Scrum (41%) with a growing share of Kanban (28%). Custom board (18%) share is noticeable as well, which means that our users are mixing and matching various practices more often. This trend completely aligns with our vision of agile values, and we’ll keep working on being flexible enough to support any kind of process. Personal boards gained a 5% share, which is about right considering the growing personal task-management trend. Awesome!
Most Popular Reports
Reports are the best way to keep track of your team and project progress. It’s very important to choose the right metrics to help you track your progress and plan your future work. Which is the most popular report?
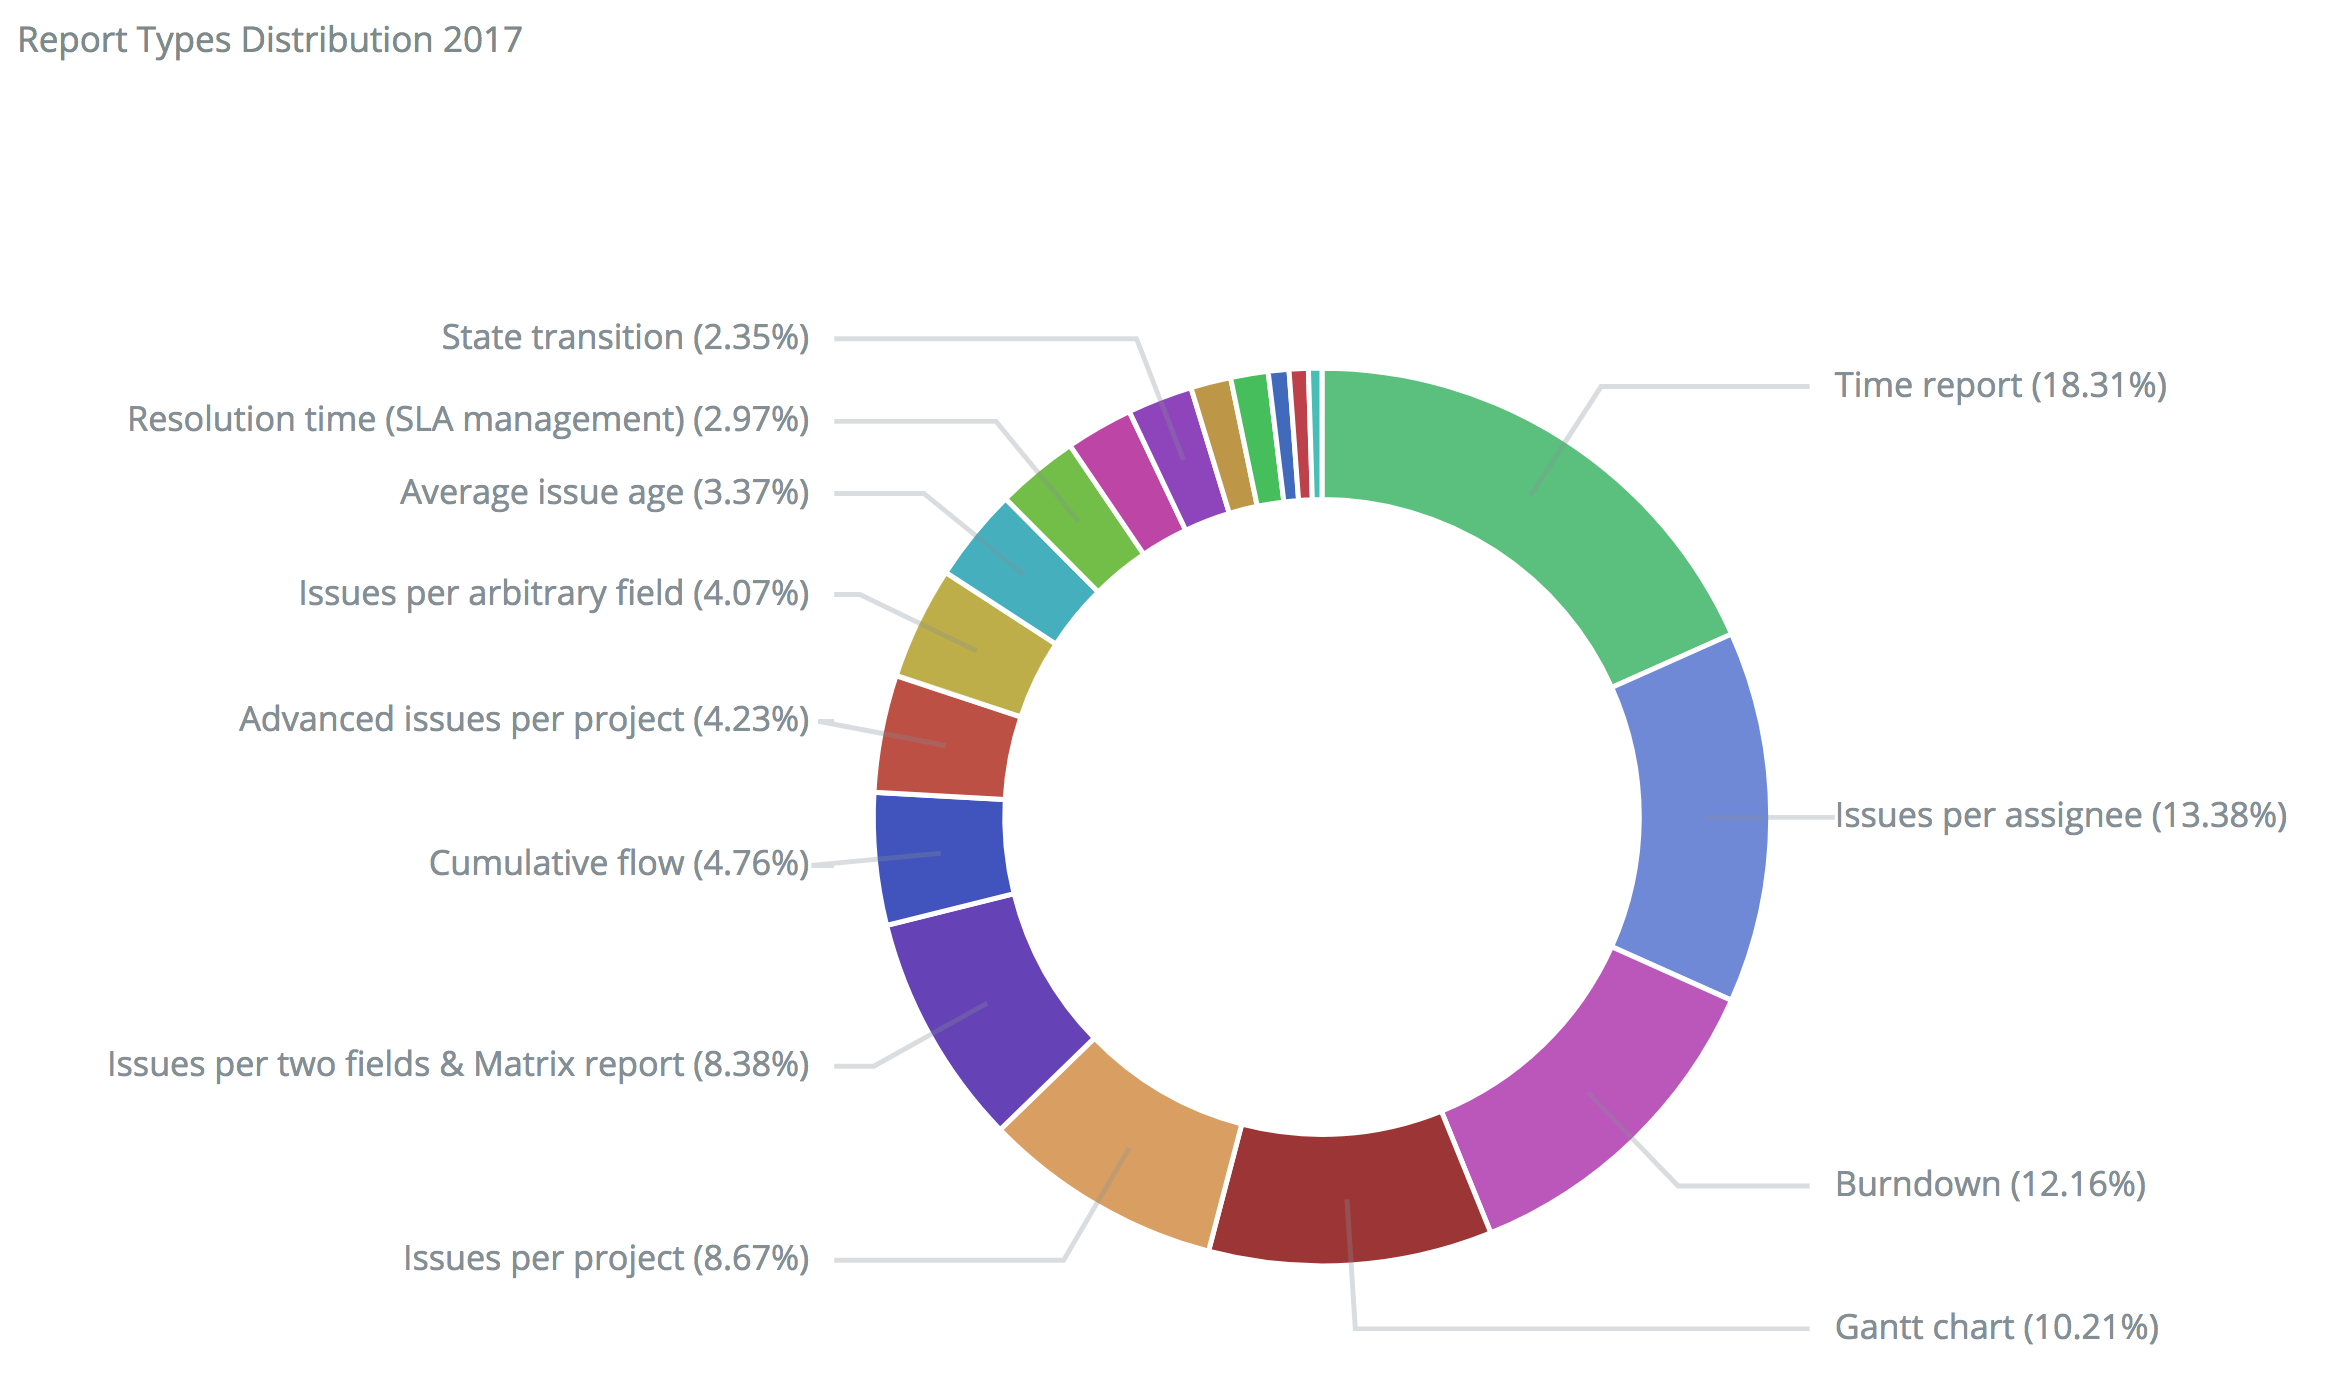
Unsurprisingly, the Time report has the biggest share (18%), as it’s crucial for most projects to estimate and keep track of spent time in order to keep the project budget well balanced. Knowing this then means we’ll keep enhancing our time tracking capabilities. For example, recently we’ve introduced an Estimation report to help you better plan your work. The next group according to popularity is: Issue distribution per assignee (13%), Burndown (12%) and Gantt Chart (10%). This trend shows that our users tend to keep the balance of workload within the team (Issue per assignee report), track their iterative progress (Burndown), and plan their work according to the task dependencies and team capacity (Gantt chart).
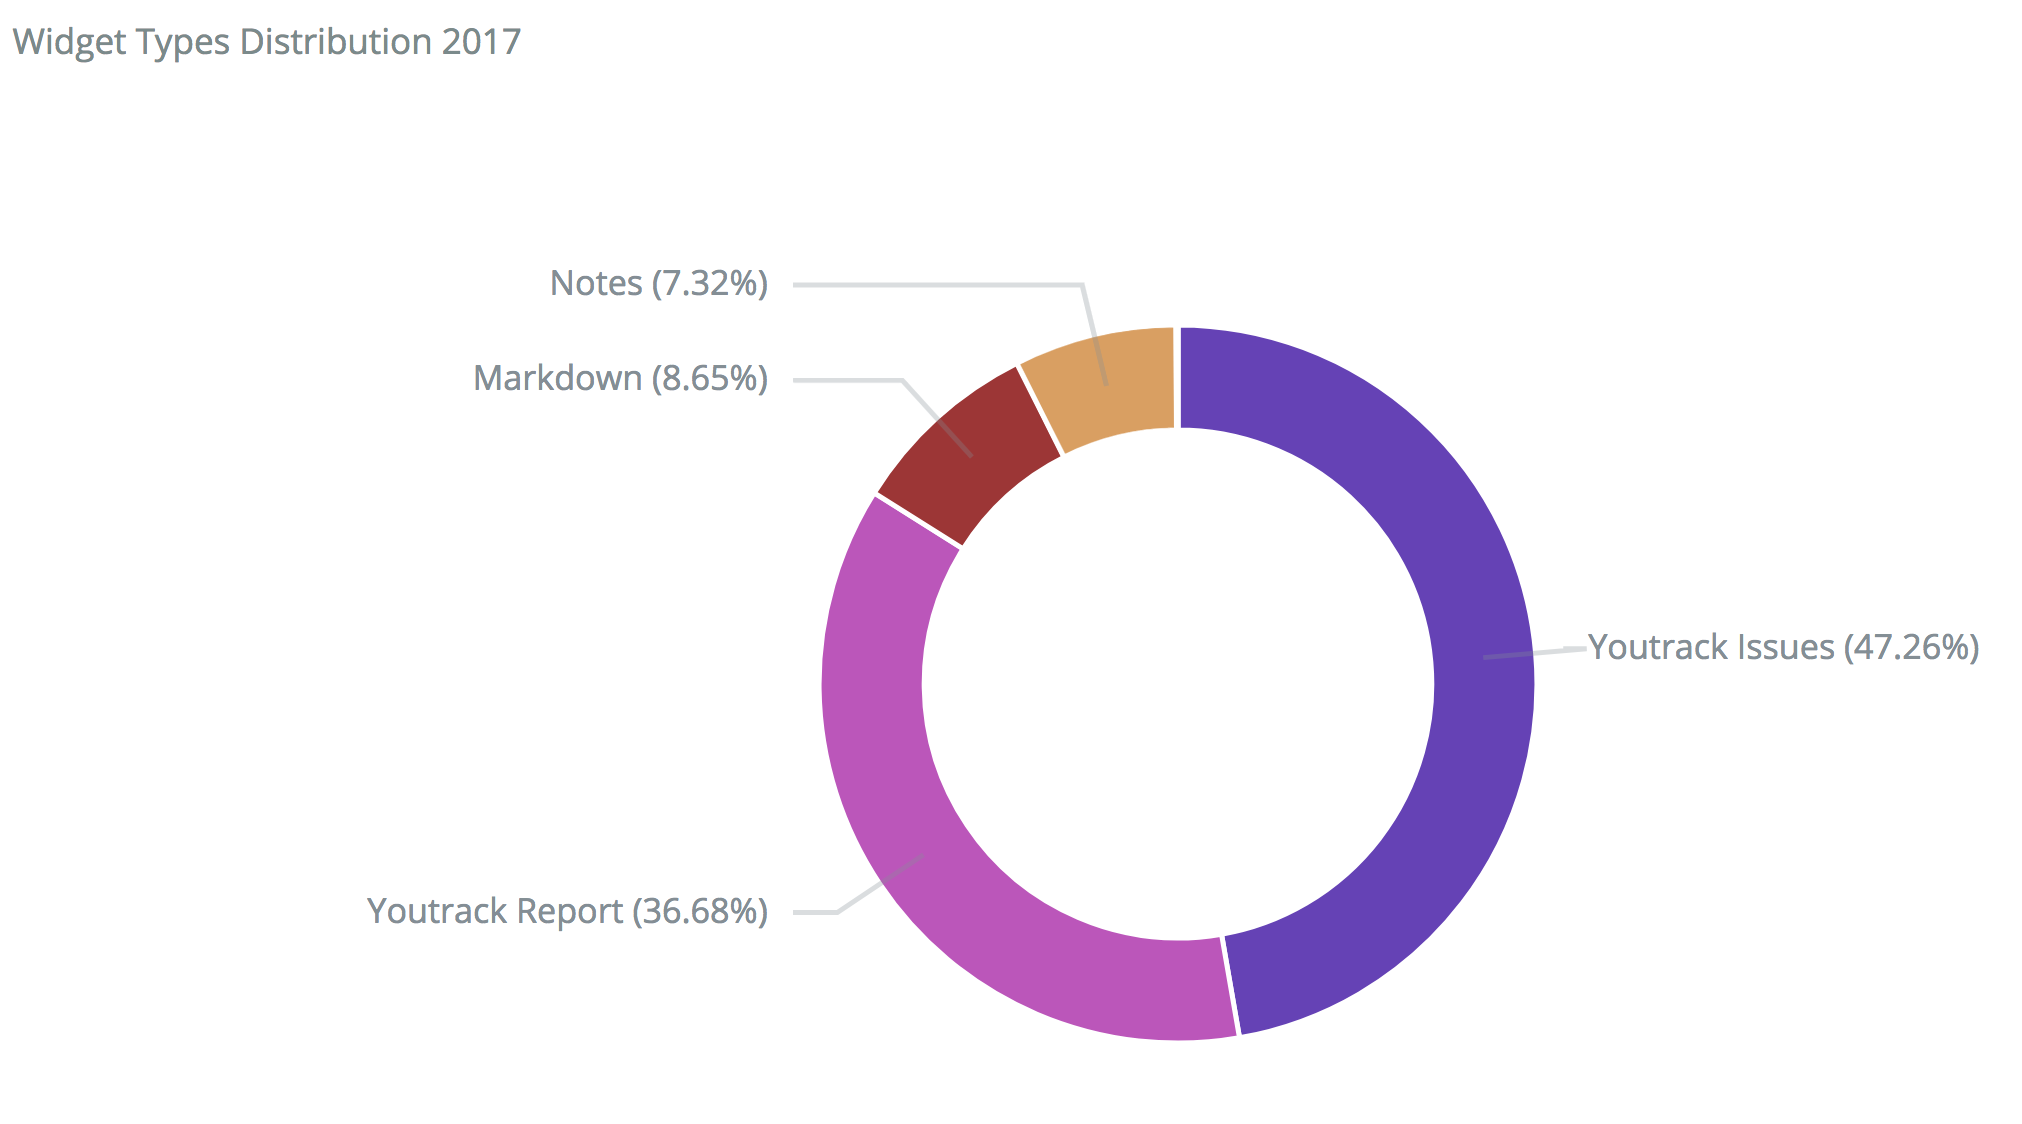
Dashboards and Widgets
Dashboard is the best way to get a birds-eye view of your projects and activities. In YouTrack you can create multiple dashboards and share them with your team or your boss. Which type of widget is the most popular? Filtered issues list (Issues) is the most popular widget this year (47%) followed by the Reports (37%). Markdown notes (9%) and Wiki notes (7%) are less popular. Recently, we’ve introduced an option to create custom widgets. Now you’re welcome to populate your dashboard with any kind of useful info!
This year you did a great job! We hope that YouTrack has helped you to reach your goals and saved you extra time spent on daily issue tracking routine. We’ll keep doing our best next year to provide you with the best tool for your team collaboration, to help you to become truly agile and follow your own process. See you next year!
* The data provided in this post is generated from anonymous feature statistics collected from instances that agreed to provide it explicitly (Standalone) or by accepting our Privacy Policy (InCloud).