YouTrack
Powerful project management for all your teams
Discovering YouTrack: Dashboards

In this blog series, we introduce you to useful features inside YouTrack and show you how to use them effectively.
In this post, we’ll show you how to set up dashboards for executive overview, team view, personal backlogs, and guest landing pages.
Dashboards can be used to provide a running report, so you are always informed about the current state of your projects and tasks in YouTrack. They can display charts, calendars with due dates, notification feeds, time tracking stats, and more. You can find all the available dashboard widgets on JetBrains Marketplace.
Creating and setting up dashboards
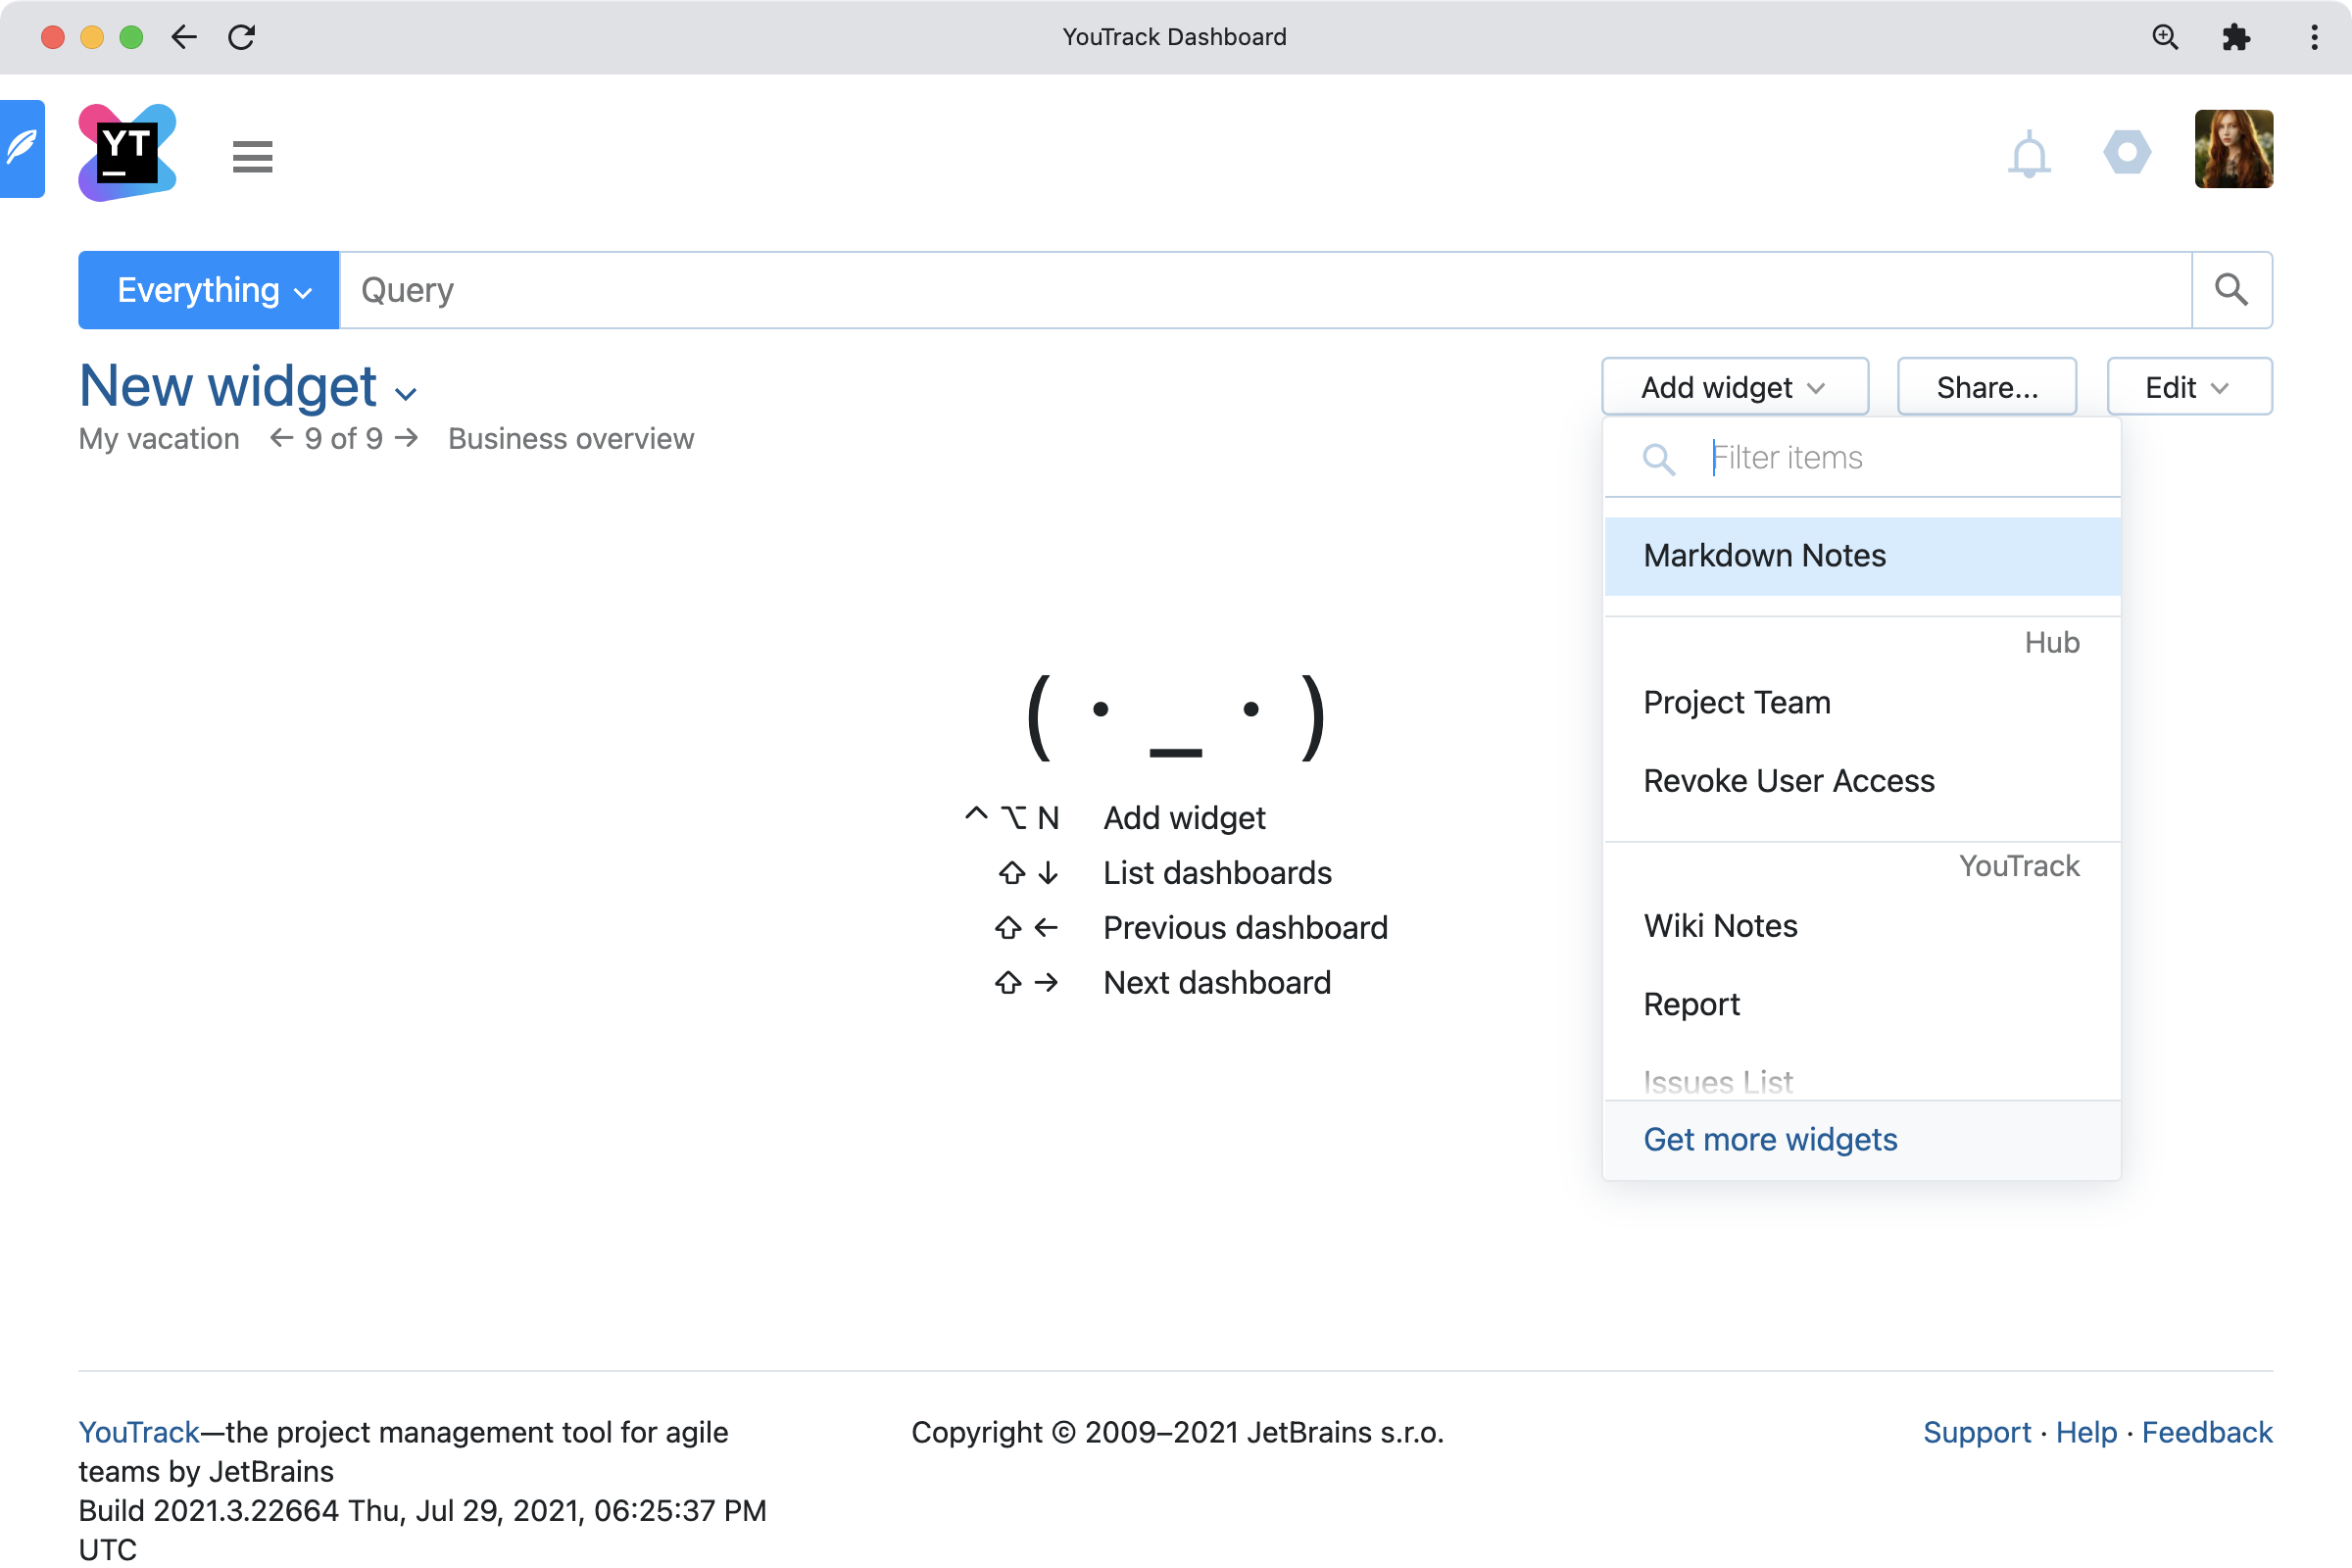
The creation and configuration procedure is the same for any dashboard. Create your dashboard, configure its visibility, and then add and configure the widgets you’ll use.
Widgets are the elements that display the information on the dashboard. Each widget has its own settings that define exactly what it displays.
Note that some widgets only display existing content. For example, to add a Report widget with a burndown chart, you must first create and configure your burndown chart in Reports. The Time Tracking Report widget, however, allows you to create a new time tracking report while creating and configuring the widget.
Dashboard examples
In each example dashboard configuration below, we’ll list the widgets that we recommend using, together with some suggested settings to get you started. It is worth experimenting with different widgets and settings to create dashboards that best fit your needs.
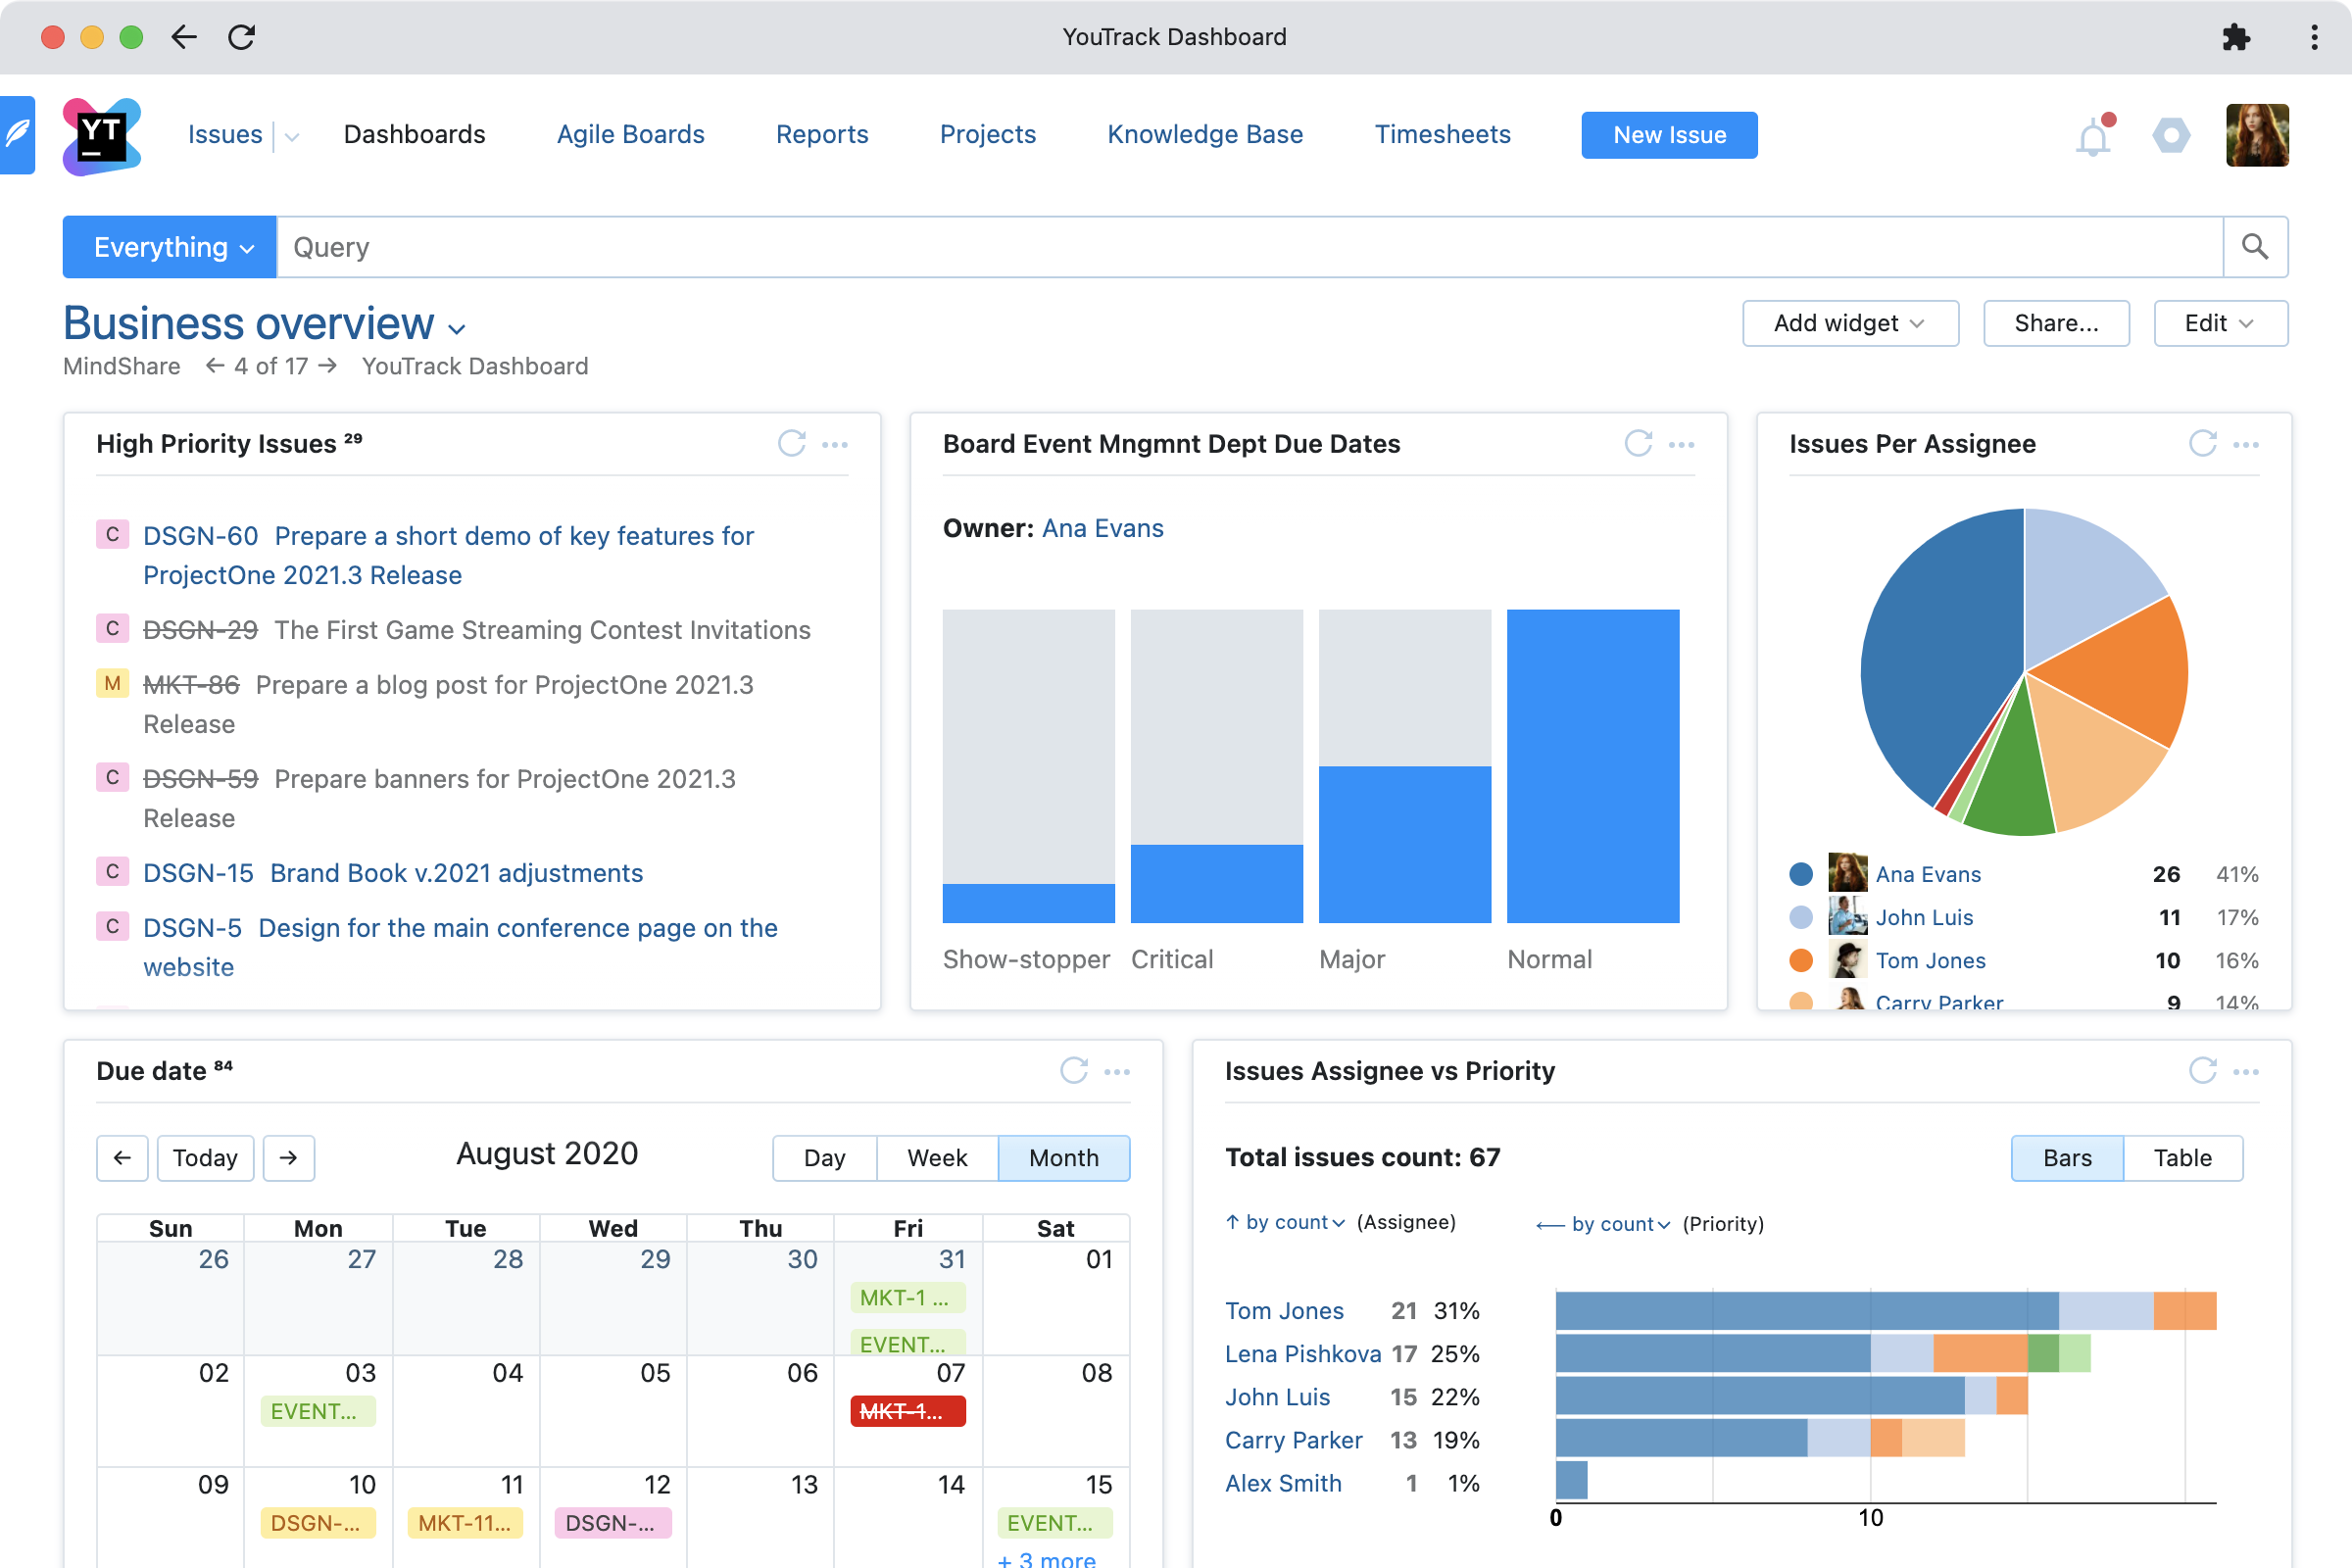
Executive overview dashboard
It is possible to create a dashboard that can act as an executive summary showing the state of health of all projects in the organization. This kind of dashboard visualizes high-level operational data and can help highlight bottlenecks that may require further investigation at team level.
Team or project dashboard
This is a dashboard giving an overview of a team’s current tasks, progress, upcoming deadlines, work rate, and time tracking data. This dashboard provides a team lead with a concise picture of the team’s current tasks, and helps with making planning decisions based on workload and capacity. It highlights bottlenecks that can be remedied by redistributing tasks among team members. Don’t keep it all to yourself, though – you can share access to this dashboard with your whole team!
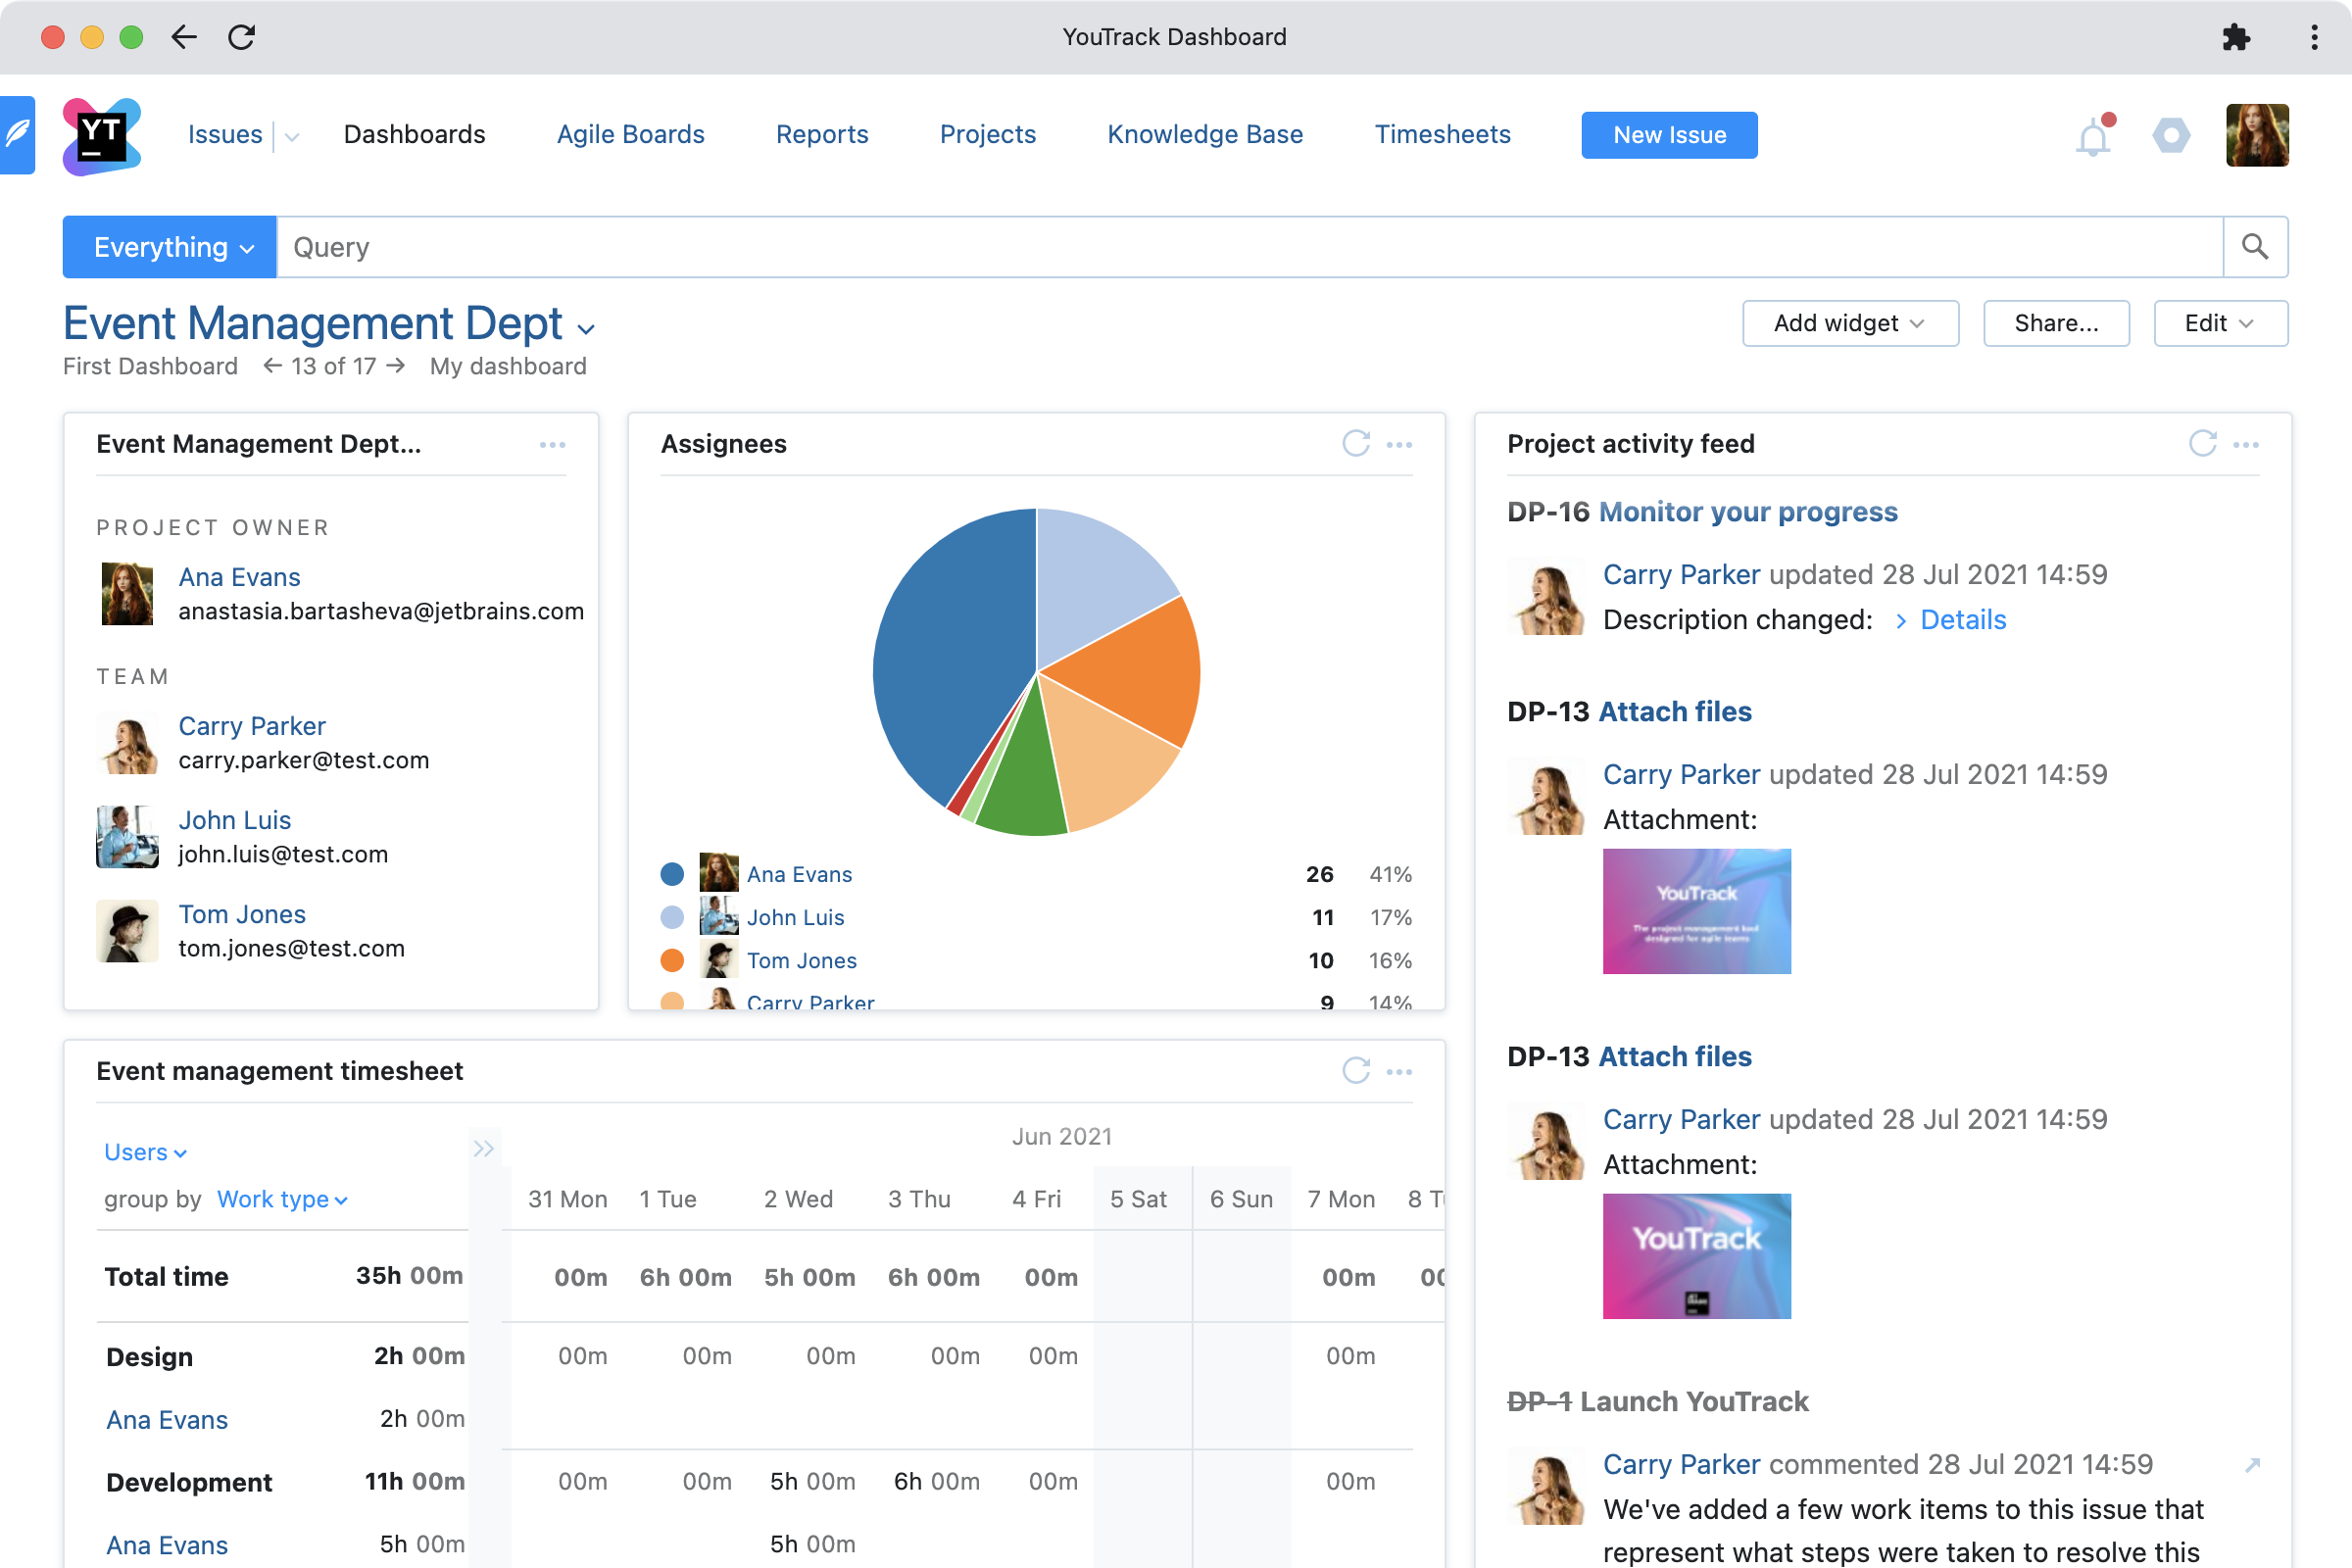
Example configuration:
- Project team widget – displays a list of members of a specified project with links to their profiles. It is like a quick-access user directory for your team.
- Project activity feed – gives a quick view of all recent updates.
- Due dates calendar – shows the issues with deadlines coming up in the current week or month.
- Issues per assignee widget – lets you visualize workload distribution across the team.
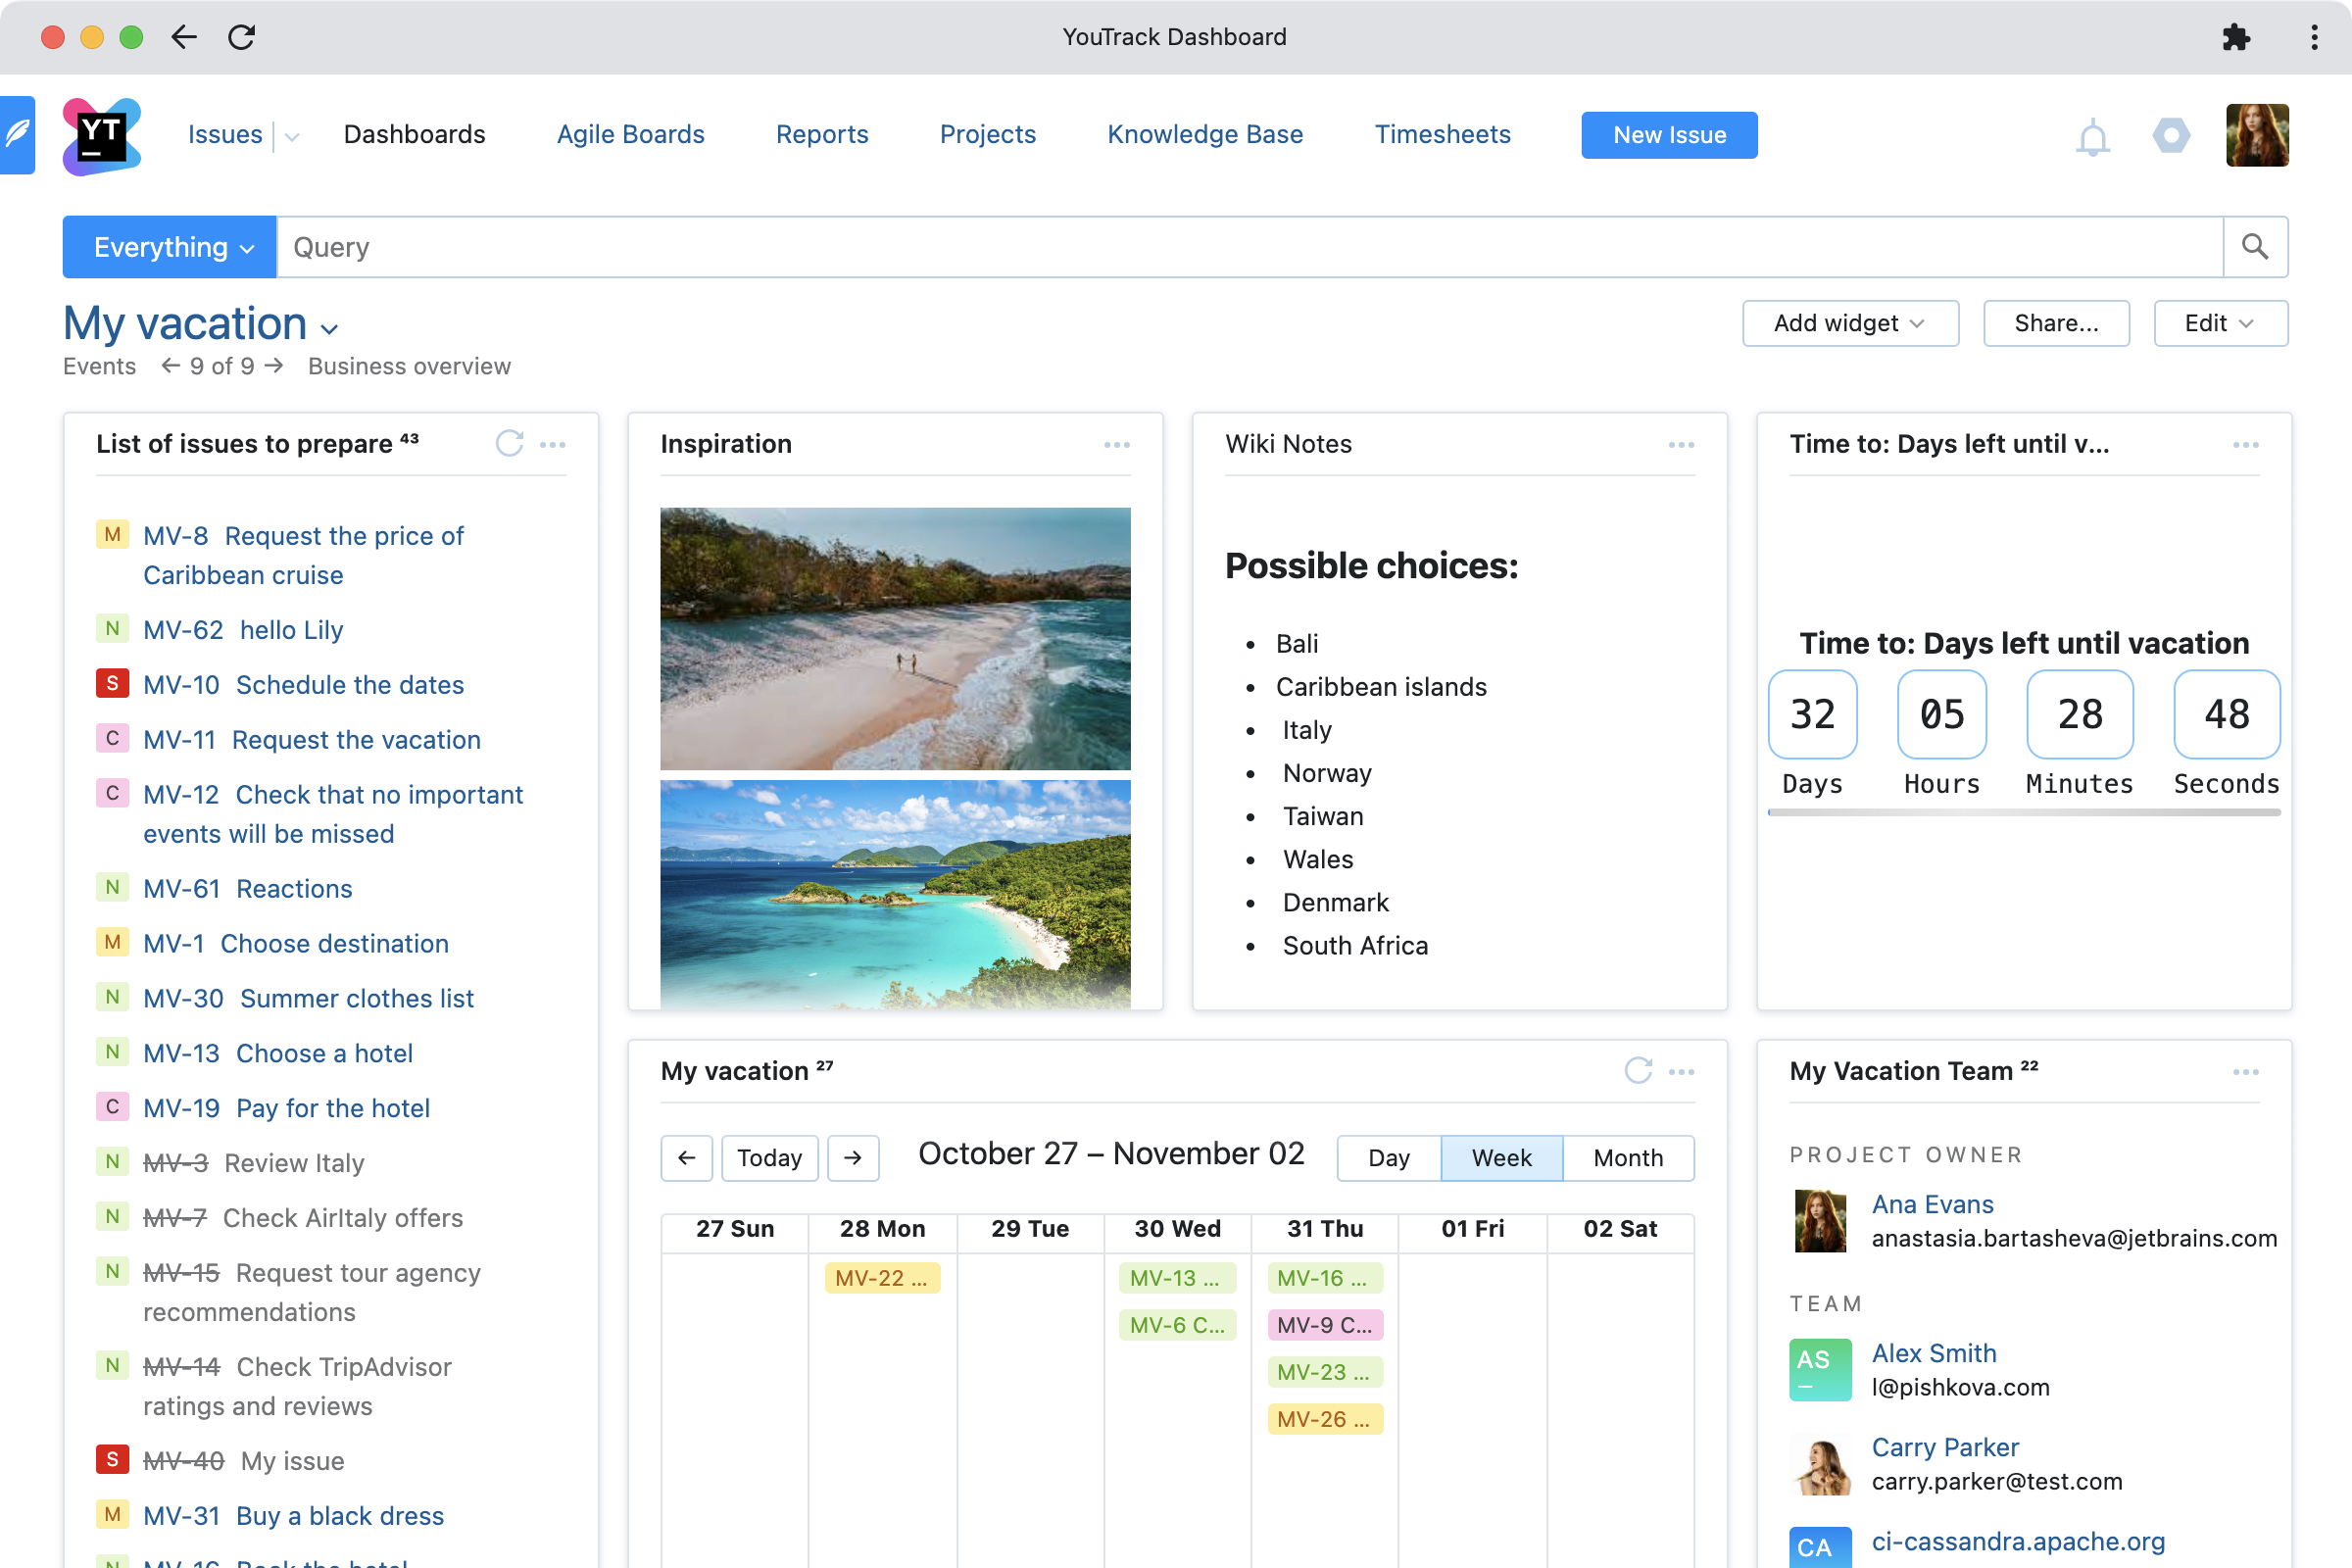
Personal dashboard
This dashboard can help you see all your tasks and prioritize them. The due dates calendar widget lets you see upcoming deadlines so you can start to plan ahead.
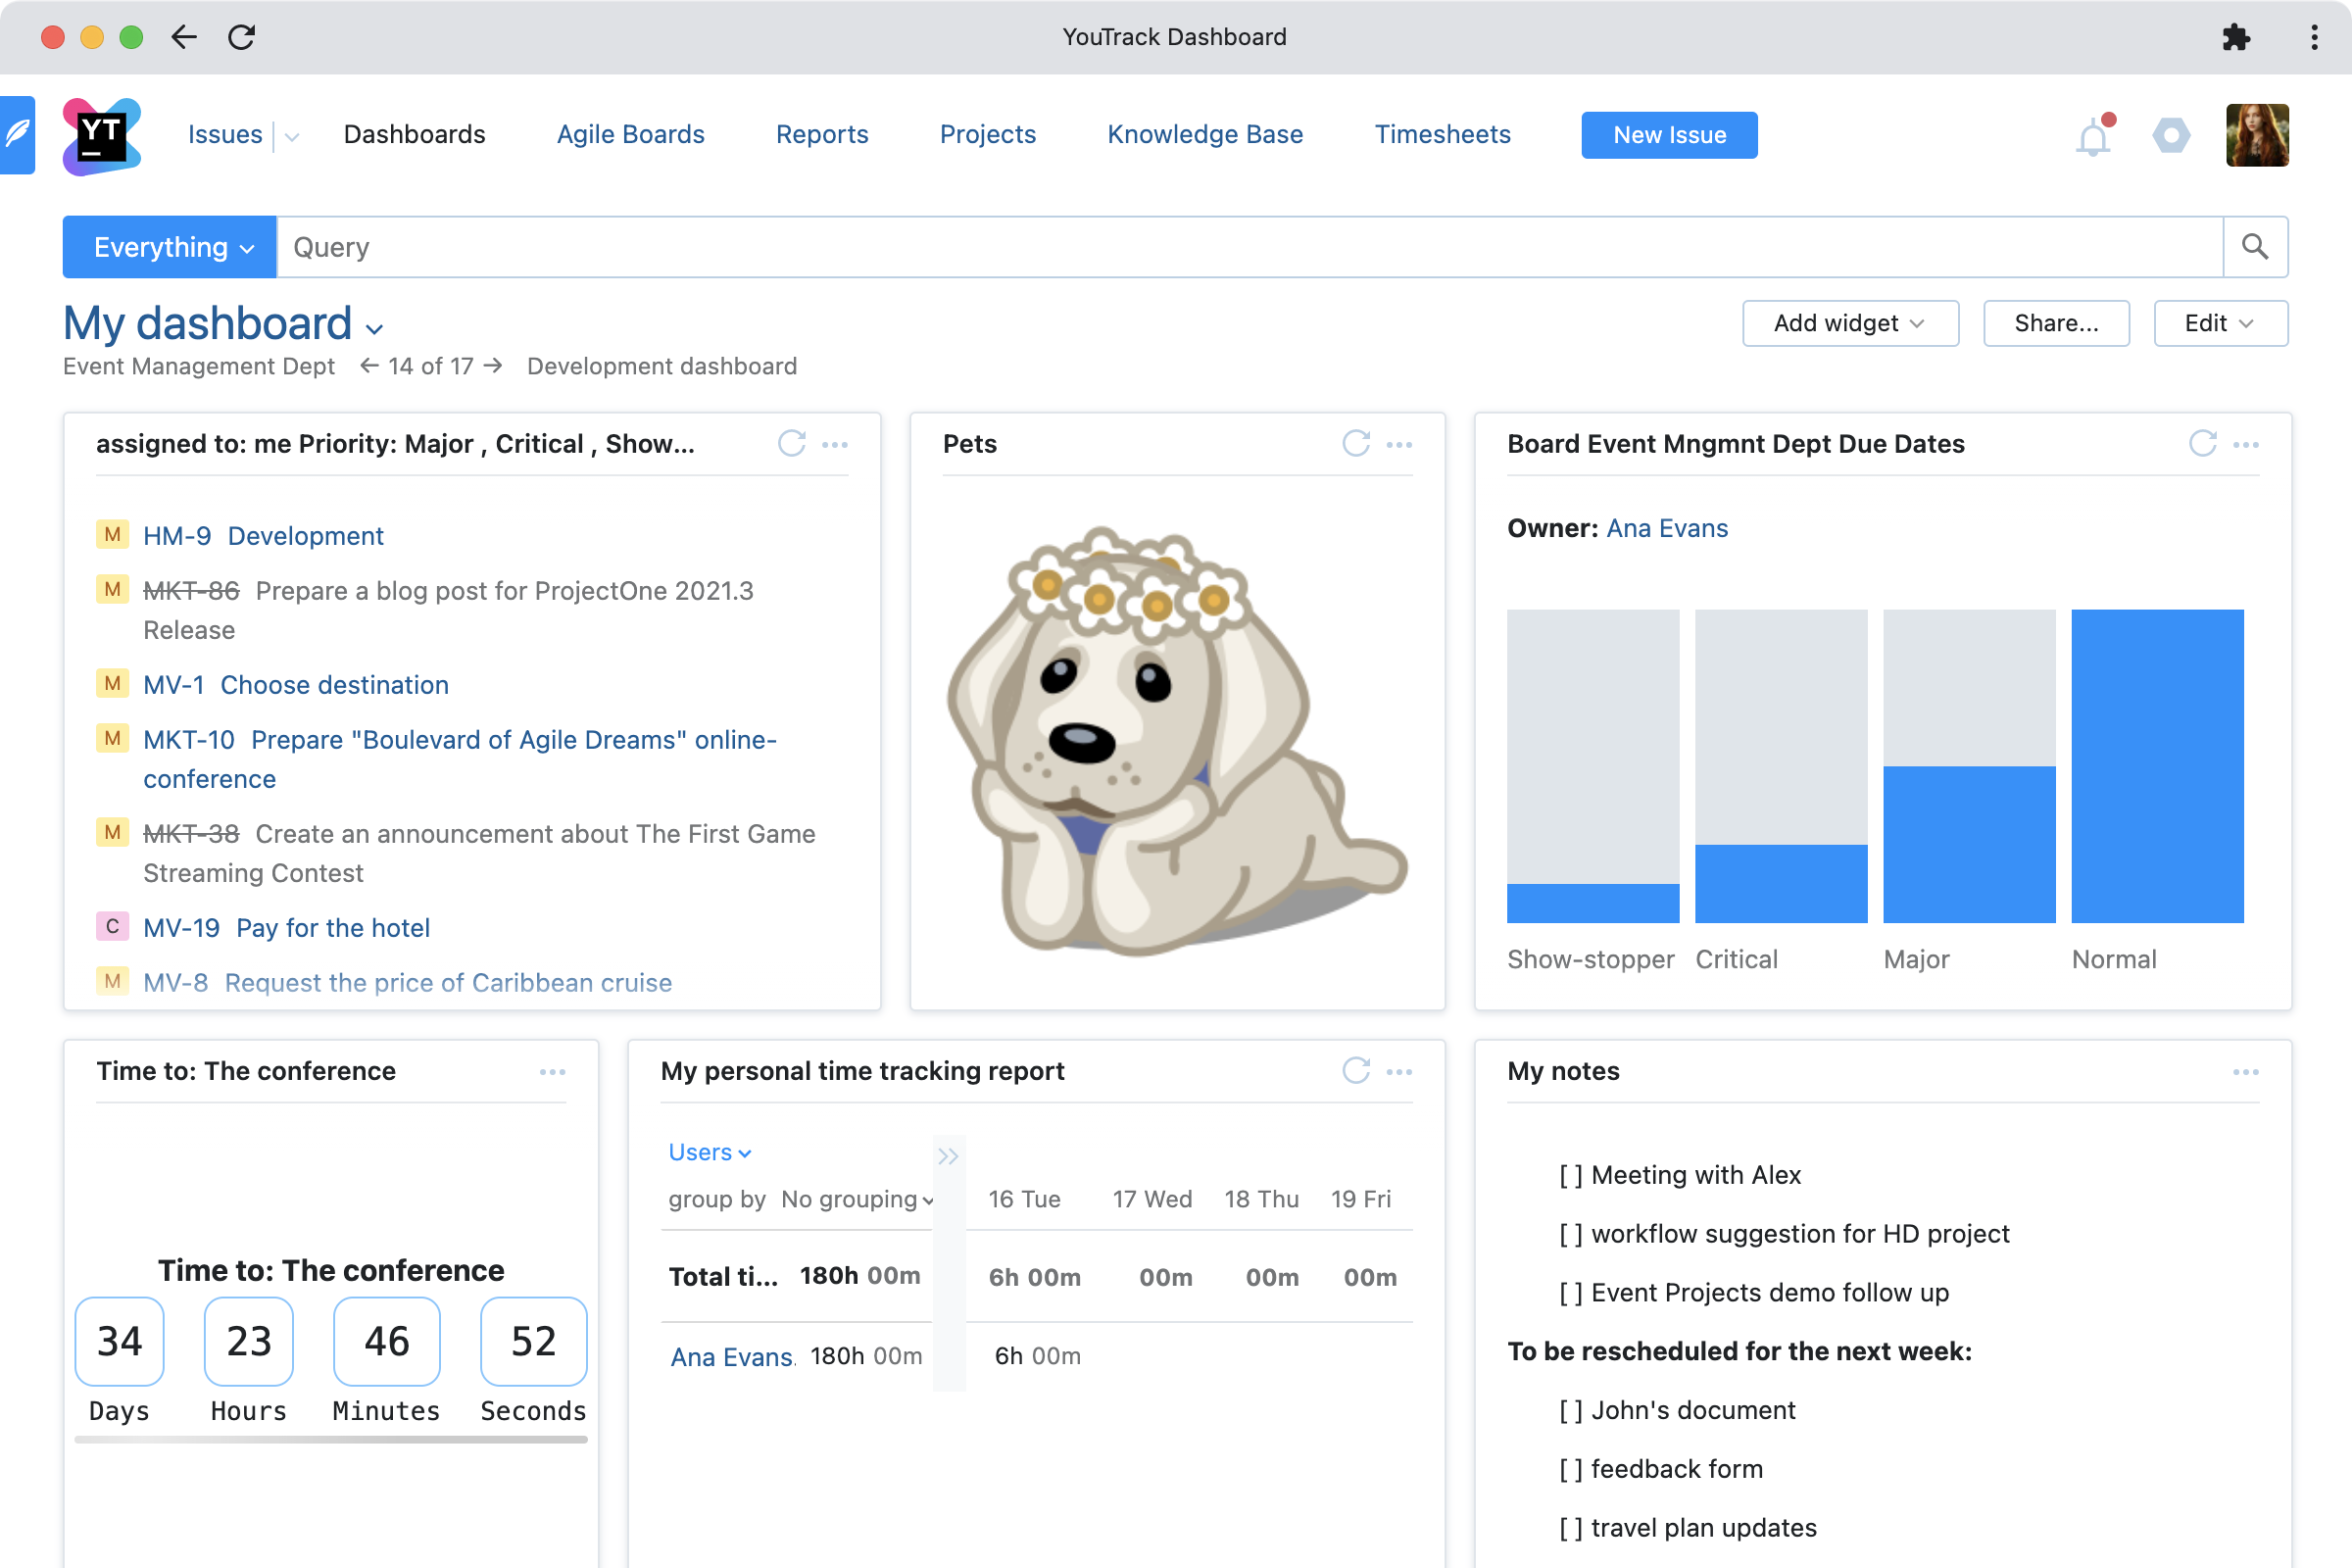
Example configuration:
- Your issues are filtered by priority and/or by status: to do; in review; waiting for reply, or testing; and so on.
- A personal time tracking report for the current week or day.
- Personal to-do notes.
- Some fun stuff like pictures of your favorite pet, or a countdown to your next vacation.
Development dashboard
Give yourself and your team peace of mind (or motivation to pick up the pace) with a clear view of sprint health indicators.
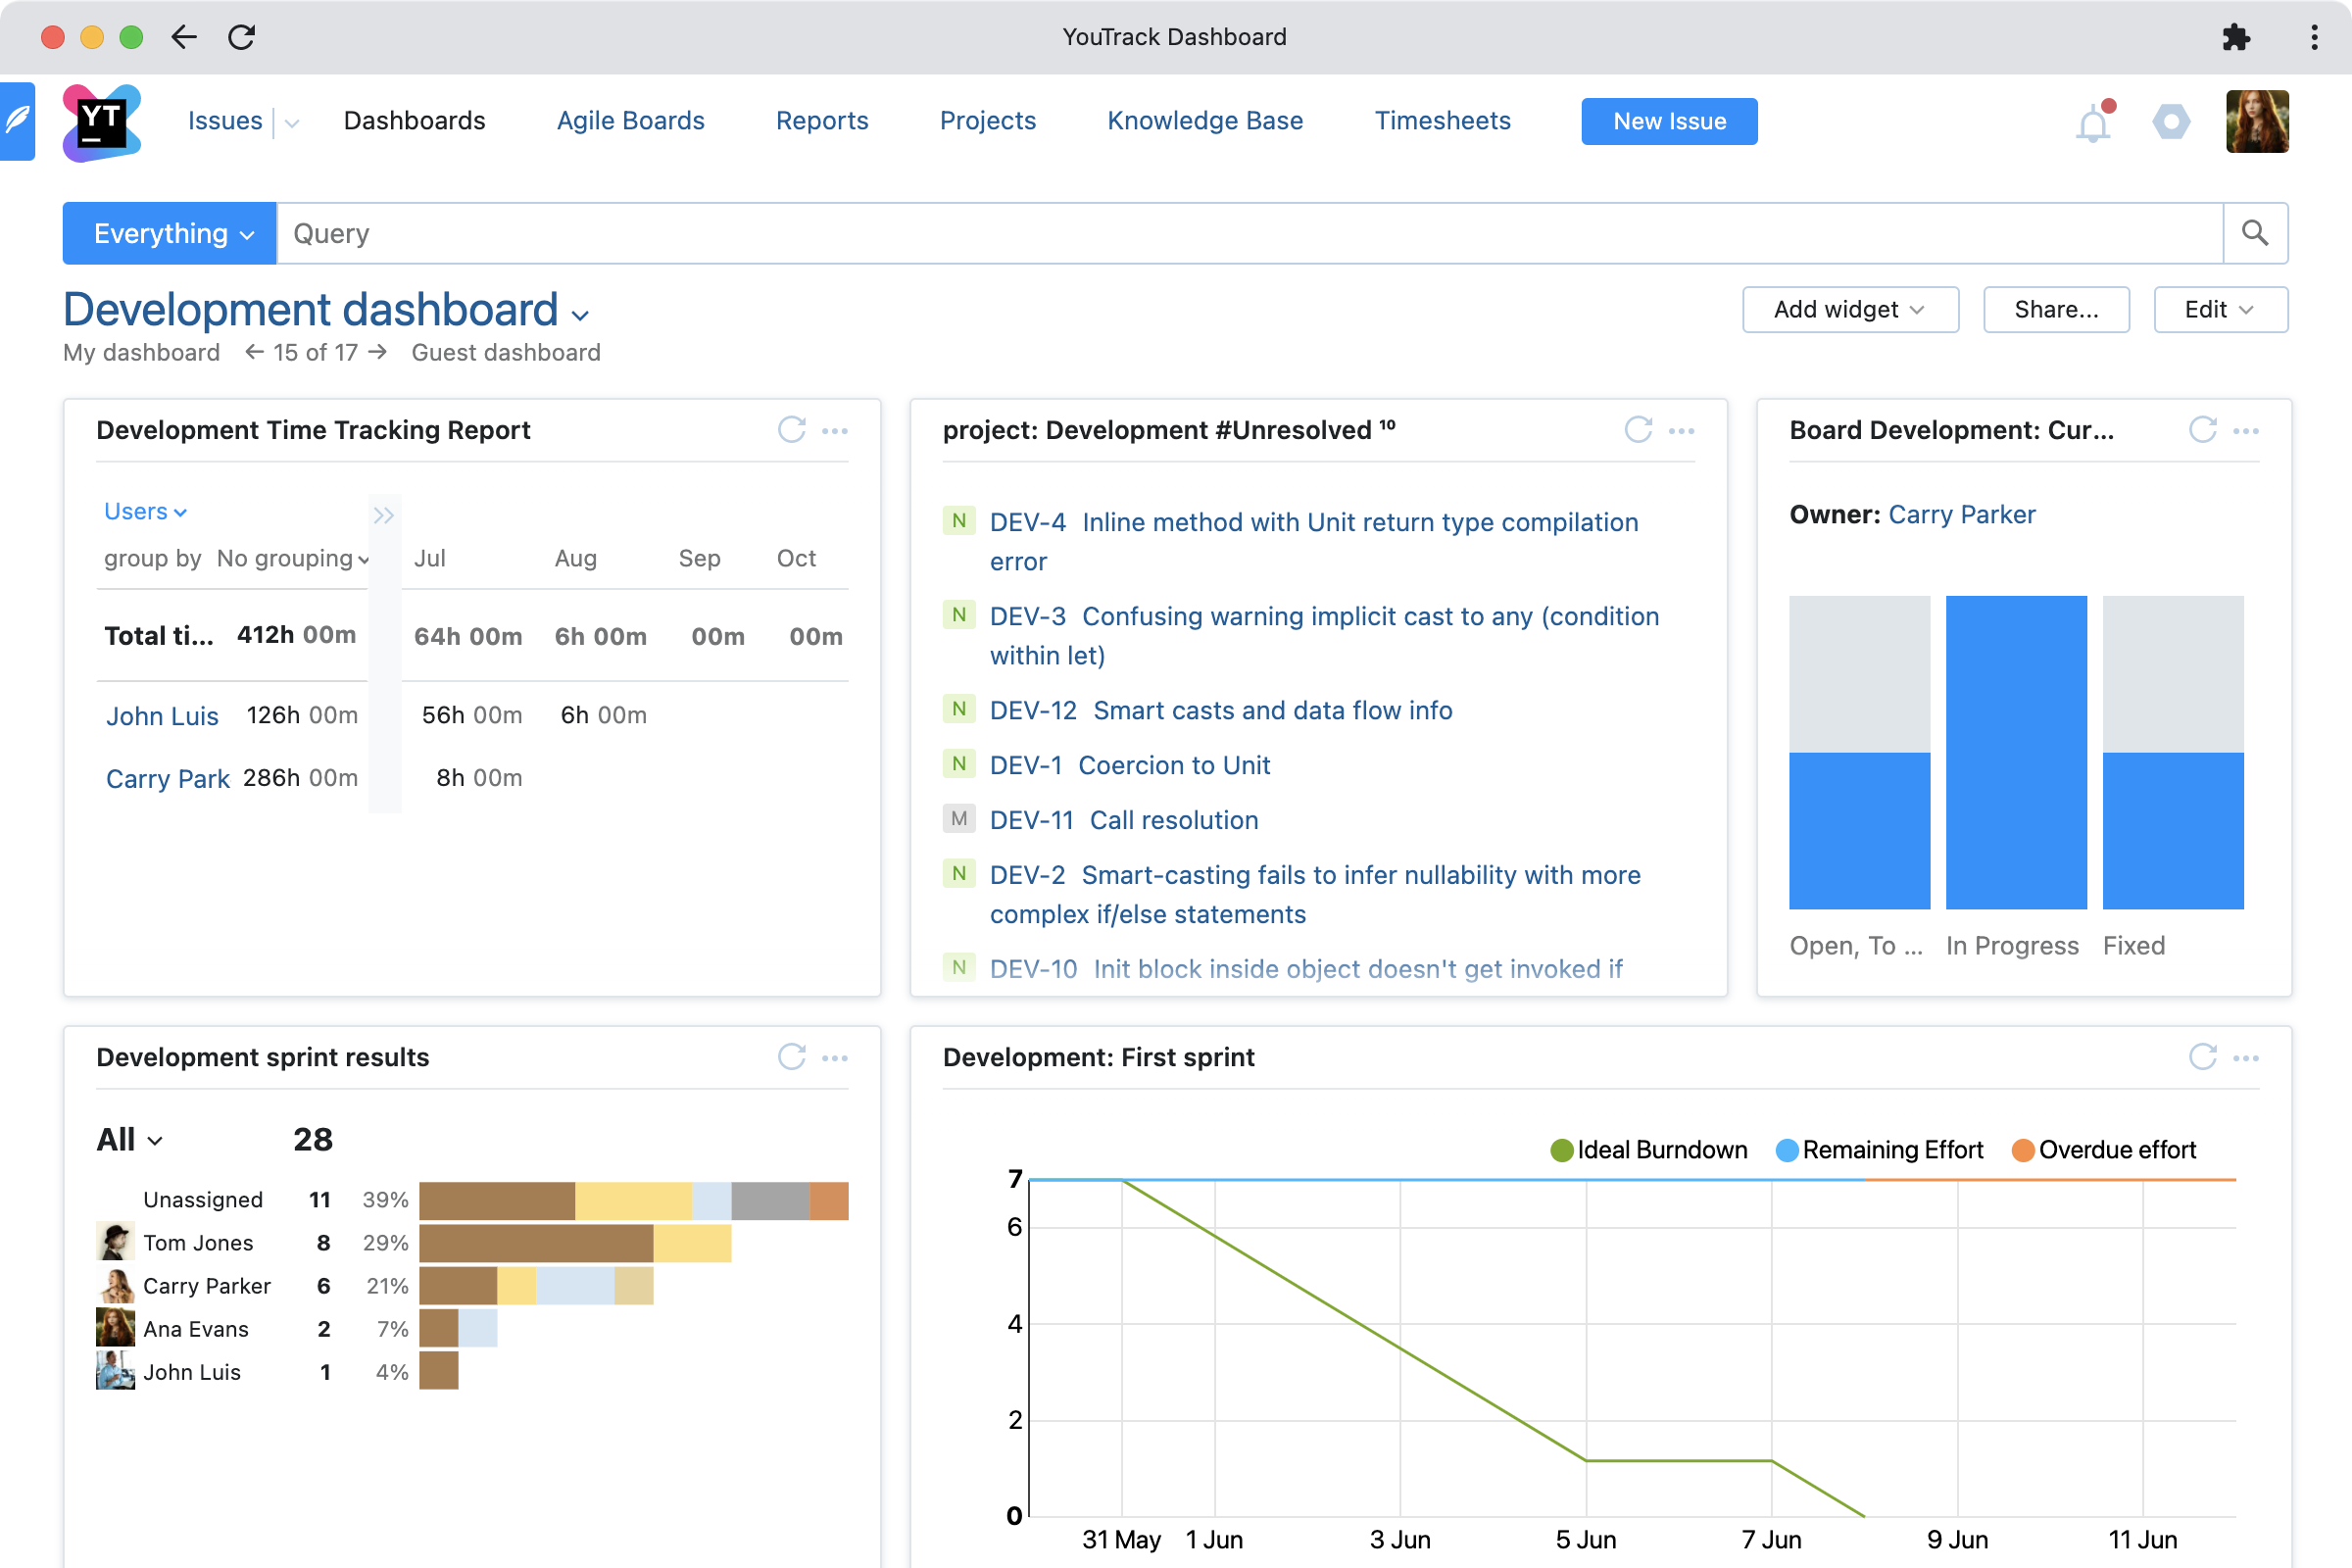
Example configuration:
- Development sprint results – the example below is a report based on two fields.
- The state of the current sprint on the agile board – so you can quickly see how much is Open, In Progress, and Fixed.
- Report widget with burndown or cumulative flow chart – keep track of the sprint progress or the team velocity (or both!).
- Time Tracking Report widget – compare the actual time spent with estimates, and make sure that all billable hours are accounted for.
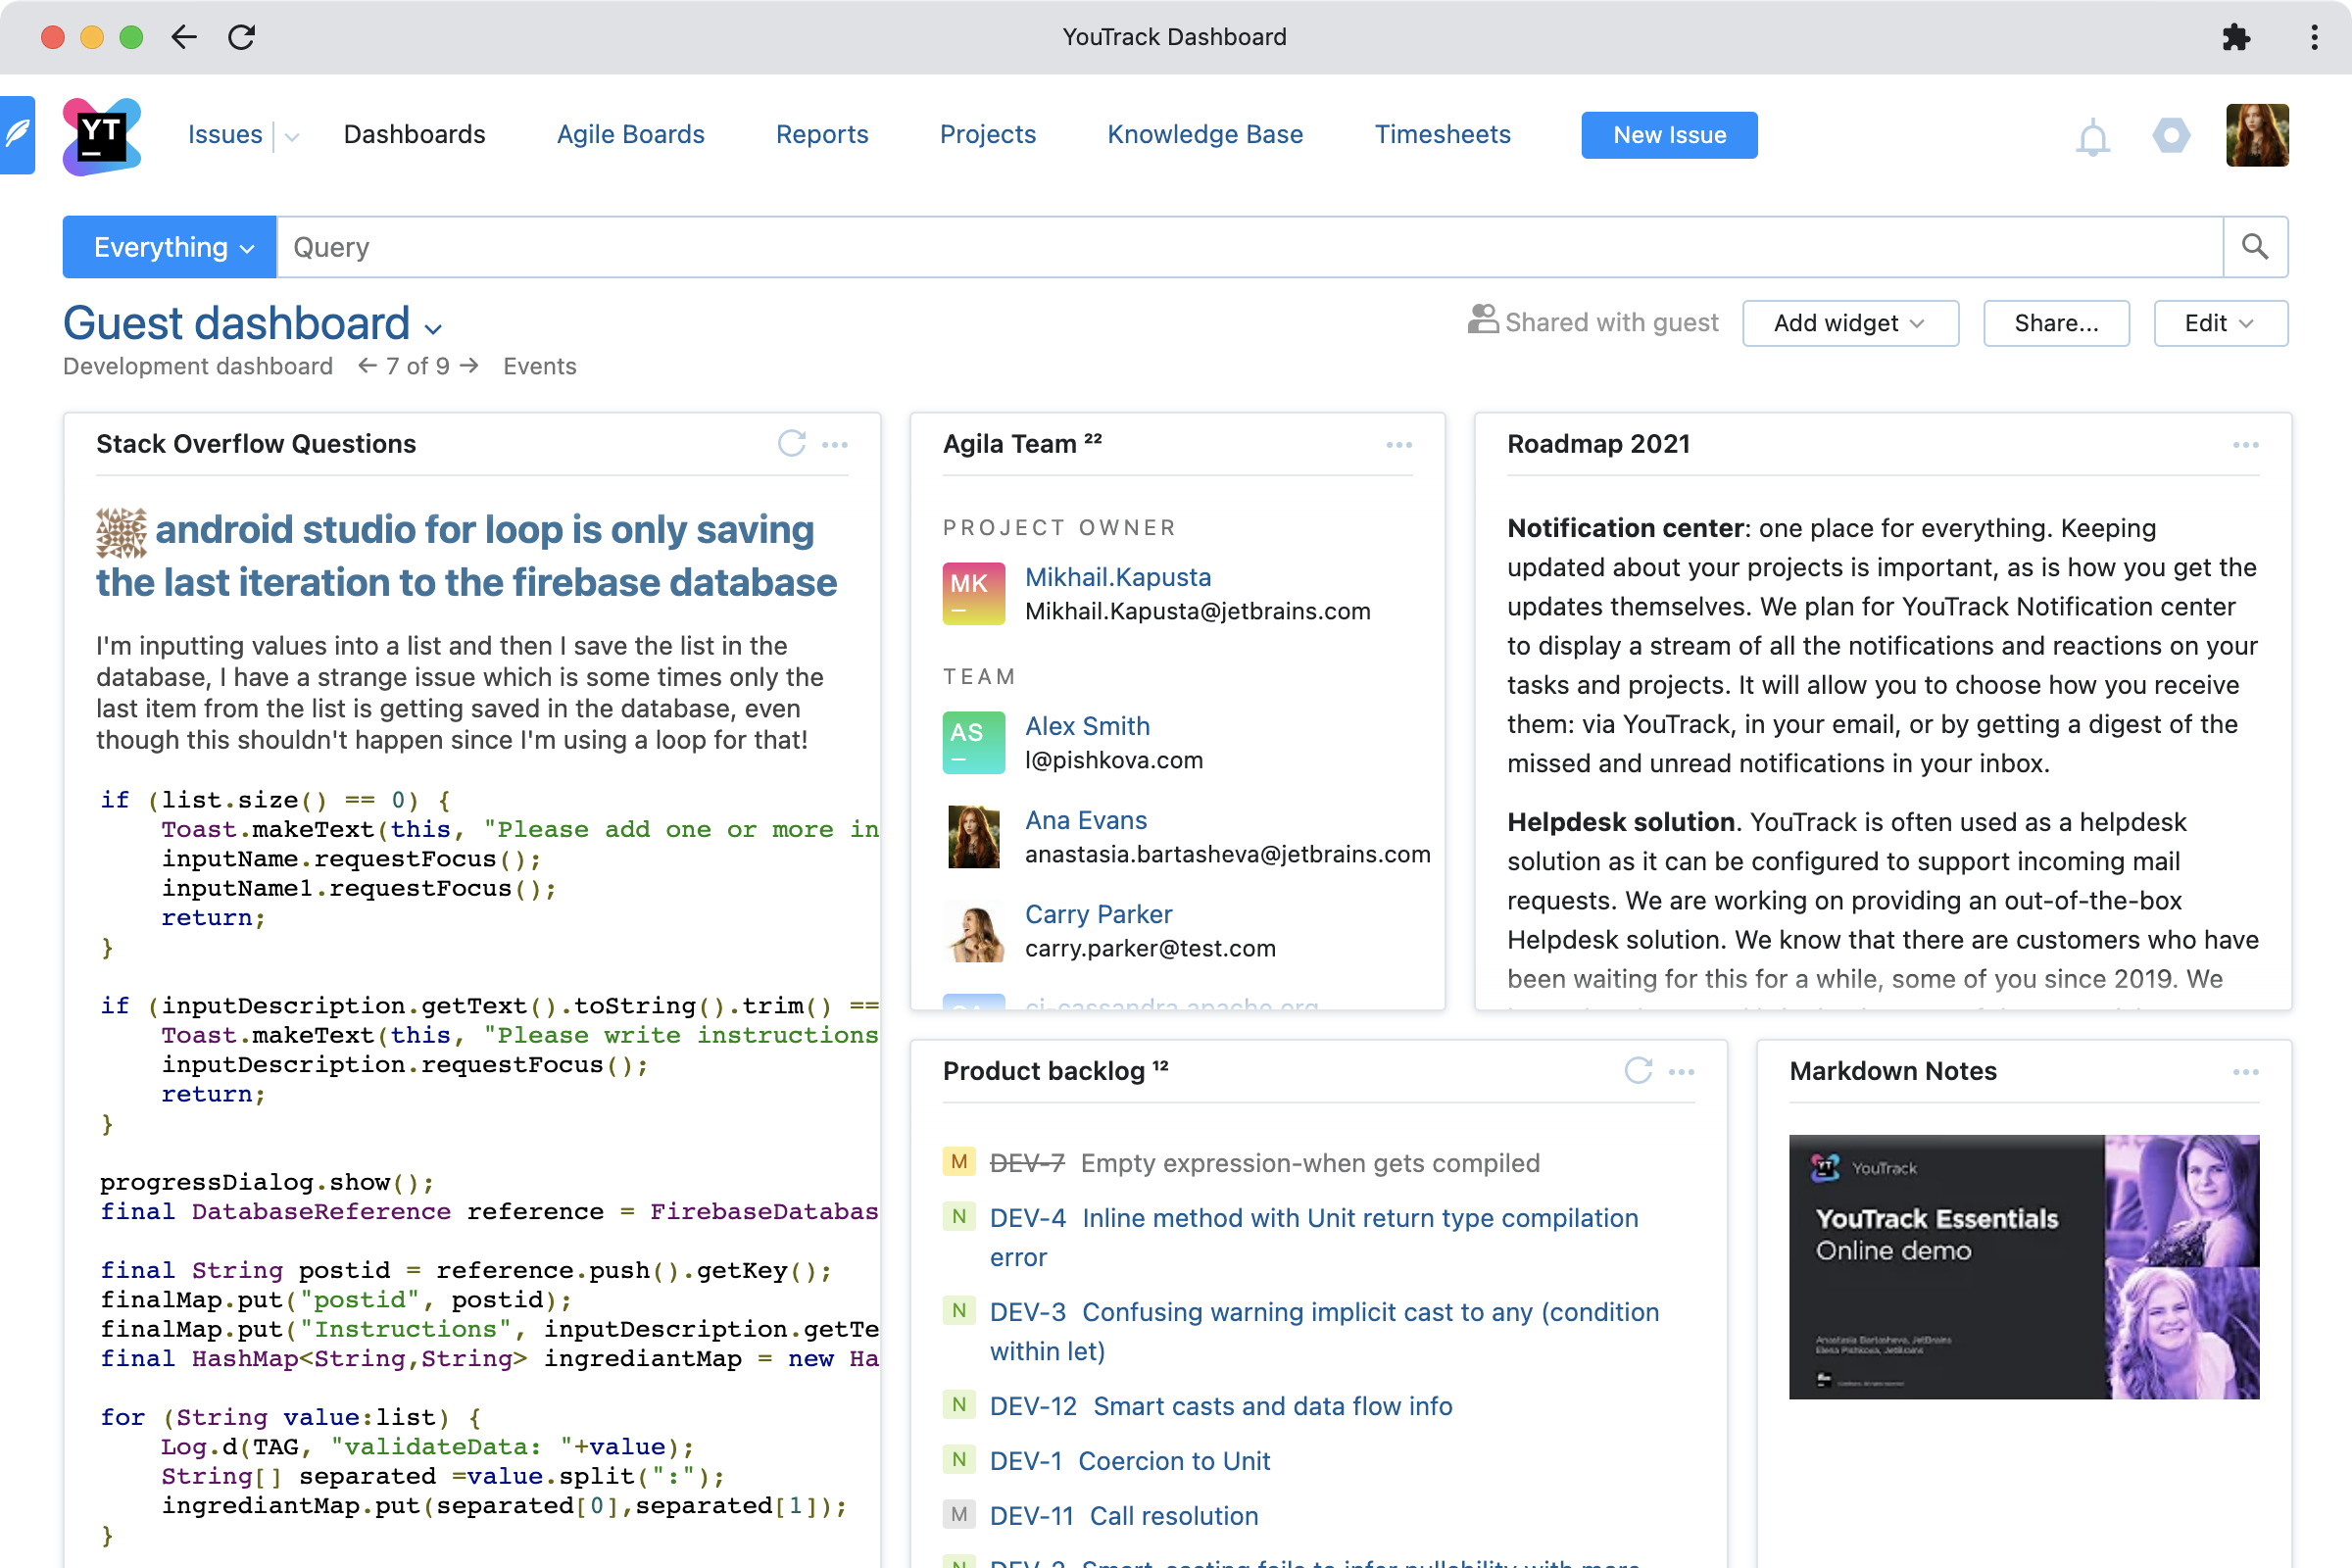
Guest dashboard
A guest dashboard can be used as a landing page that gives customers an overview of the development and support activities, and as a portal into your support service. Remember to enable guest access.
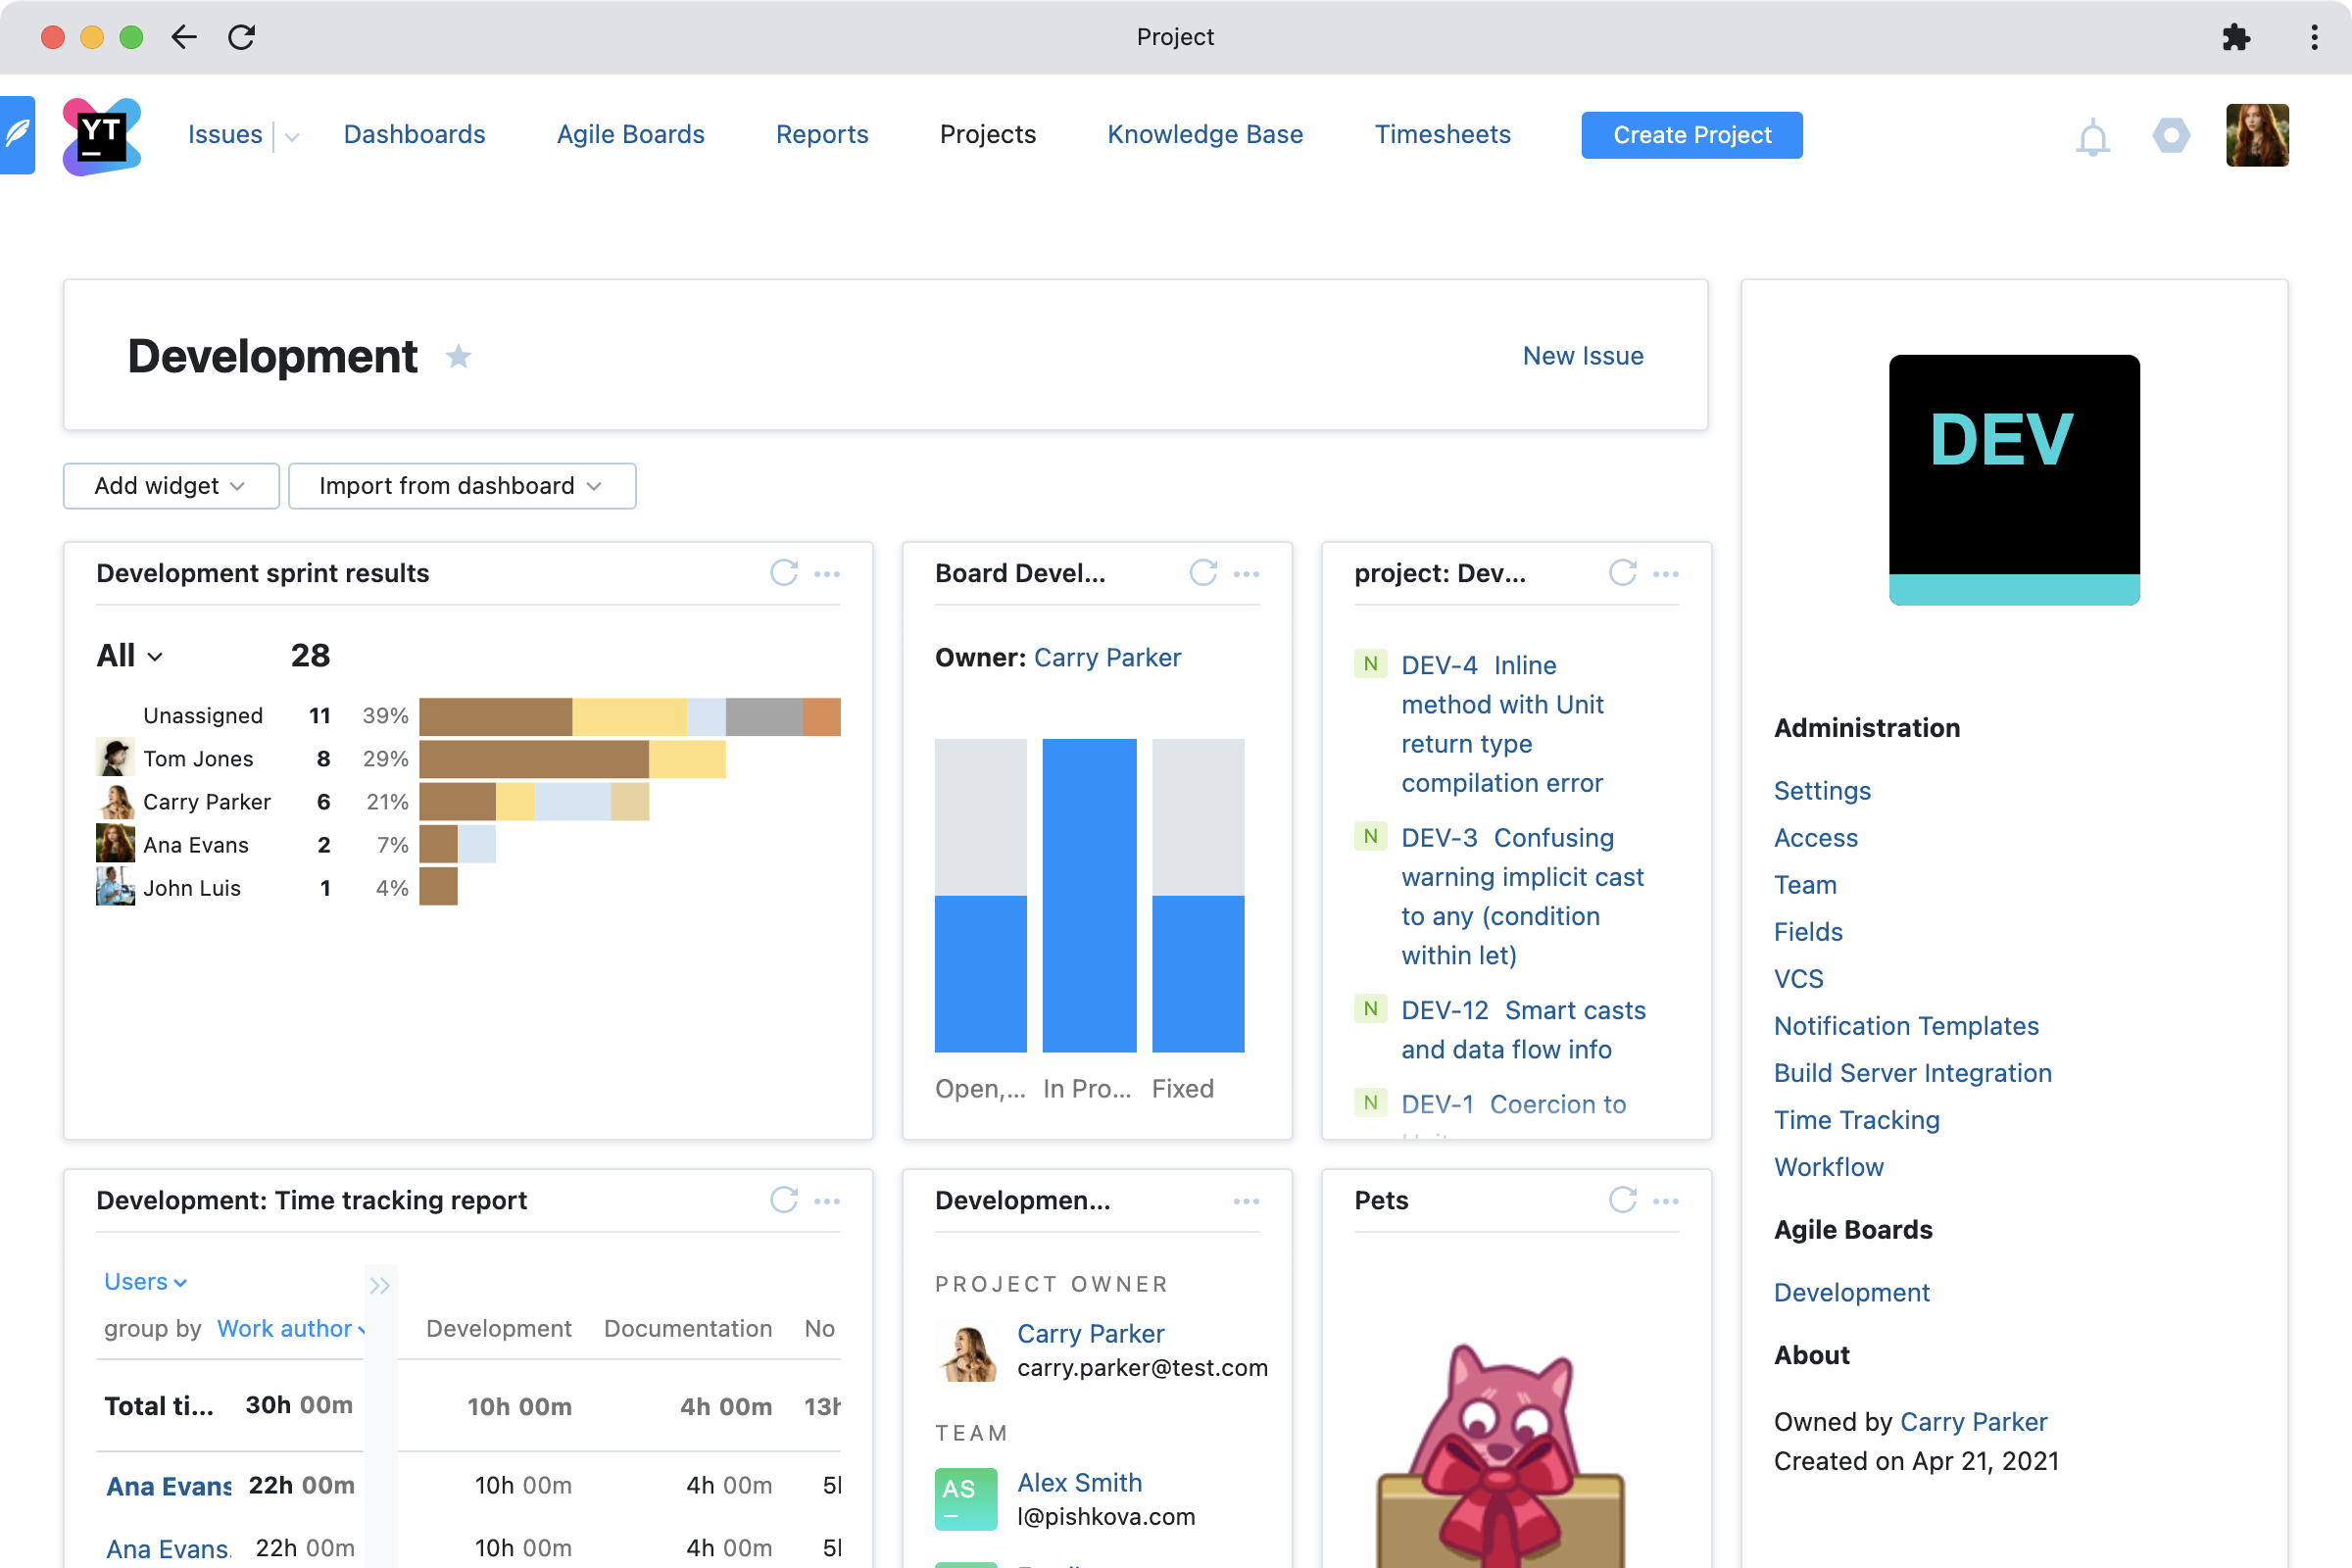
Project page
Project pages are very similar to dashboards and also support widgets. You can import widgets from existing dashboards to a project page. In this case, the widgets’ original settings are preserved.
With the right setup, a project page can be a useful portal or landing page for both customers and internal users.
Top tips for using Dashboards
Create more than one dashboard
Don’t try to cram all your widgets into one dashboard – that’s not how they’re supposed to work! Create separate dashboards to group related widgets and provide overviews of individual projects, and try to avoid vertical scrolling. Resize and rearrange widgets on your dashboards to make the best use of screen space.
Organize your dashboards
You can change the order of dashboards to keep related information together, and add the dashboards you use most often to favorites for quick access.
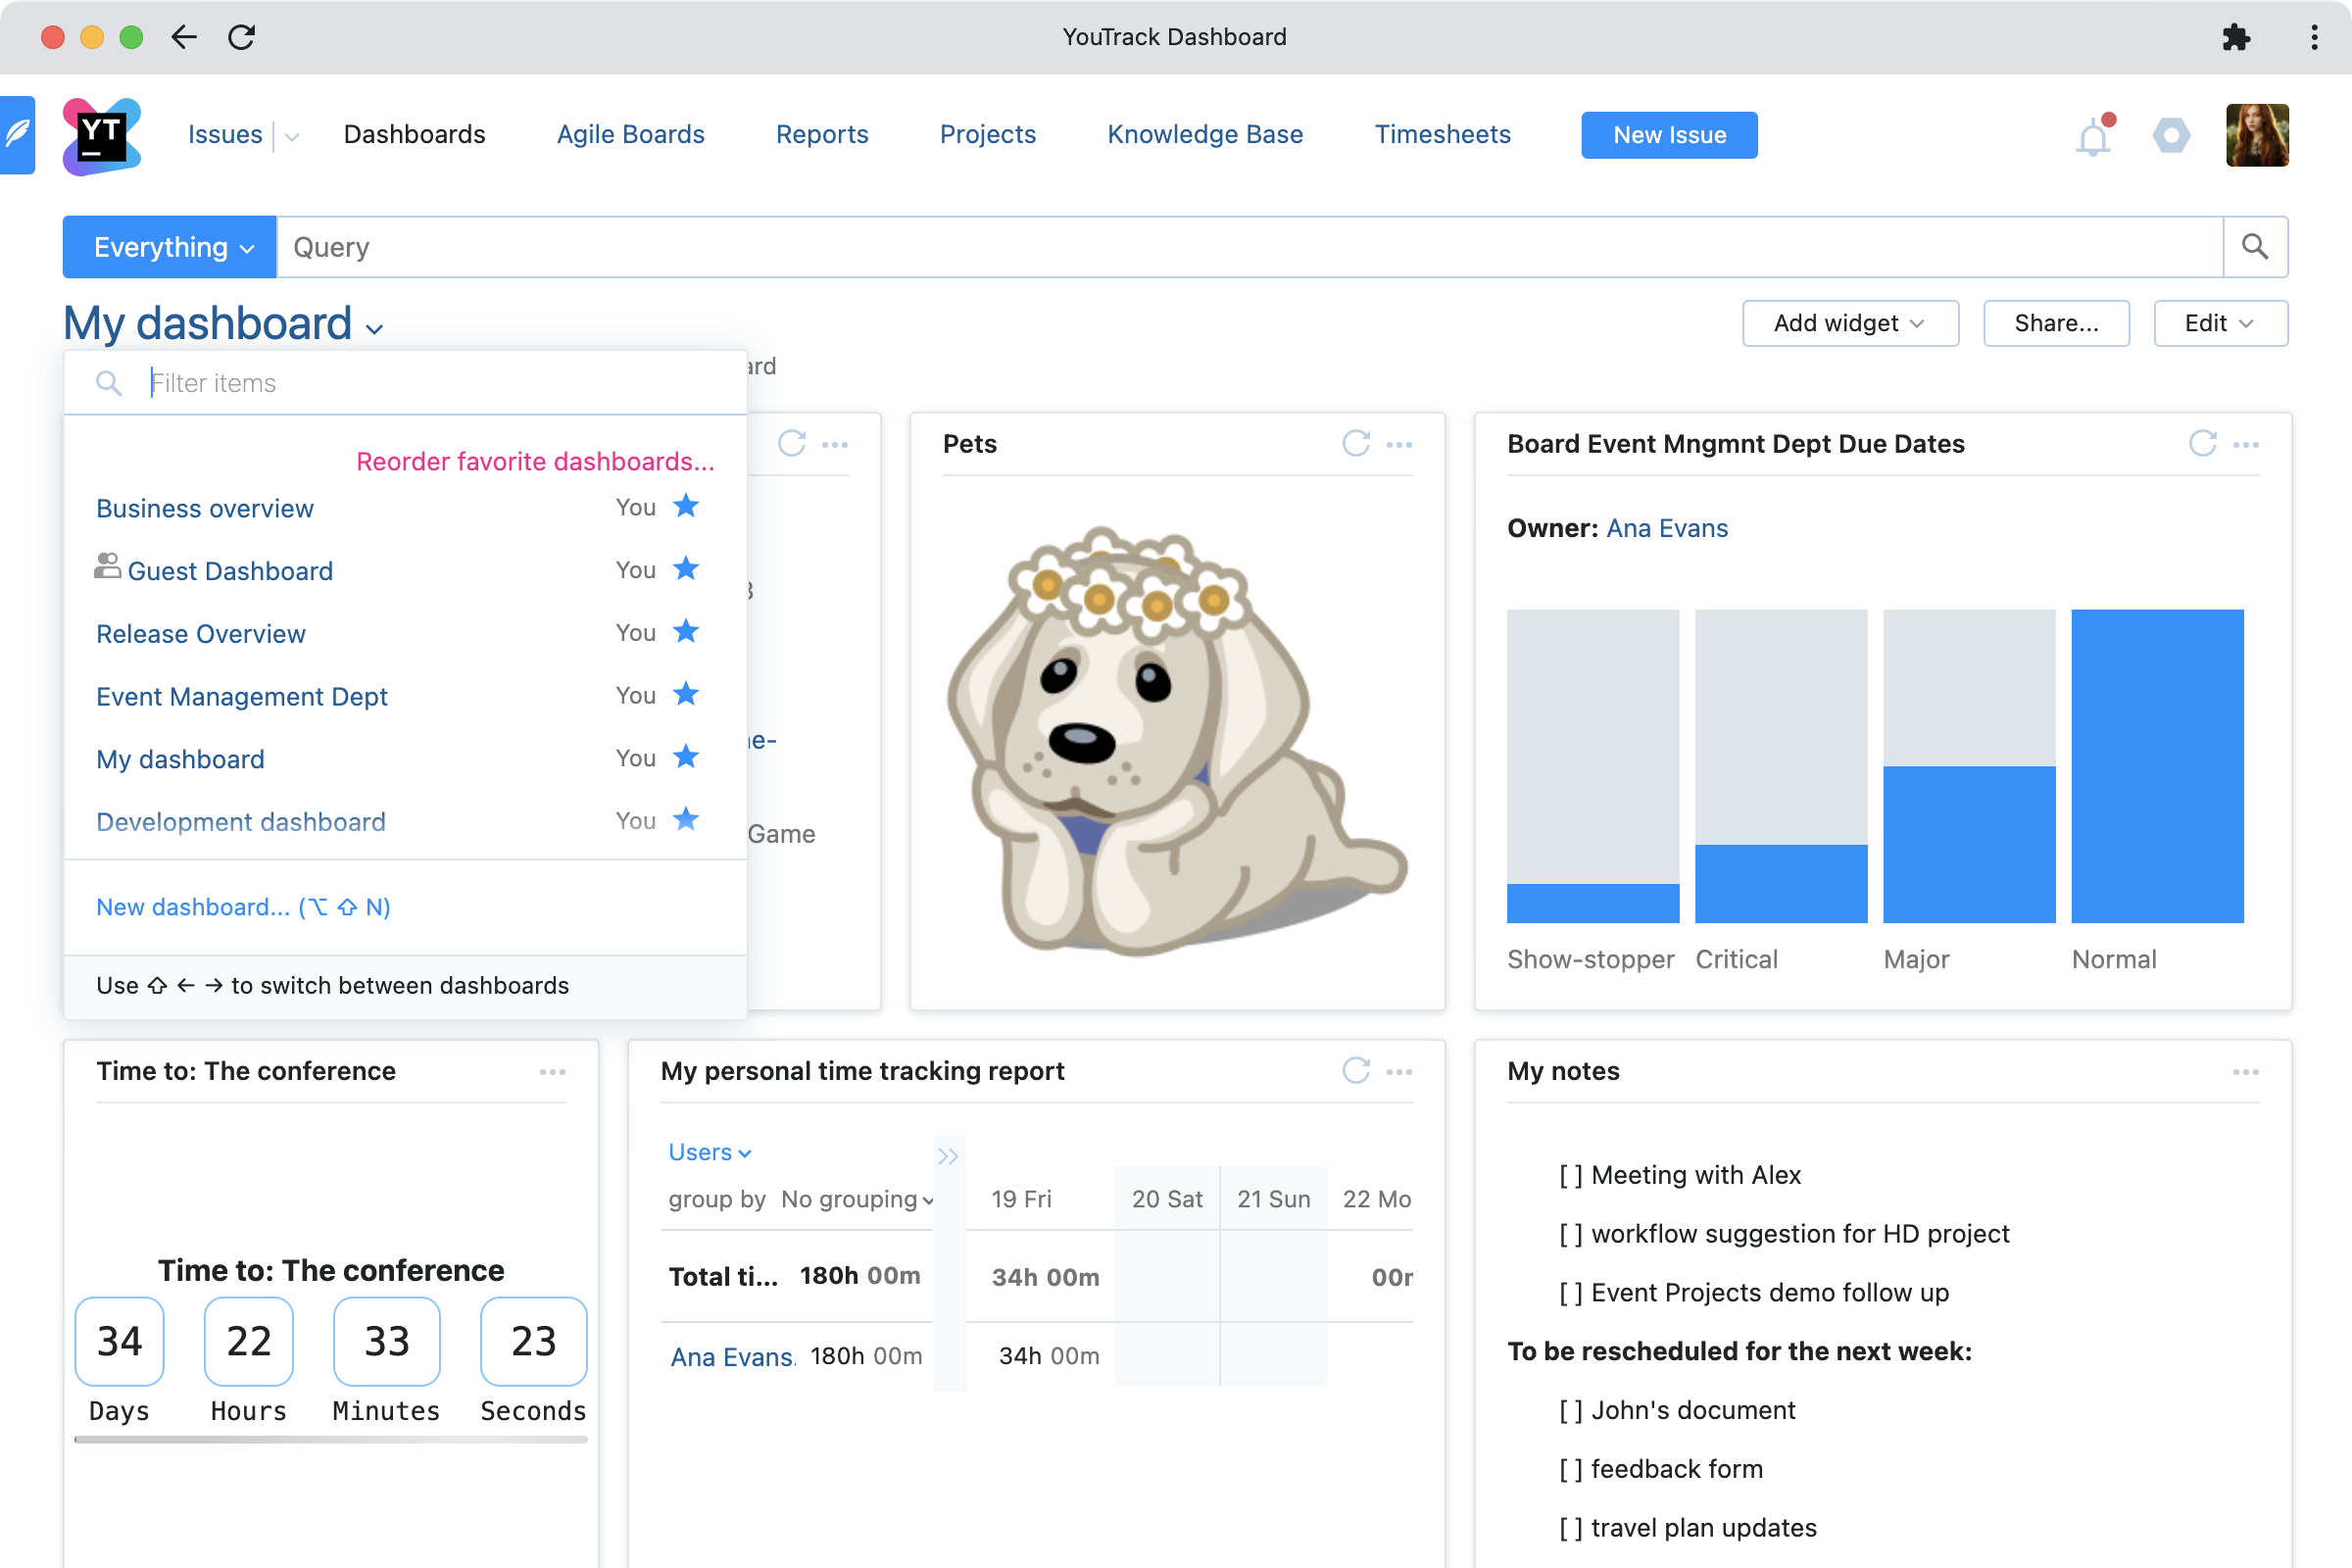
Use keyboard shortcuts
If you need to use multiple dashboards to display all the information you need, keyboard shortcuts are the most efficient way to navigate through them! Simply press Shift+Left Arrow and Shift+Right Arrow to cycle through your dashboards.
Share individual widgets
Sometimes you won’t want to share a whole dashboard, but you might want to share the information in a specific widget. The people you share a widget with can add it to their own dashboards, but you remain in control of the widget’s settings. This is a great way to broadcast reports to other teams or share current information; just remember that users will also need permission to view the information displayed in your widget.
Manage your widgets
YouTrack comes with a default selection of widgets enabled, but there are more available for you to install from JetBrains Marketplace, like the Agile widget and others that we used in example configurations above. As an administrator, you can also disable or delete widgets that you don’t want anyone to use. If you can’t find a widget that meets your needs, you can also code your own.
Hopefully this post has demonstrated how dashboards are more than just collections of colorful charts and graphs on the TV in the meeting room. If you have any questions about configuring or using dashboards and widgets, let us know in the comments below! If you run into any problems, don’t hesitate to contact our support team.
Your YouTrack team