.NET Tools
Essential productivity kit for .NET and game developers
Introducing EAPs for dotTrace 6, dotCover 3, dotMemory 4.2
Please welcome a new ReSharper 9 EAP build that comes along with compatible dotTrace 6, dotCover 3 and dotMemory 4.2 Early Access builds.
Download the common .NET tools installer, launch it and choose the products you want to try.
We’ve done a great amount of work on the UI side, resulting in a more pleasant and easy-to-use profiling experience with dotTrace 6 EAP. A number of new features were also implemented, as well as the new and powerful timeline profiling option. Let’s have a look at what’s new.
dotTrace Home
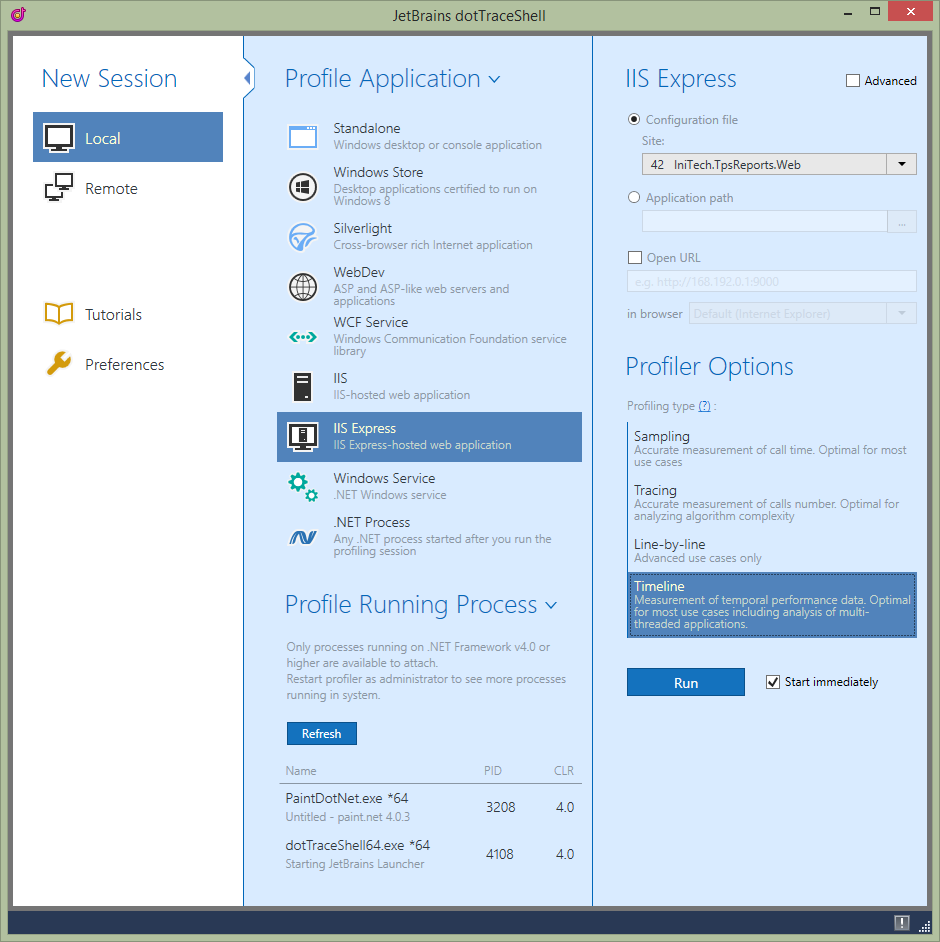
When launching dotTrace 6, we’ll be presented with an all-new starting point: the dotTrace Home. From here, we can start a new local or remote profiling session for known .NET application types, attach to a running process and configure our profiling session.
Every application type will offer different settings for running the application we want to profile. Ticking the Advanced checkbox will provide us with additional options, such as using the profiler API.
If you’re new to performance profiling, check the Tutorials section on the home screen. We’ll guide you through how dotTrace works and how to analyze the data that was collected by the profiler.
Enhanced Profiling Controller
After launching a profiling session, we’ll see a new profiling controller open. We can use it to start the profiler, generate a snapshot, specify whether the profiler should continue capturing data or not, detach the profiler, or kill the running process.

With dotTrace 6 you can expand the profiling controller, providing you insight into the realtime CPU and memory usage of your application.
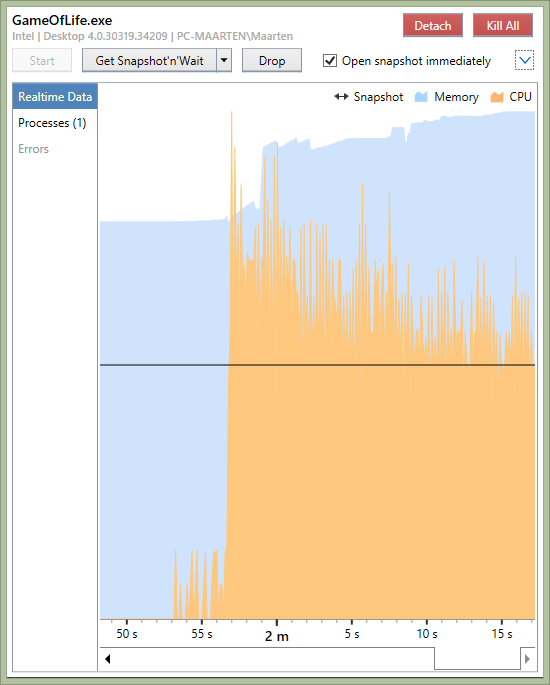
When our application runs multiple processes, we can select to profile any of them from the Processes page. Note that the Profile child processes option must be enabled for this to take effect.
Timeline Profiling
We’re introducing a new profiling type with dotTrace 6: Timeline profiling.
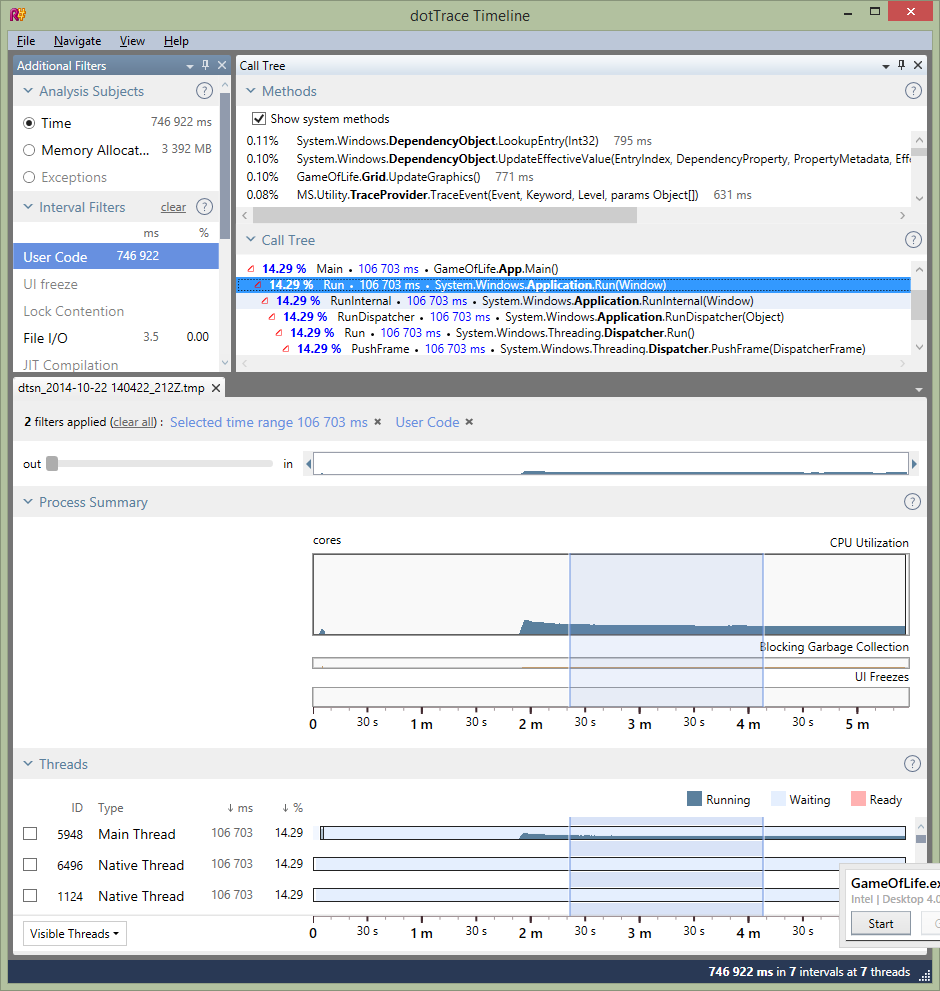
Timeline profiling collects temporal data about thread states, application events and other multi-threading data using Event Tracing for Windows (ETW). It comes in handy when analyzing multithreaded applications and lets us determine the cause of UI freezes, excessive garbage collections, uneven workload distribution, insufficient I/O and so on. The main advantage of Timeline profiling is that it not only allows us to see which calls were made by our application, but also how these calls were distributed over time.
Analyzing timeline profiling snapshots is similar to analyzing other profiling type results, with one difference: everything is bound to the timeline. We can view all events, or zoom in on a particular timespan of our application’s runtime and analyze the call tree, threads, memory allocation, garbage collection and I/O events.
In general, we can use timeline profiling all the time: just like the other profiling types it collects call stack data and allows us to determine performance bottlenecks. It is unable to determine the exact number of performed calls, making it less suitable to analyze algorithms, but that’s where tracing and line-by-line profiling are the tools of the trade.
Dissolved and Hidden Subsystems
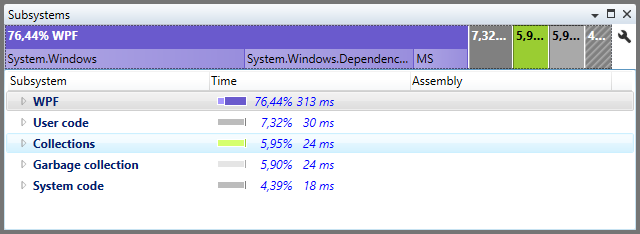
When analyzing profiling results, we get a broad overview of subsystems used by our application. This gives us a hunch of where most time is spent: in the UI, in user code, with Garbage Collection, with I/O and so on. We can even define our own subsystems.
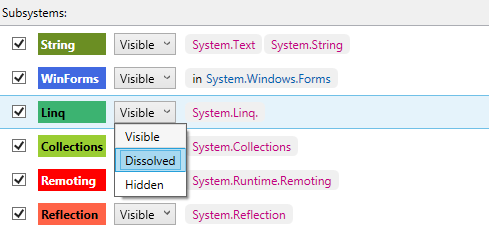
From the options, dotTrace now lets us dissolve or hide subsystems. By default, each subsystem is visible as an entry in the subsystems pane. Making a subsystem dissolve will account the call times to its caller. Hidden subsystems will not be counted in results.
Setting these options for existing or new subsystems lets us slice and dice the profiling results in such a way that we only see the data we’re interested in.
Various UI Improvements in dotTrace 6 and dotCover 3
dotTrace 6 is now sharing a unified UI framework with ReSharper, dotCover and dotPeek. This brings an experience consistent to Visual Studio to the latest version of our profiler. All tabs and panes can be docked wherever we want, or detached from the main window so they float around. Very useful in multi-monitor setups! dotCover 3 receives a new UI for configuration settings dialog box.
Code Coverage in dotCover 3 on a Remote Machine
Code analysis in dotCover 3 can be performed on a remote machine. Set up a server and run it as a console application or Windows service on a remote machine. To perform code coverage, one needs to navigate to C:\Users\username\AppData\Local\JetBrains\Installations\dotCover01. Then, launch dotCover.RemoteCoverageServer.exe and connect to the server from the menu ReSharper -> Options -> dotCover -> Remote Coverage. In this scenario all the coverage tests are running on a remote server. This can save you a vast of performance resources on your local machine.
The Customary Trial Pitch
Give the latest versions of dotTrace 6 EAP, dotCover 3 EAP and dotMemory 4.2 EAP a try! Download the common .NET tools installer and choose products to install. Please note that doing so will remove all previous installations of ReSharper and other JetBrains .NET tools from Visual Studio, plus VS2005 and VS2008 are not supported so far.
All feedback, comments, issues and suggestions are welcome in dotTrace, dotCover and dotMemory issue trackers or through the comments below.

