.NET Tools
Essential productivity kit for .NET and game developers
C# Interactive in Rider
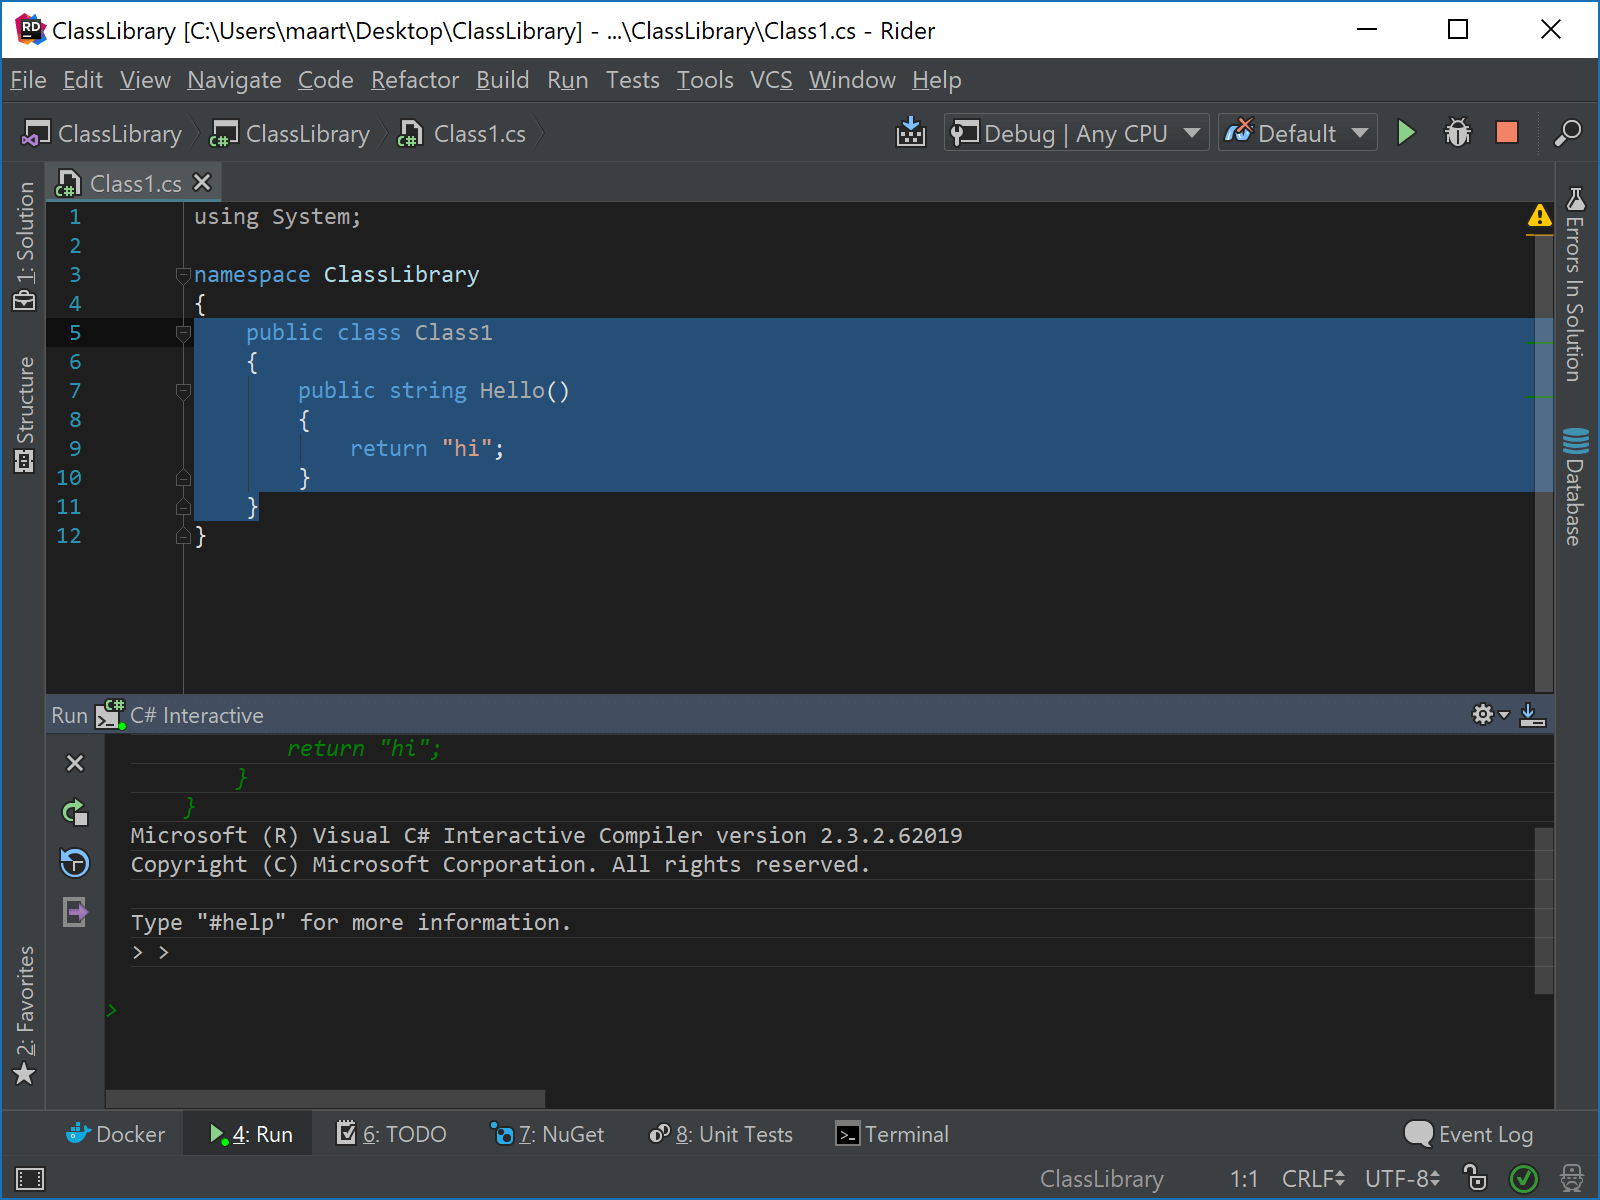
In the latest Rider 2017.3 EAP build, we have added a new C# Interactive tool window. It allows running C# statements without having to wait for compilation. This means we can get immediate feedback on what a given expression will return.
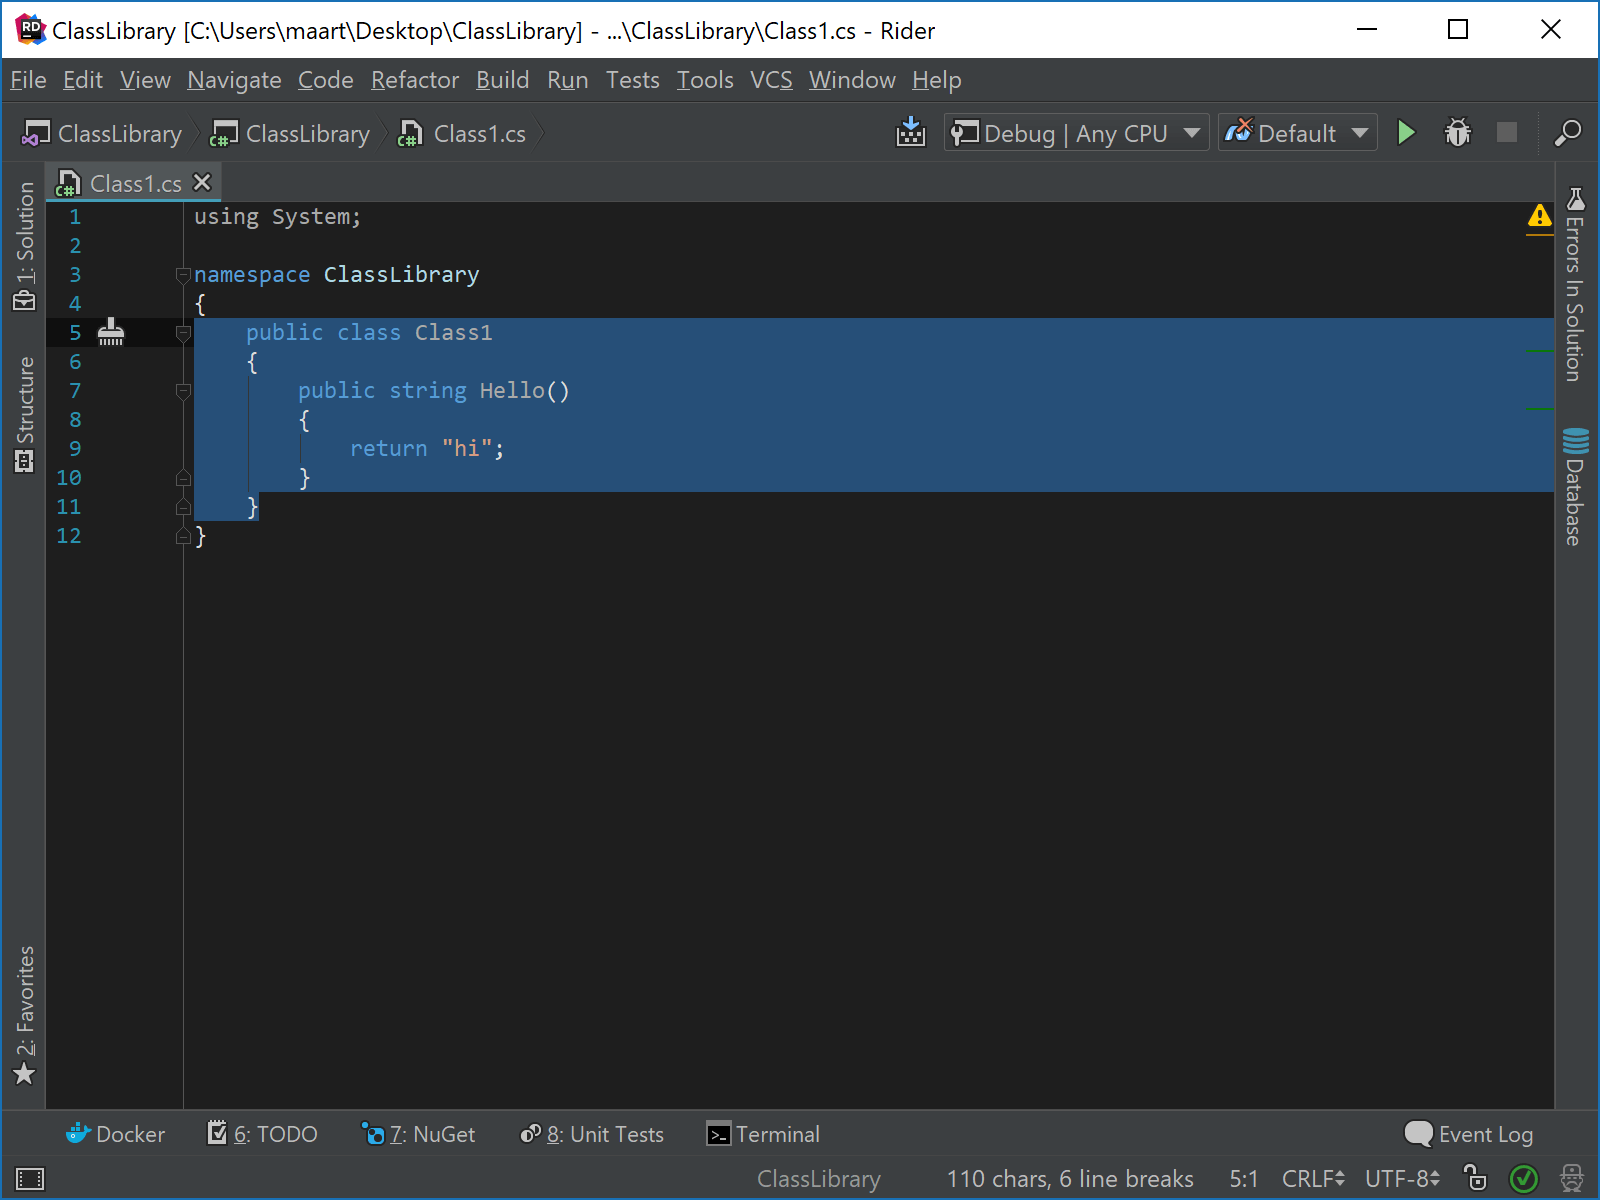
The C# Interactive tool window can be opened from the Tools | C# Interactive menu, or by pressing Alt+Enter in the editor and sending a code snippet to the interactive window:

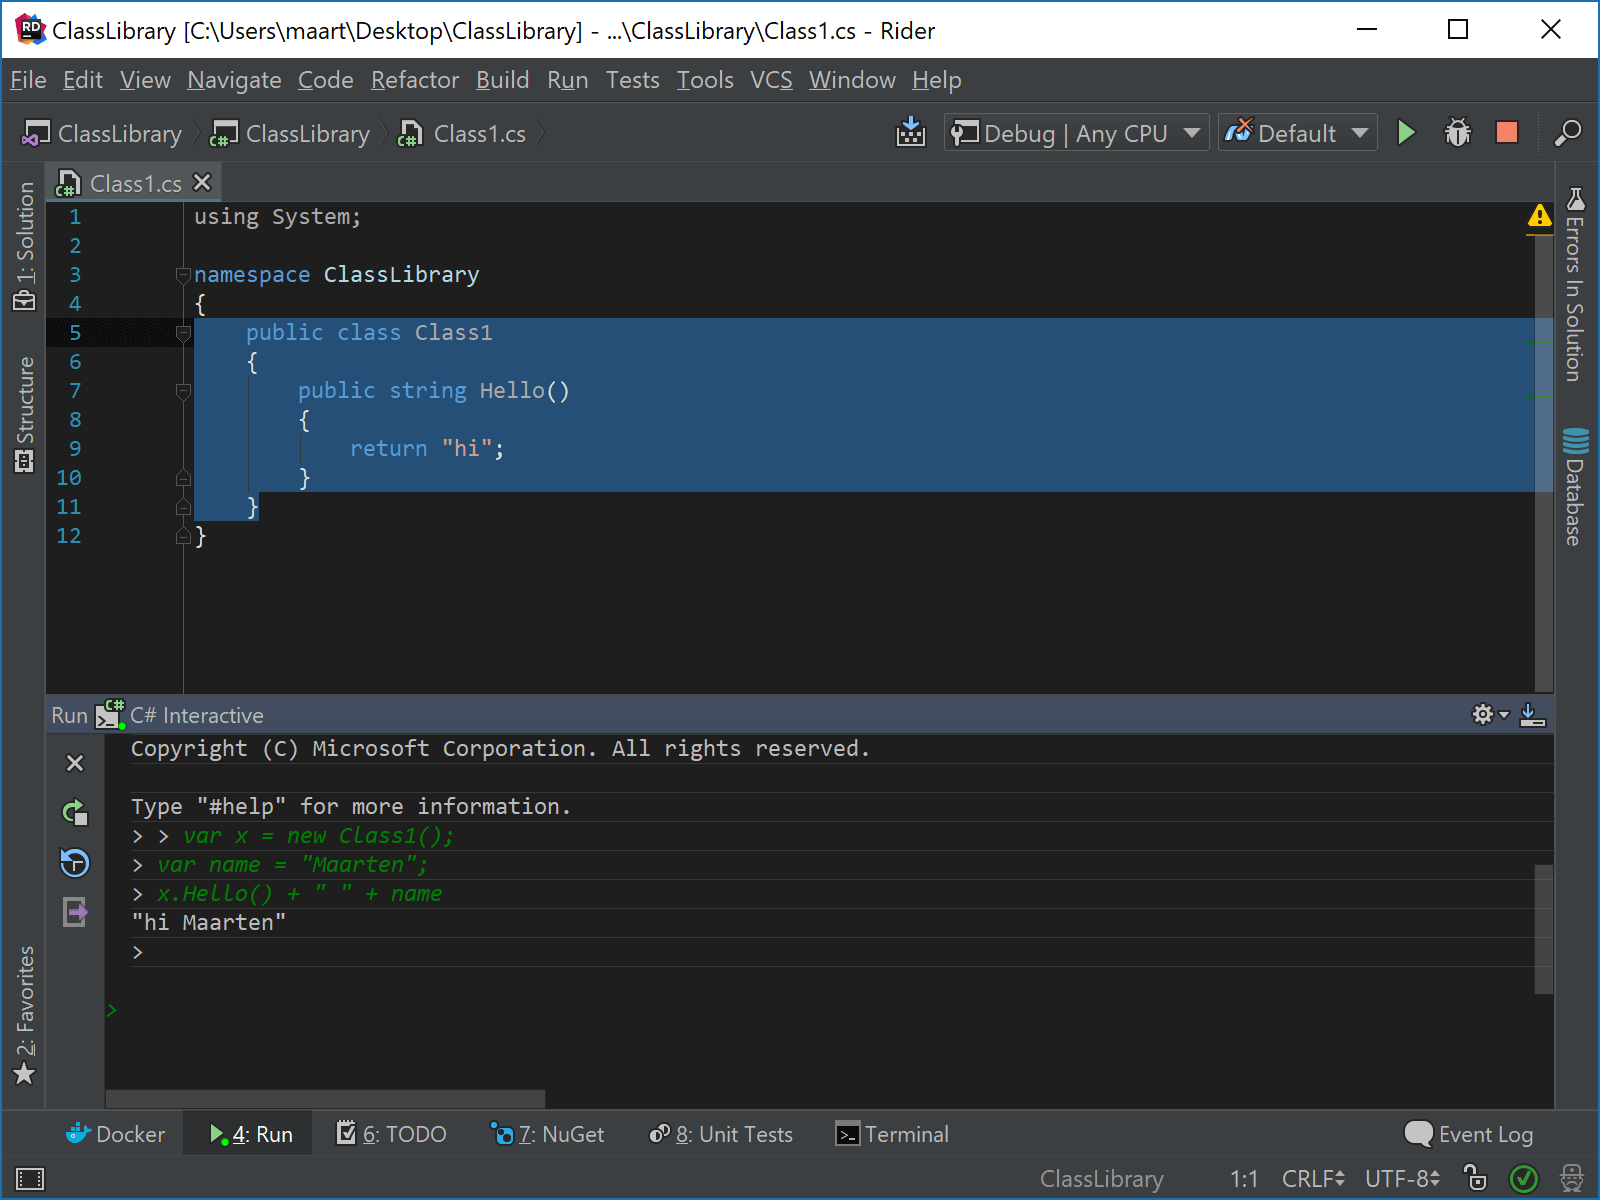
We can then use the read-eval-print loop (or REPL) to write any C# expression and evaluate it when pressing enter:

All expressions we execute during a C# Interactive session are held in history. We can re-evaluate a certain statement using the up/down arrows, or from the toolbar on the left.

The C# Interactive tool window is very useful to draft some code, so we made it easy to get a full transcript of the session – making it easy to copy/paste some snippets into actual code for the project we are working on.

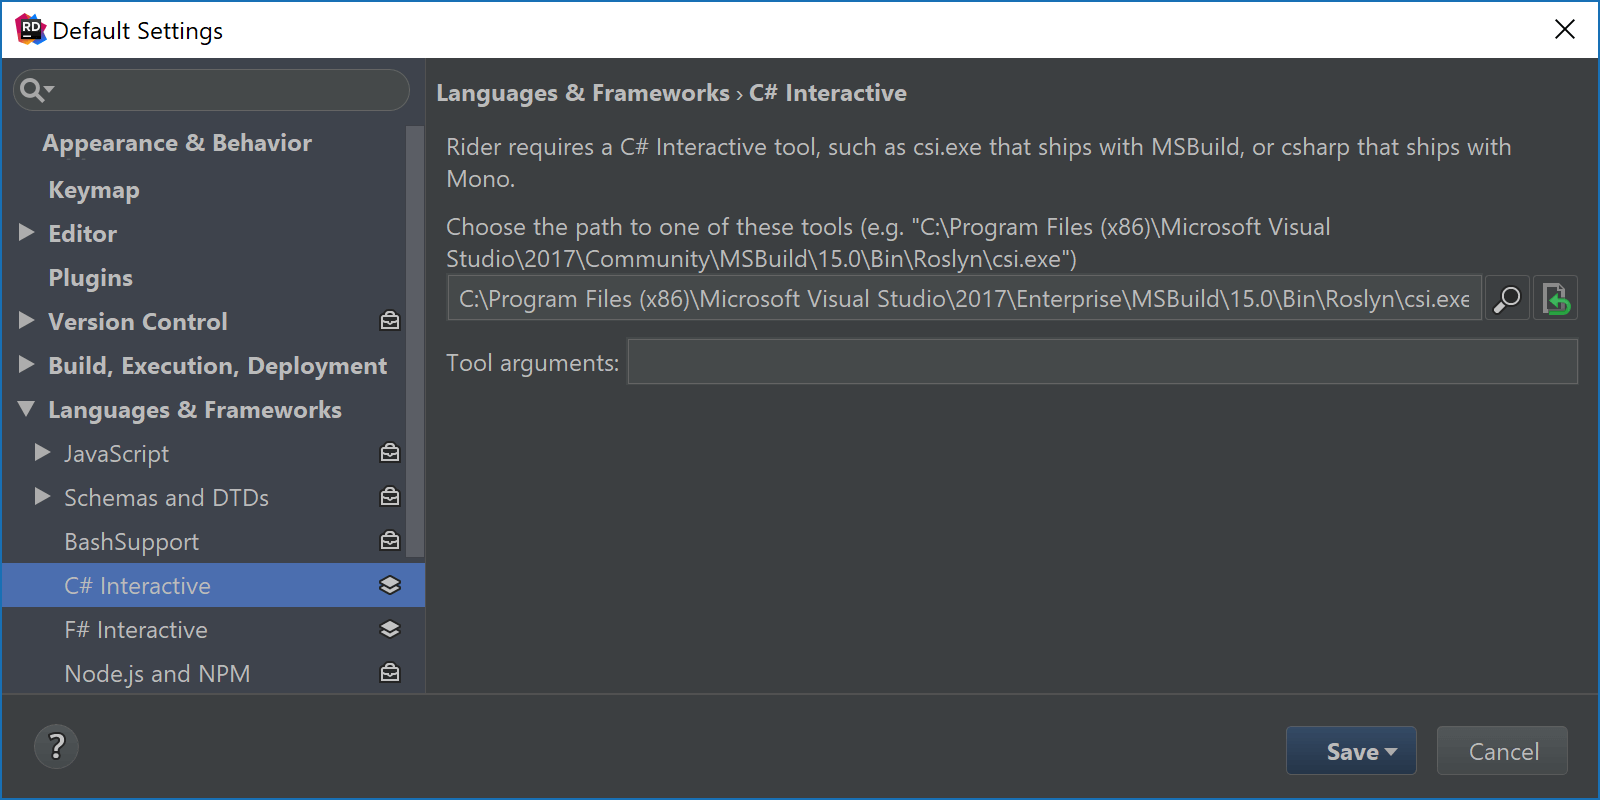
On Windows, Rider uses the csi.exe executable that ships with MSBuild. On Mac OS X and Linux, Rider defaults to Mono’s csharp. We do our best to auto-detect the tool location. In case Rider can’t find it or we want to use another C# REPL, we can customize the tool path (and arguments) from the settings.

Download Rider 2017.3 EAP and give it a try! We’d love to hear your feeback!


