CLion 2019.2 has landed with new functionality for Embedded Developers, experimental MSVC debugger, updated Unused Includes check, parameter hints, and much more
CLion 2019.2, the second big update this year, is here now! It brings improvements for Embedded Developers and adds more debugging abilities – including an experimental debugger for the Microsoft Visual C++ toolchain. That’s not all, there’s a fully-reworked Unused Includes check, enhancements in the editor, improved performance, and more.

To update to this version use the Toolbox App, snap package (on Ubuntu), our website, or the patch-update from the latest build of 2019.1.
In brief, here are the main improvements:
- For Embedded developers:
- On-Chip debugging with GDB Server
- A Peripheral View for ARM Devices
- In the debugger:
- GDB related enhancements
- Completion for GDB/LLDB commands
- On-the-fly detection of pending, resolved, and invalid line breakpoints
- An experimental debugger for the Microsoft Visual C++ toolchain
- Go to address and ASCII view in Memory View
- In the editor:
- The ‘Unused Includes’ check is back and now more accurate
- Updated Clang-Tidy brings a set of new checks to CLion
- Parameter Name Hints added to make your code easier to read
- Code assistance in ClangFormat config files
- Performance improvements
- Syntax highlighting for over 20 new languages
- Bundled Shell Script plugin
- Updates to the naming convention settings
- Changes included from IntelliJ-platform
- Rust plugin update
Read on for the details or check out this short What’s New video by Phil Nash:
Embedded Development
Some time ago we started working on support for Embedded development in CLion. This release comes with a wide range of on-chip debugging abilities and a new Peripherals tab.
On-Chip debugging with GDB Server
For on-chip debugging you could use the OpenOCD debugger and configuration provided in v2019.1. Now it’s time for more debuggers! If your microcontroller supports debugging via a GDB server, you can now do it in CLion. This means that for OpenOCD, ST-Link GDB Servers, Segger J-Link GDB Server, QEMU, and many other specific GDB Servers, you can run them from CLion and benefit from the built-in debugging abilities CLion provides. All you need to do is to provide the settings in the newly added Embedded GDB Server Run/Debug configuration:
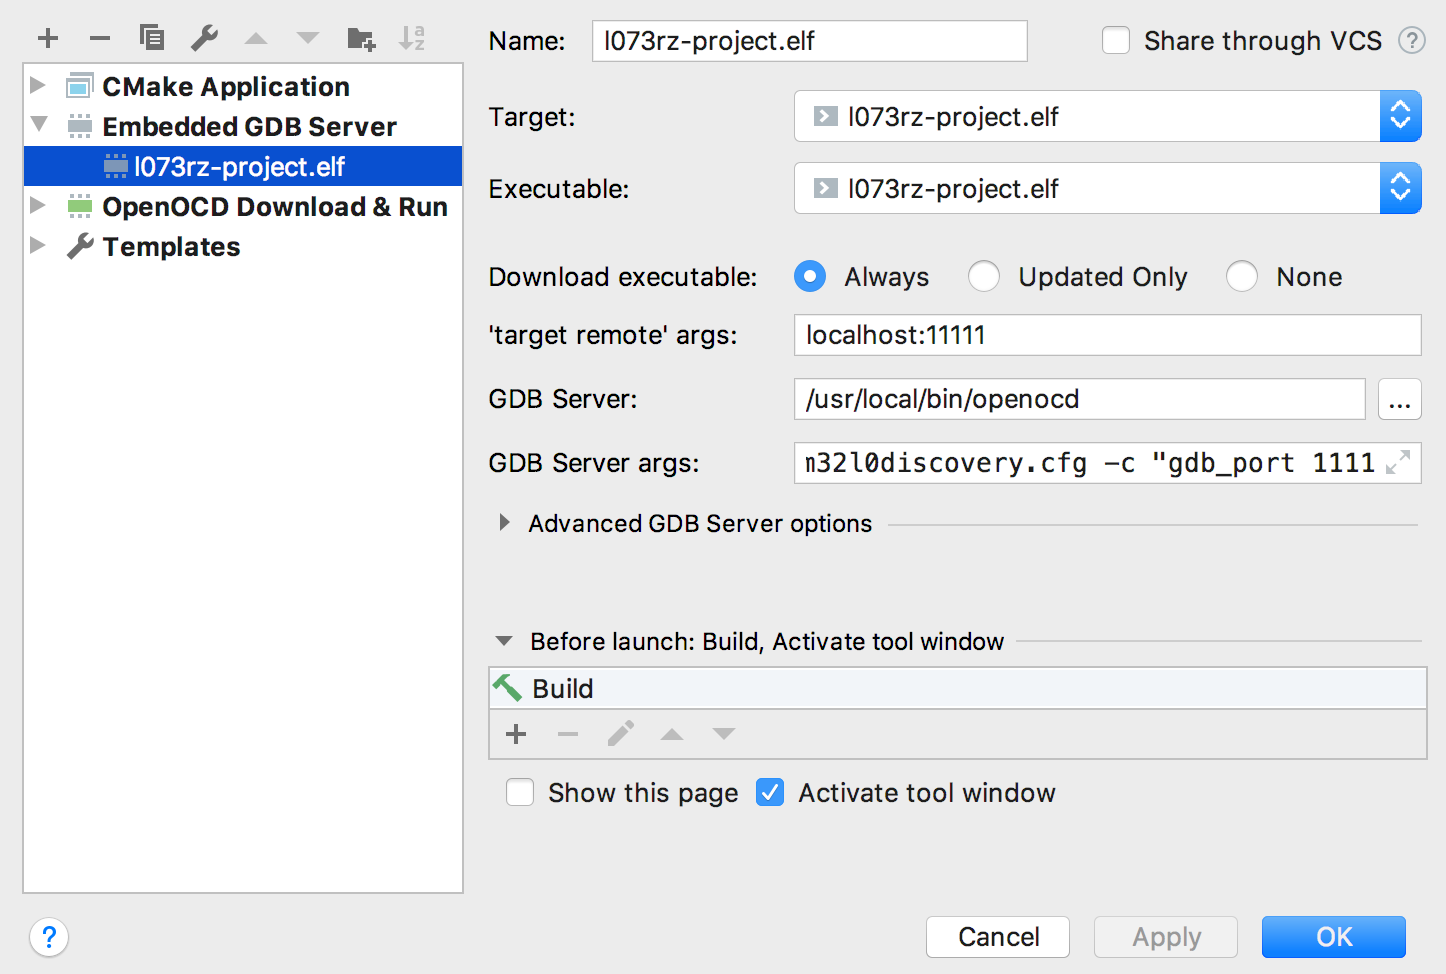
Configure the path to the custom GDB Server, GDB server-specific arguments (for example, port number or a board config file), and, if needed, working directory, environment variables, board reset command, and a startup delay.
Note, that similar to the OpenOCD Run/Debug configuration, this new configuration works only with the CMake-based projects for now. In the future, we plan to add the ability to launch these configurations for Custom Targets (CPP-16079).
A Peripheral View for ARM Devices
For ARM devices, there is often a specified Peripheral view described in the .svd file for your microcontroller type. CLion now provides a convenient way of reading these values in the dedicated Peripherals tab in the debug tool window:
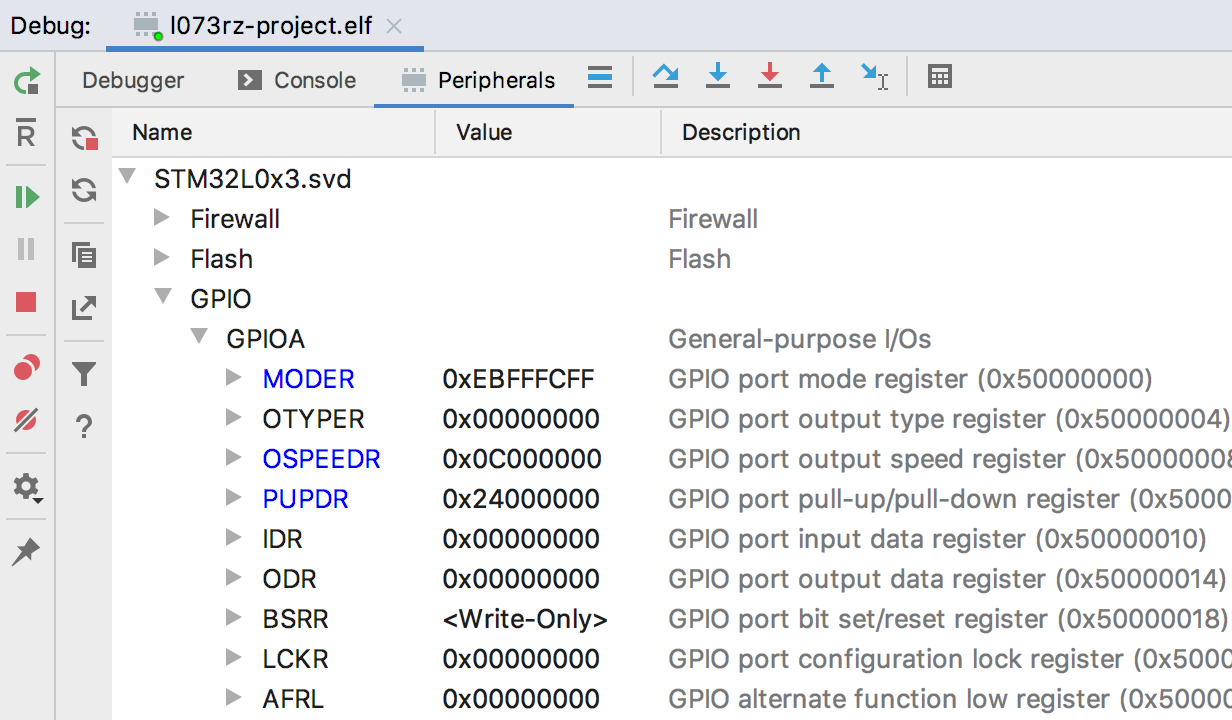
It works for the Embedded GDB Server and OpenOCD Download & Run configurations, and is available when one or more .svd files are loaded. Besides this, it’s useful to know that you can search through the Peripherals (just start typing the name you are looking for), and export the view as a CSV file and/or open it in the editor for future investigation. Learn more about it in this blog post.
Debugger
GDB related enhancements
In the debugger, we’ve bundled GDB 8.3 and introduced a whole new set of GDB-related fixes to improve your experience with it. For example, we’ve fixed the issue with GDB, where the variable’s value was not updated on stepping after “Set value” command, and the issue where GDB hung in the case of MinGW-w64 and multi-line commands is fixed too.
Completion for GDB/LLDB commands
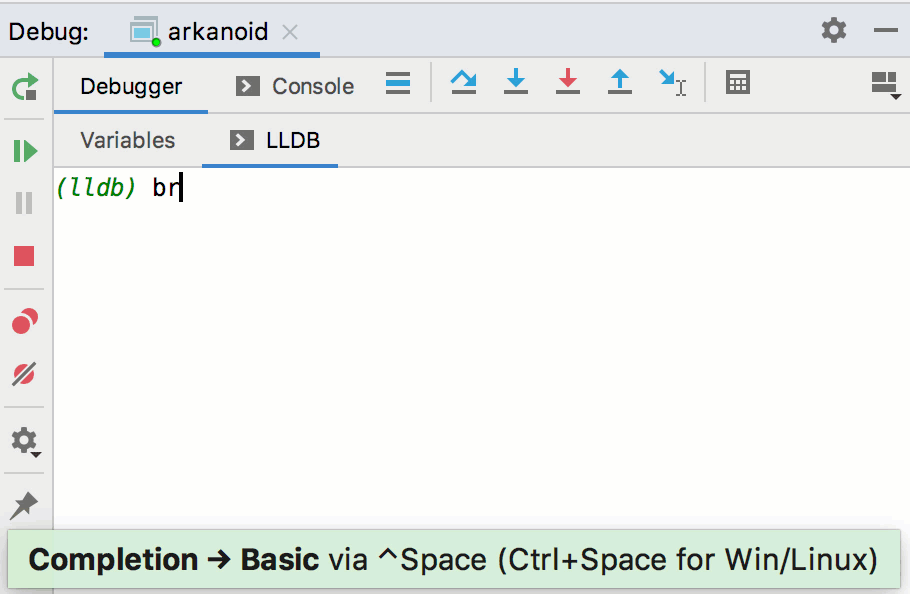
Next, for both LLDB and GDB, we’ve enabled the debugger commands completion in the debugger console tab (by Tab or Ctrl+Space). If you need to use the command line interface for GDB/LLDB, you can now easily do so in CLion:
On-the-fly detection of pending, resolved, and invalid line breakpoints
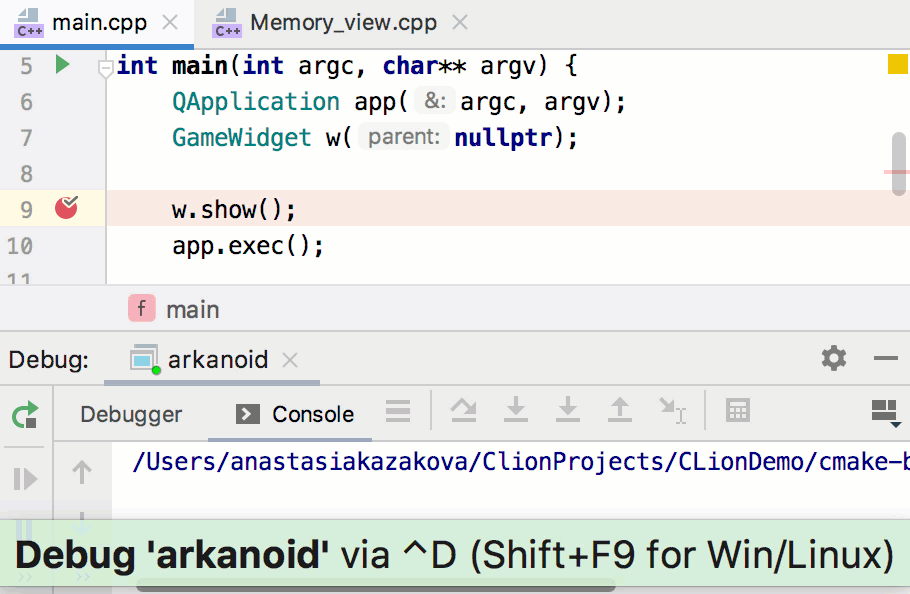
Besides, in v2019.2 you’ll notice that CLion can now distinguish between the 3 types of line breakpoints and update their icons on the fly:
- Pending: Line breakpoint is out of the debugging session, which means the session hasn’t started yet or the corresponding shared library hasn’t yet been loaded.
- Resolved: Line breakpoint is successfully resolved by GDB or LLDB using the provided debug symbols, and can be hit during the execution.
- Invalid: Line breakpoint can’t be resolved by GDB or LLDB and can never be hit. This might happen when the breakpoint is actually located out of the executable code or some debugging symbols are missing.
Experimental debugger features
And finally, there are two experimental features worth mentioning here. First of all, we’d like to remind you that to enable experimental features you need to call up the Maintenance dialog (Shift+Ctrl+Alt+/ on Linux/Windows, ⌥⇧⌘/ on macOS) | Experimental features and turn on the feature you want to use. However, be aware, experimental features are not yet release quality and we provide them mainly for collecting feedback.
cidr.debugger.value.numberFormatting.hex enables the experimental hexadecimal number formatting in the debugger. It was actually added before v2019.2 via the Registry settings, but now it is available under experimental features.
cidr.debugger.lldb.windows enables an experimental debugger for the Microsoft Visual C++ toolchain on Windows!
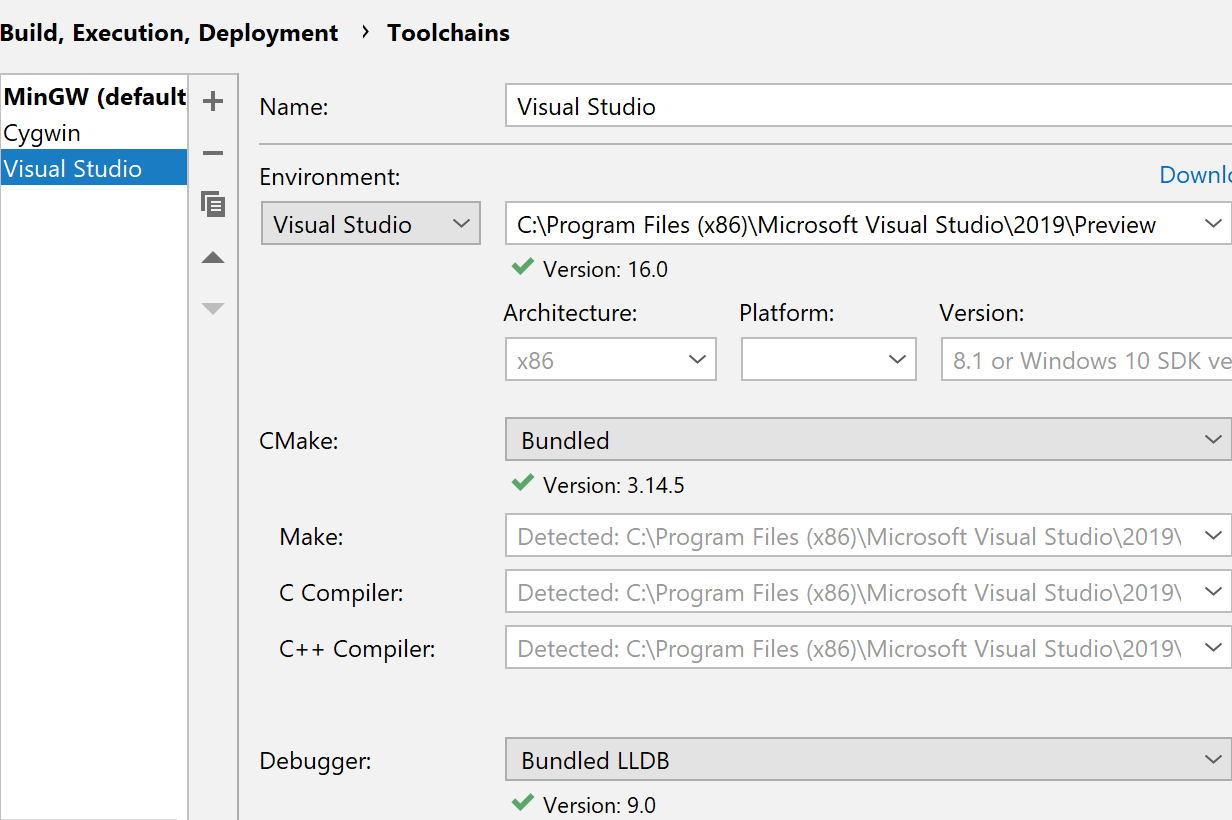
It’s worth saying a few words about the technology it’s based on. For code compiled with the Microsoft Visual C++ compiler, there are several debugging engines available in various tools. In Microsoft tools, there is a vsdebugeng.dll engine used, which is not available to others due to the licensing limitations. CDB and WinGDB use the dbgeng.dll debugging engine. Initially, we attempted to build a debugger on top of it. However, we faced several issues, including crashes and bad performance on large binaries with lots of PDBs. That’s why we’ve explored another option – implementing a debugger on top of LLDB. And it worked! There’s still a lot of work ahead of us, but we are quite optimistic about our chances.
Our LLDB-based debugger can work with the native visualizers taken from the Visual Studio installation or from your project. Just enable it in Settings | Build, Execution, Deployment | Debugger Data Views | Enable NatVis renderers for LLDB:
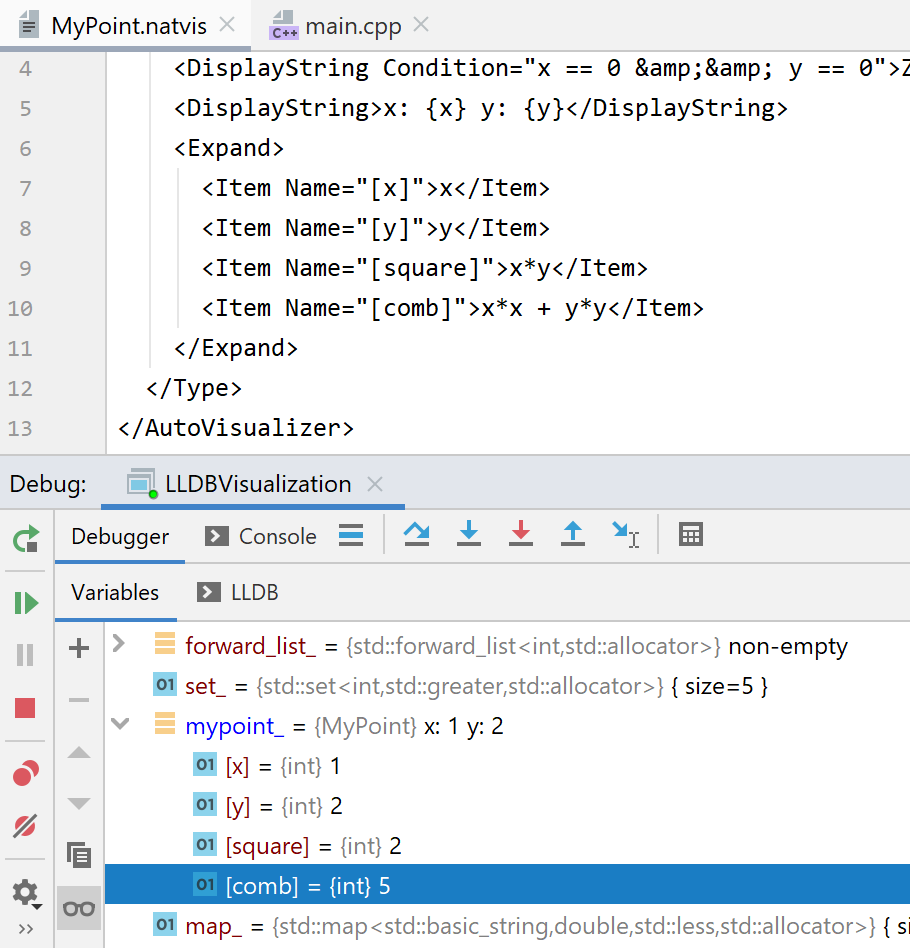
Before you start with this experimental debugger, we recommend you check out the list of known issues and limitations in our blog post.
Go to address and ASCII view in Memory View
Memory View helps you to view the raw memory of the running process when debugging. In v2019.2, it has had several updates added to it. First, the new Go to address means you can navigate to a particular address in the memory from the Memory View. Provide an address (in hex), a variable name, or call its address via & and jump to the corresponding address:
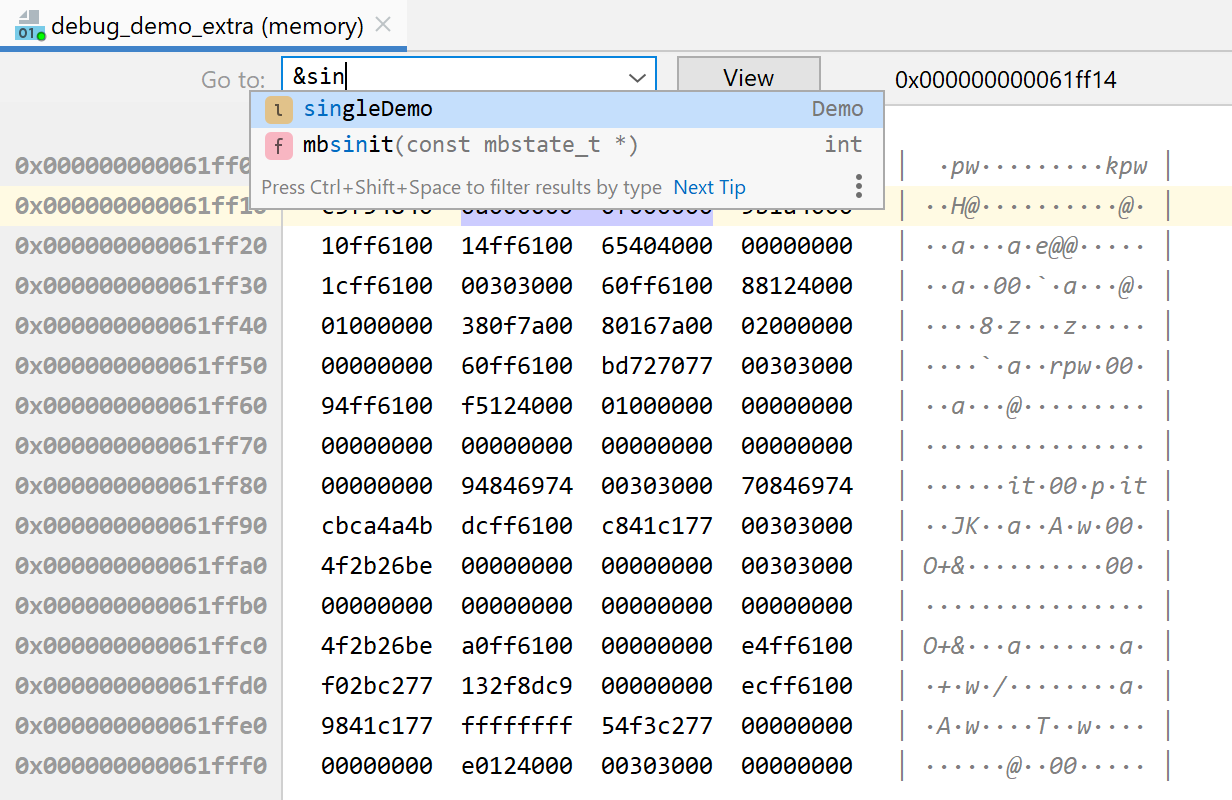
Note the code completion working for the known symbol. And also, the ASCII view added on the right of the raw memory view.
More code assistance in the editor
Unused Includes
The ‘Unused Includes’ check was turned off for a while because of the multiple false-positives it ran into. Now, we’ve completely reimplemented the check on top of Clang, and brought it back as default. So if you keep the default Clangd-based engine on, the updated check will work and highlight the include directives which are not necessary.
The check uses the detection strategy configured in the settings, by default, it’s Detect not directly used, which follows the Include What You Use principle – where source files should include exactly the headers that contain the symbols used in that source file. So if declarations from the header are not used in this file directly, CLion will mark the include as unused:
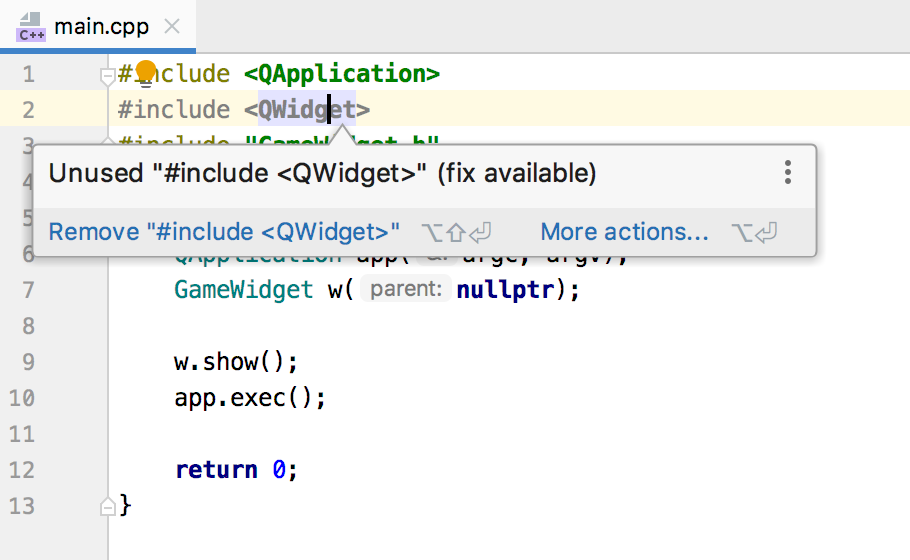
Other strategies can be configured in Settings / Preferences | Editor | Inspections | C/C++ | Unused code | Unused include directive. Learn more about the implementation here.
Clang-Tidy
The Clang-Tidy binary was updated to a newer Clang version. And the update brings a whole new set of checks, like modernize-avoid-c-arrays, modernize-use-nodiscard, new abseil-* checks, checks from the clang-analyzer-* group, and more. By default, not all of them are on. Please check CLion’s default configuration here.
Parameter Name Hints
How many times were you looking at a function call with parameters like ‘true, false, true’ or ‘10, 20, 30’ and trying to guess which means what? Of course, you can navigate to the function declaration, check the Quick Documentation popup, or call the Parameter Info, but how can you get this information even quicker? Parameter name hints, that’s how!
For function calls, lambdas, constructors, initializer lists, and macro expressions, CLion shows the names of the parameters for the passed arguments. This works if an argument is a literal or an expression with more than one operand.
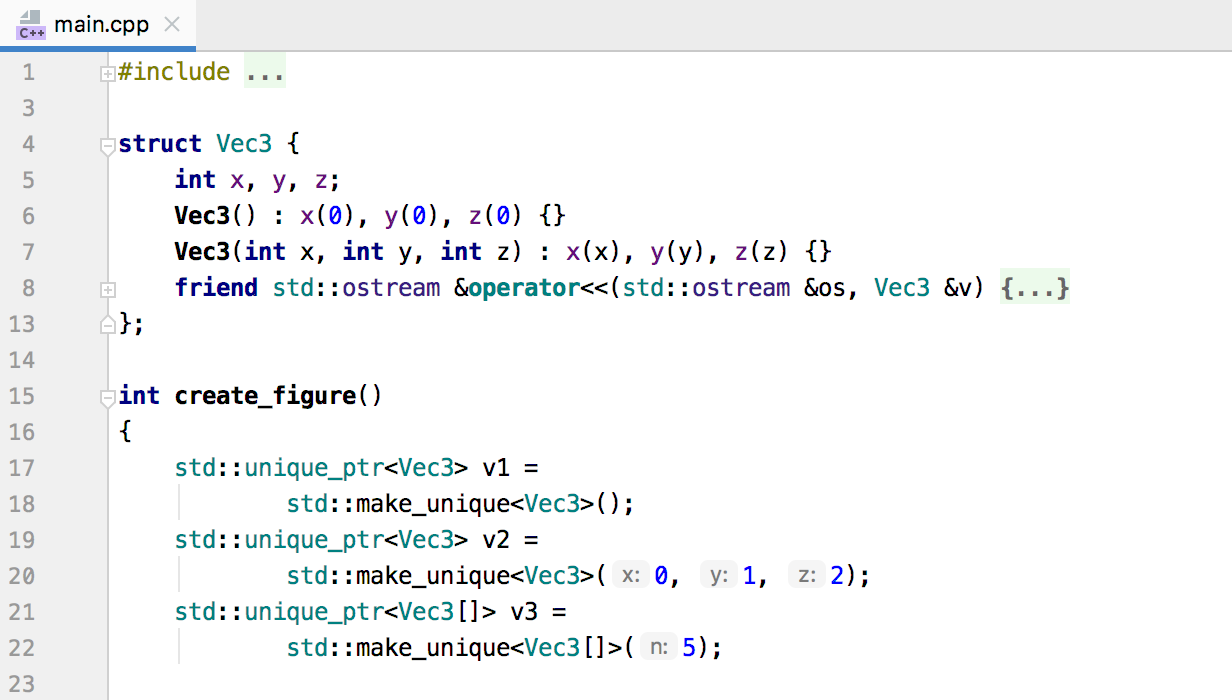
Learn how to configure the parameter hints.
Code assistance in ClangFormat config files
After introducing ClangFormat in CLion as an alternative formatter in v2019.1, we’ve noticed that users tend to update the .clang-format config files in their projects in CLion. That’s why we’ve added some code assistance for them for this.
CLion completes the name of the options and their values, showing the option’s description in the completion popup. While Quick Documentation (Ctrl+Q on Windows/Linux, F1 on macOS) provides the original documentation with samples.
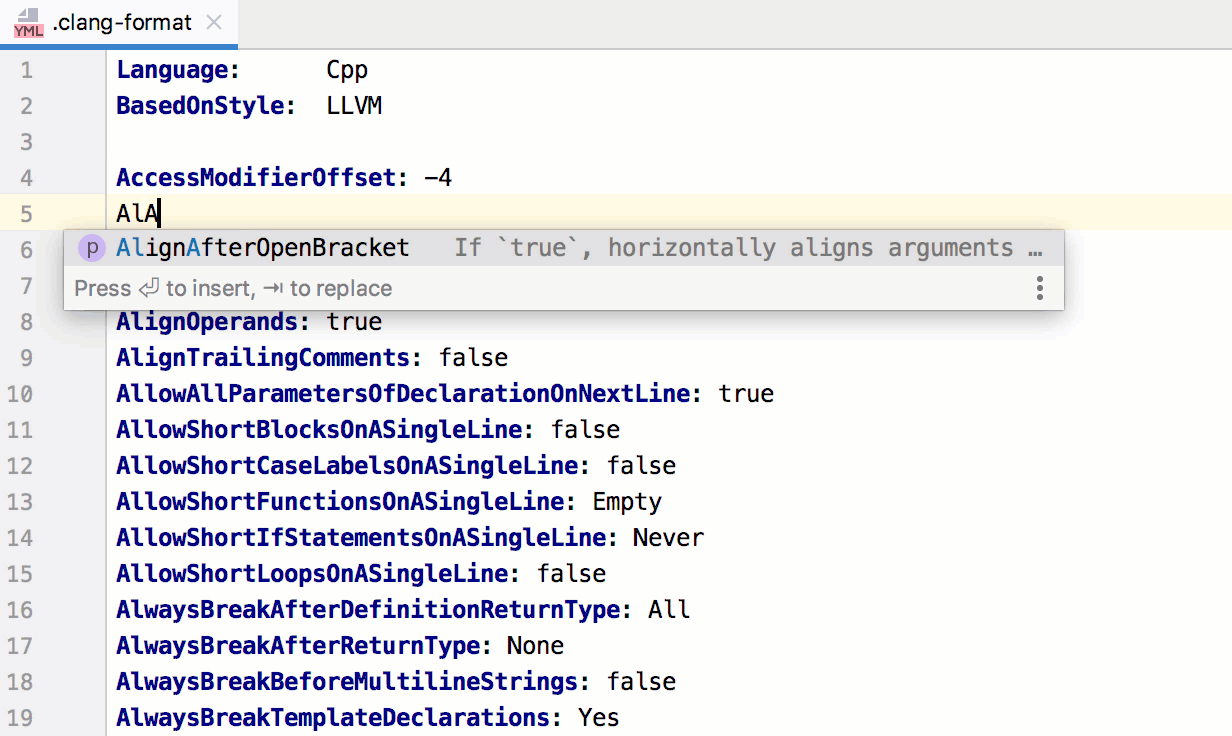
This all is implemented by adding a built-in JSON schema, which CLion uses to validate the option’s values against. And if the value doesn’t match, a corresponding warning is shown and a quick-fix is provided.
Performance improvements
Performance has been a top priority for us for several releases in the row already. And we can assure you that there are some great new ideas coming about, which we are carefully investigating and putting into development. However, this is not a matter of one or two release cycles. Often the changes require more work and can even affect the way CLion interacts with the IntelliJ-platform. Meanwhile, smaller steps are making their way into every release. And here are some of the improvements included in v2019.2:
- The in-place Rename refactoring was reworked to eliminate lags and freezes.
- The performance of code completion for qualified expressions in the editor has been significantly improved.
- Collecting compiler information and loading the CMake step in remote cases was accelerated by reducing the number of I/O operations.
- CLion now warns you when Windows Defender is affecting the build performance and is able to automatically exclude directories from real-time scanning.
Besides all these incremental changes we are making, in June our team (along with the IntelliJ-platform team) ran an internal performance week / hackathon, playing with several fresh and brave ideas to improve the performance. Some of them worked better than others and we hope to bring them to production in v2019.3.
Syntax highlighting for new languages
Often there is code from other programming languages in your C or C++ project. Python, JavaScript, HTML, XML, and SQL are all bundled into CLion. And there is a handy plugin for Rust. But what about the others which are not as popular in the C++ world, but are still in use? For example, Ruby and C#. For such cases, in v2019.2 we’ve added syntax highlighting for over 20 different programming languages, and it works out of the box – without any additional configuration. The full list of available languages can be found in Settings/Preferences | Editor | TextMate Bundles. And you can add a new language there easily (the support is based on TextMate grammars)!
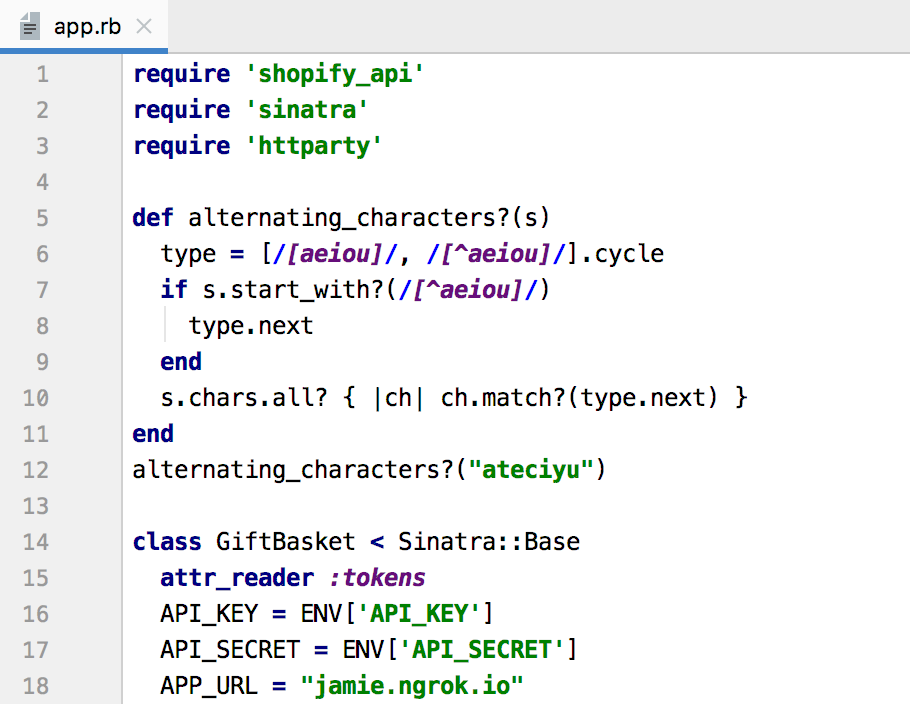
Note however, that this is only about syntax highlighting. We provide more sophisticated support only for a limited selection of languages in CLion.
Shell Script
When talking about complementary languages in C and C++ projects, shell scripts are natural to the majority of such projects. It is not unusual to do some code generation or build/install steps in such scripts. Coding assistance in shell scripts might be able to help you increase your productivity. That’s why now CLion bundles the Shell Script plugin, which provides some handy features like code highlighting, word and path completion, and even textual Rename:
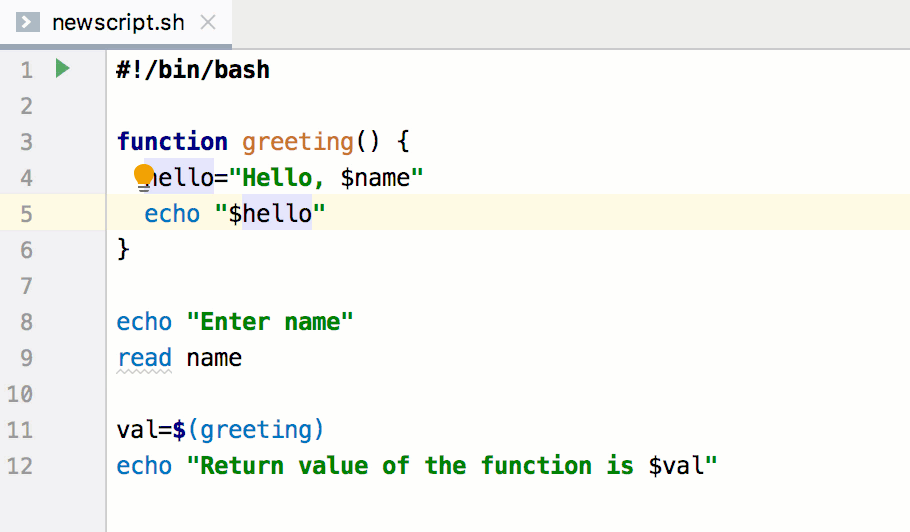
Writing a script has never been so easy! And you can check scripts right away in the IDE, by running them in the built-in Terminal!
Naming convention
Naming convention is also a feature that appeared in v2019.1, and was later enhanced in v2019.2. We’d like to thank everyone who provided us with feedback and ideas on how to improve the naming convention support in CLion!
With the reworked UI, new settings like Visibility (Public, Private, or Protected) and Specifier (Const or Static), new styles like Leading_snake_case and Upper_Snake_Case the naming convention settings have become much more flexible and powerful. We hope the new UI makes configuration easier for you.
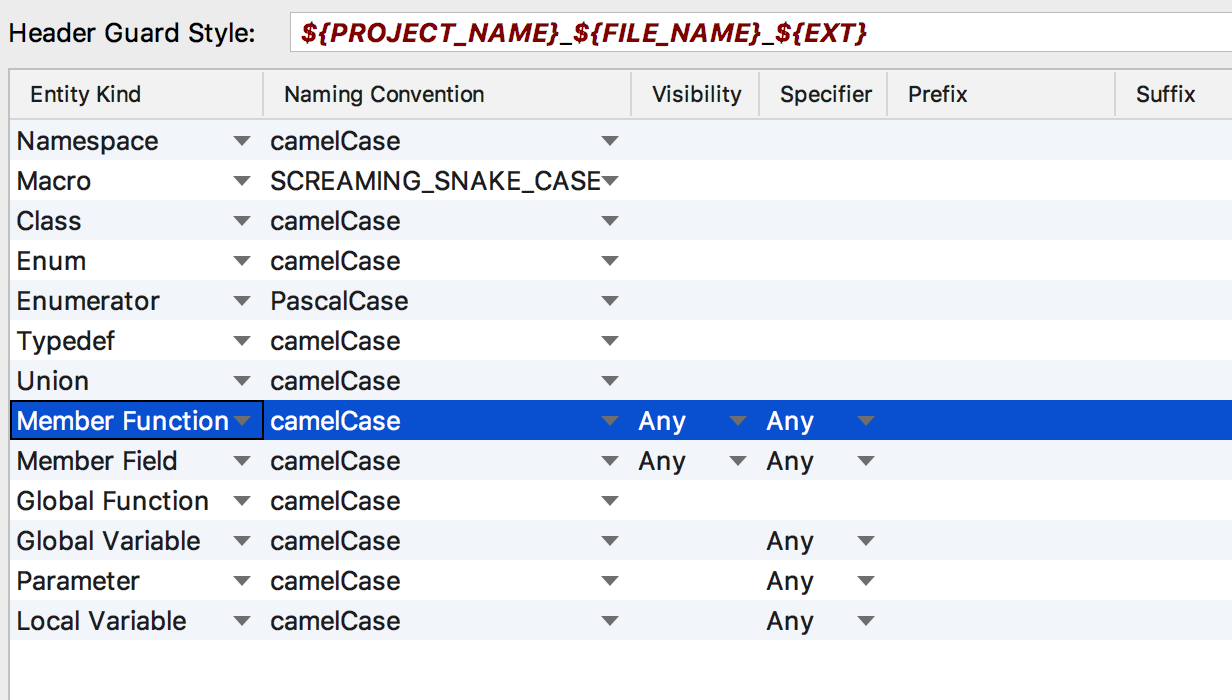
We’ve also put effort into making sure your current naming settings will be migrated smoothly from 2019.1 to 2019.2!
Platform enhancements
CLion is based on the IntelliJ-platform which means that every release brings dozens of platform improvements. For this release the main highlights are as follows:
- A new plugin page was introduced and make the work with plugins in the IDE much more comfortable. For example, you can now easily enable/disable the installed plugins or read the description of the plugin before installation (as the plugin description is now located right next to the list of plugins).
- The inspection tooltip has an updated UI – in addition to the problem description, it provides you with the first available fix when possible (to apply it, use
Alt+Shift+Enter). - As usual, our VCS team prepared a set of updates to the VCS subsystem.
- The bundled customized JBR was updated to v11 (the fork of OpenJDK 11 with fixes from the JetBrains team). This transition addresses various issues, including performance.
Rust plugin
The Rust plugin was updated significantly in this release. The biggest change is a new experimental macro expansion engine (turn it on in Settings/Preferences | Languages & Frameworks | Rust | Expand declarative macros), which enables such features as highlighting, name resolution, and completion for generated modules and methods from impl blocks. Besides this, it enables navigation in the macro calls.
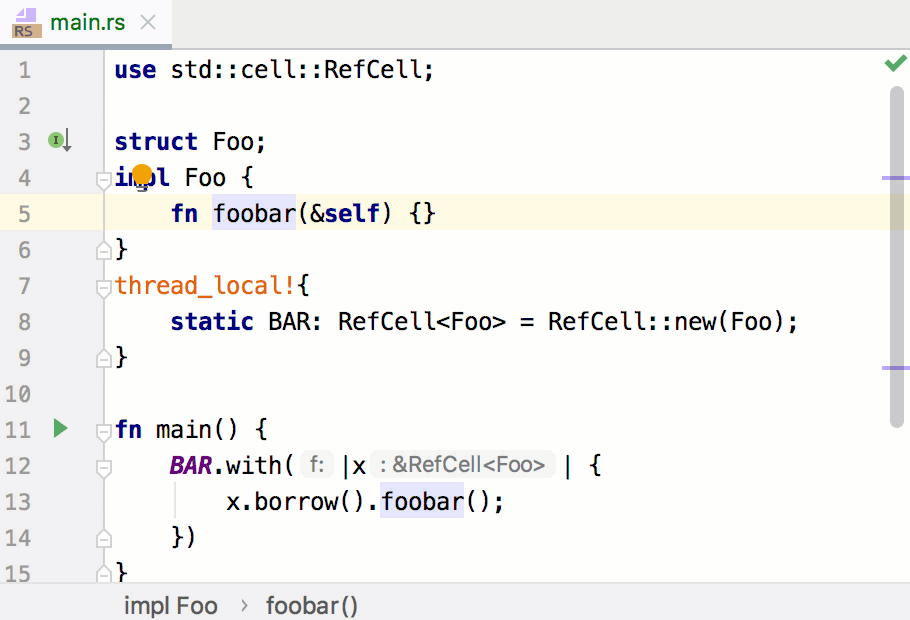
Among other notable changes we should mention:
- New Duplicate code fragments inspection for Rust
- New Make public and Create Field quick-fixes
- New Add format string argument and Use destructuring declaration intentions
- Completion in Evaluate Expression and in GDB/LLDB consoles
That’s it! Of course, there are dozens of various other bug-fixes and improvements, which were not mentioned here, but it’s better to try the new build out on your own and see if it makes a change in your case.
Your CLion Team,
JetBrains
The Drive to Develop


