CLion 2021.2: CMake Presets, GNU Autotools Projects, Debugger Updates, New Static Analysis, and More

The C++ ecosystem is evolving, and so too is our cross-platform C/C++ IDE. CLion 2021.2 can help you by protecting your code from typical C++ memory safety issues, simplifying your build configurations, and making debugging easier and more effective.
To update to the new version, you can use the Toolbox App or a snap package (on Ubuntu), download the installer from our website, or apply the patch update to upgrade from the lastest 2021.1 build.
In this release:
- Build system updates
- CMake
- Makefile and GNU Autotools
- Debugger
- Easier debugger configuration
- Preview Tab in debugger
- Debugger on Windows
- LLDB
- Cling interpreter
- Object lifetimes static analysis
- Profiling in remote mode and on WSL
- Updates to VCS support and Local History
- Plugins update: localized UI and Rust
- Other changes
Build system updates: CMake, Makefile, GNU Autotools
As we see in the Developer Ecosystem research, the three most popular build systems in C++ have remained unchanged:
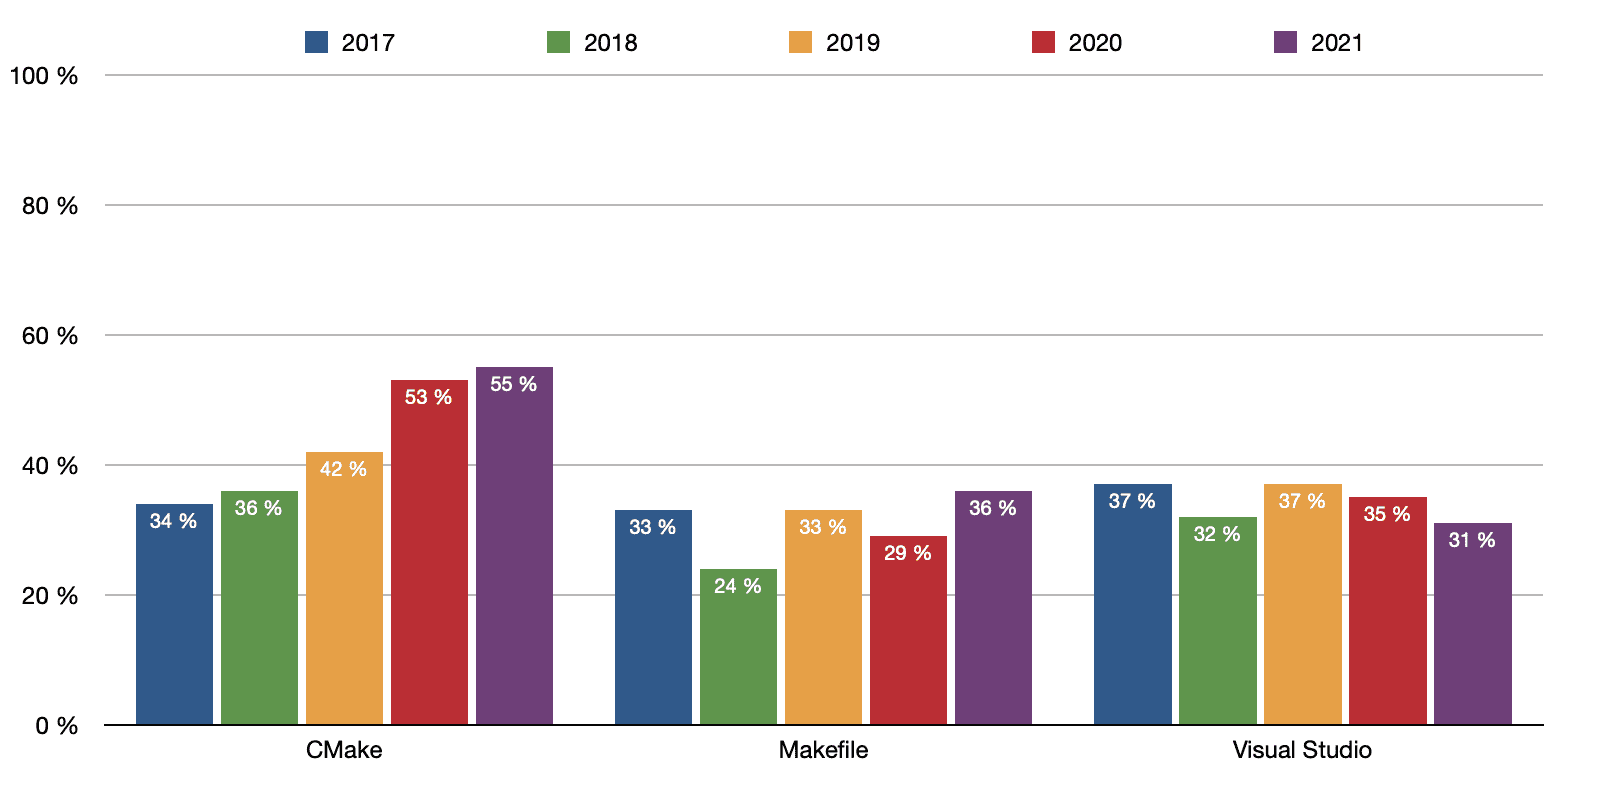
CLion can work with 2 of them – CMake and Makefile. msbuild is natively supported in Visual Studio, while C++ support can be enhanced with the ReSharper C++ extension. CLion 2021.2 brings significant improvements to CMake and Makefile support. Let’s check out the details!
CMake
Since the early days of CLion, CMake has been the IDE’s primary project model. In 2021.2, this support has had a massive update in order to keep it aligned with the ongoing CMake evolution.
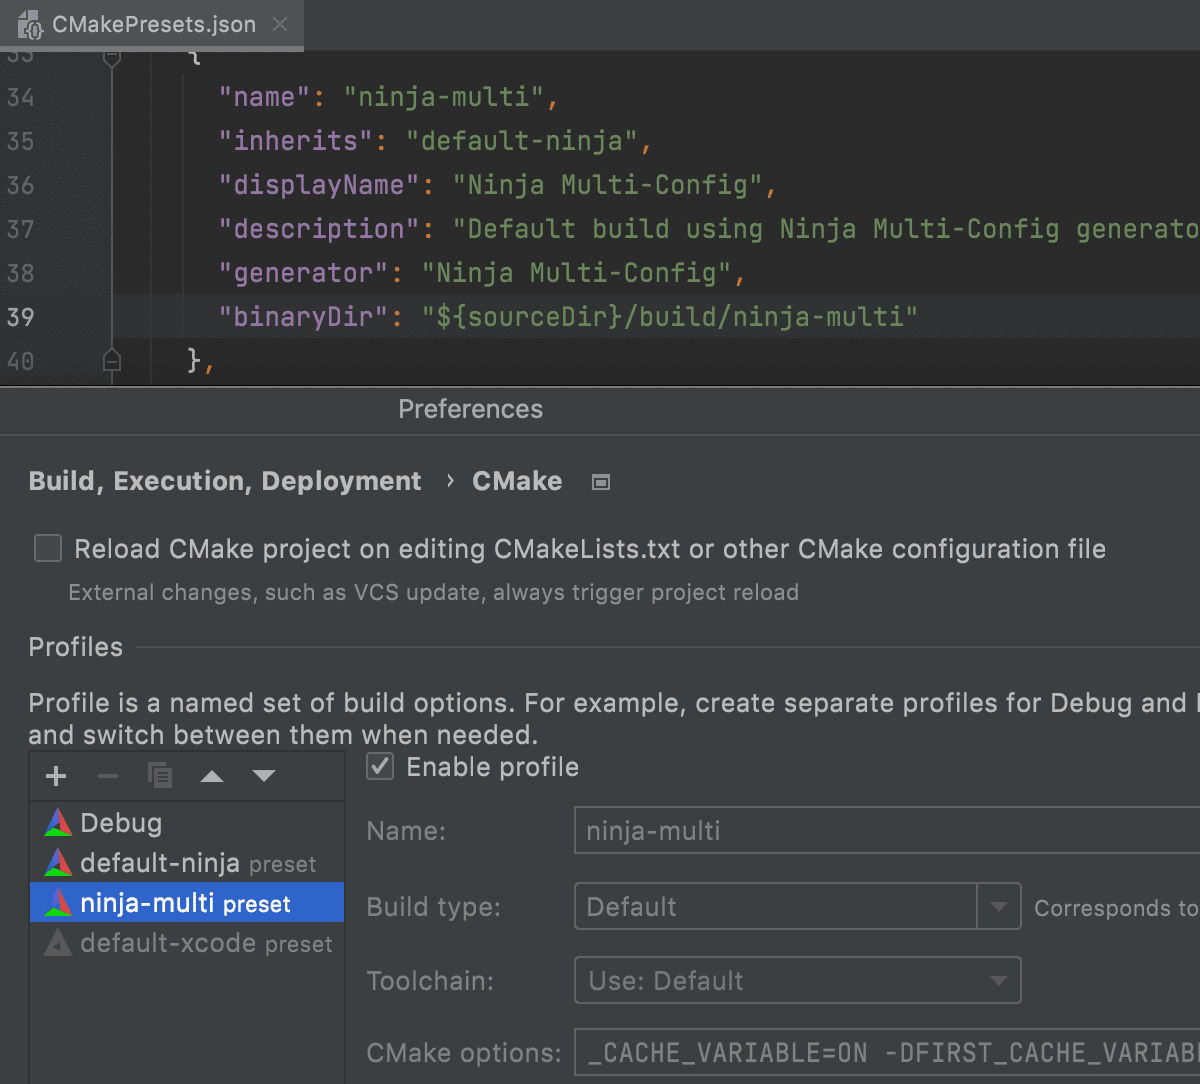
CLion 2021.2 bundled CMake 3.20 and supports one of the biggest features of this CMake release – CMake Presets. This feature addresses the common need to share the CMake build configuration settings with other people.
If you open a project with CMake Preset files (CMakePresets.json, CMakeUserPresets.json, or both) in CLion 2021.2, the IDE will automatically load the build presets and store all of their settings in CLion’s CMake Profiles. Presets that are loaded in CLion are read-only, but you can still edit .json files in the CLion editor. When you edit a .json file or update the preset externally, you will get a notification with the option to reload the changes.
This now works for version 2 presets and build presets.
If you want to learn more and see CMake Presets support in action, watch this video:
A few more important CMake enhancements in v2021.2:
- New CMake project templates for C and C++ executable, CUDA, and Qt projects were added and are configurable in Settings/Preferences | Editor | File and Code Templates.
- CMake targets can now be specified as Before Launch tasks in the Run/Debug configuration. With this, you can execute a built-in or user-specified CMake target before launching the configuration in CLion.
Makefile and GNU Autotools
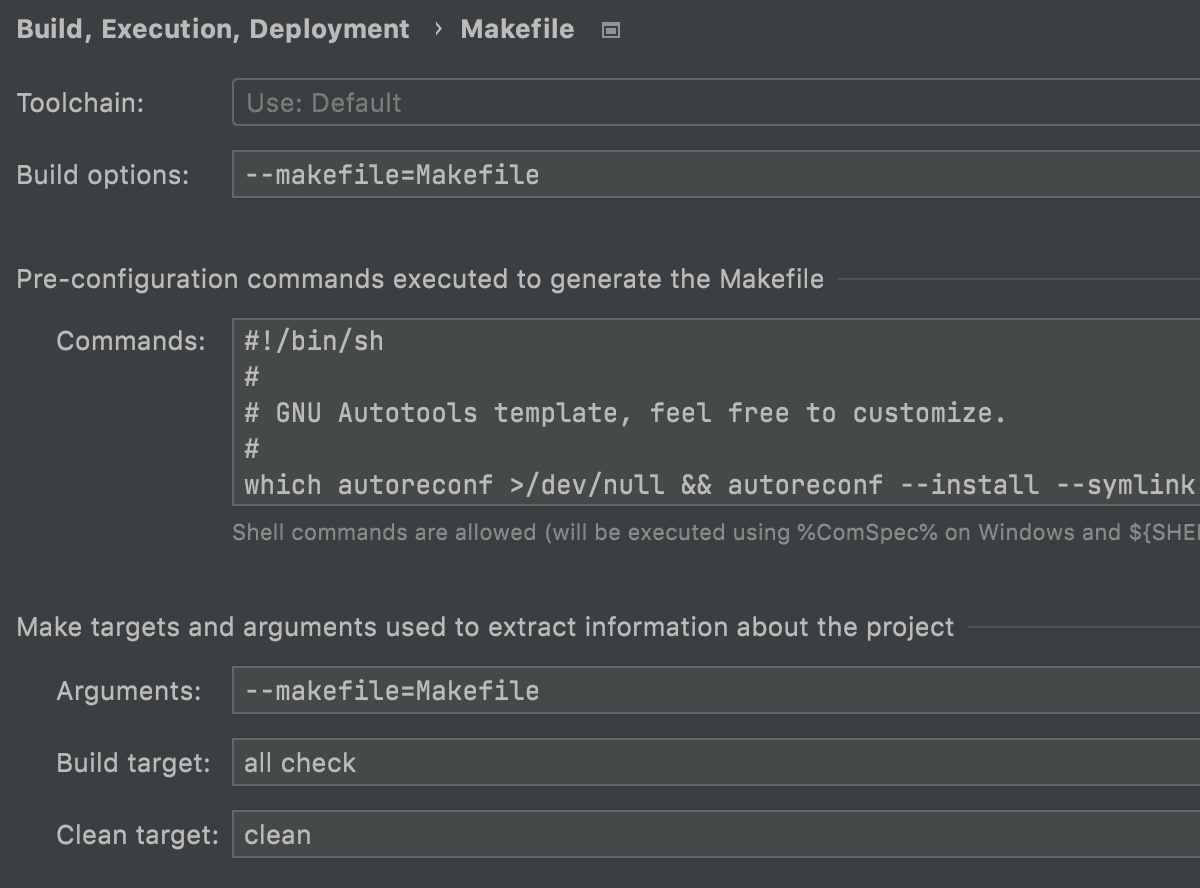
In previous versions we introduced Makefile project support in CLion. However, it had a significant limitation – Makefile files should be present in the project root directory to load the project automatically. Many projects that use make rely on pre-configuration steps which in turn generate a Makefile file for the project. CLion 2021.2 supports such projects now too!
The exact command executed by CLion for pre-configuring the project can be tuned in Settings/Preferences | Build, Execution, Deployment | Makefile:
Adding automatic support for the pre-configure step made it possible to load GNU Autotools, Kbuild, and PERL MakeMaker projects in CLion. Check out all the details in the corresponding blog post. Here is the list of projects we test our Makefile projects support on.
Debugger enhancements
We have continued to work hard on improving CLion’s debugger. The CLion 2021.2 update brings better Natvis support and minidumps for Windows users, and updates to breakpoints and remote LLDB. Let’s briefly go through these enhancements.
Easier debugger configuration
It’s easy when everything is compiled and debugged locally inside your IDE, but there are many more complicated setups where you need to debug your code. In this release, we worked on improving the configuration experience.
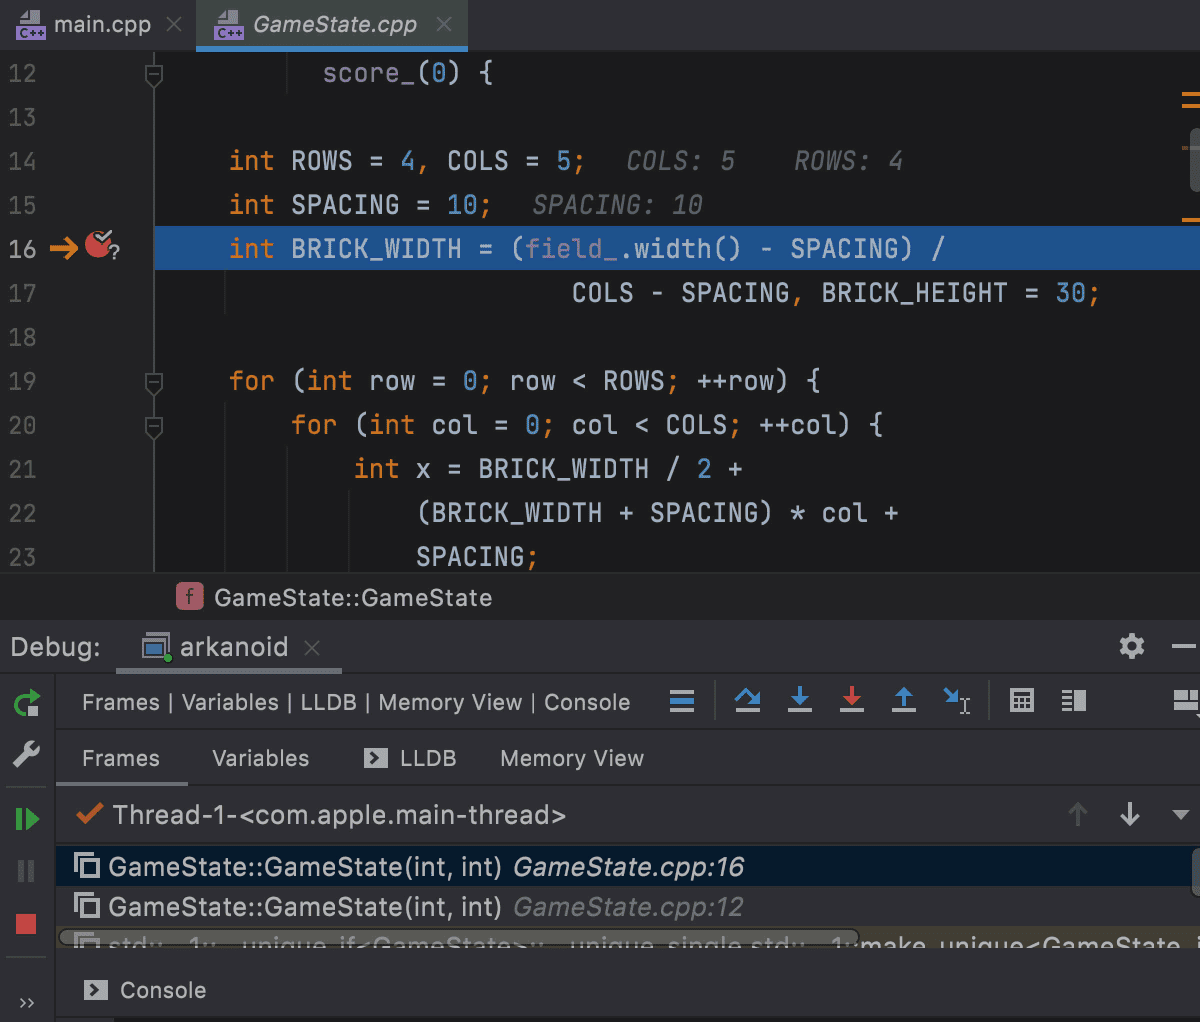
When you debug an executable built somewhere else, the path mappings might be too complex to fill them in in the debug configuration, but the debugger relies on a full file path when stepping through the code. It’s now possible to use just the file name for breakpoints in such cases. These breakpoints are called Relaxed breakpoints.
Another case is when you debug a custom executable using a fake project or when there is a library built on CI without the source code being in the project. Stepping to these source locations will cause the disassembly view in CLion, as the IDE can’t locate the actual source code. Now you can explicitly specify where to find the source files. The notification is shown in the disassembly view.
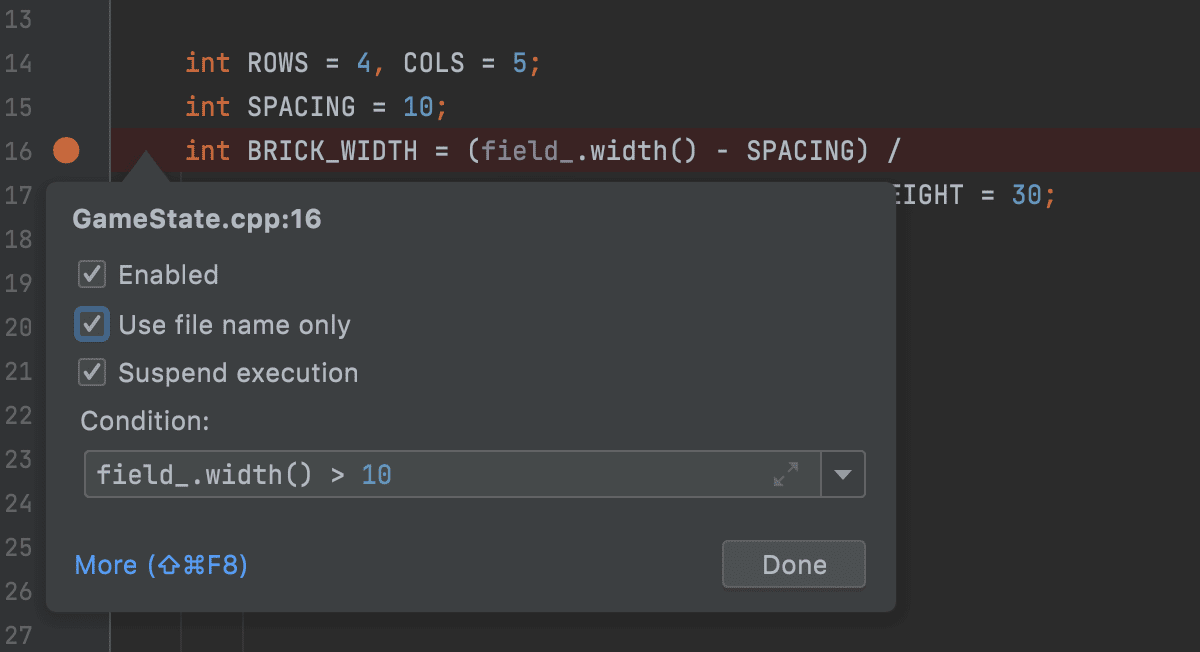
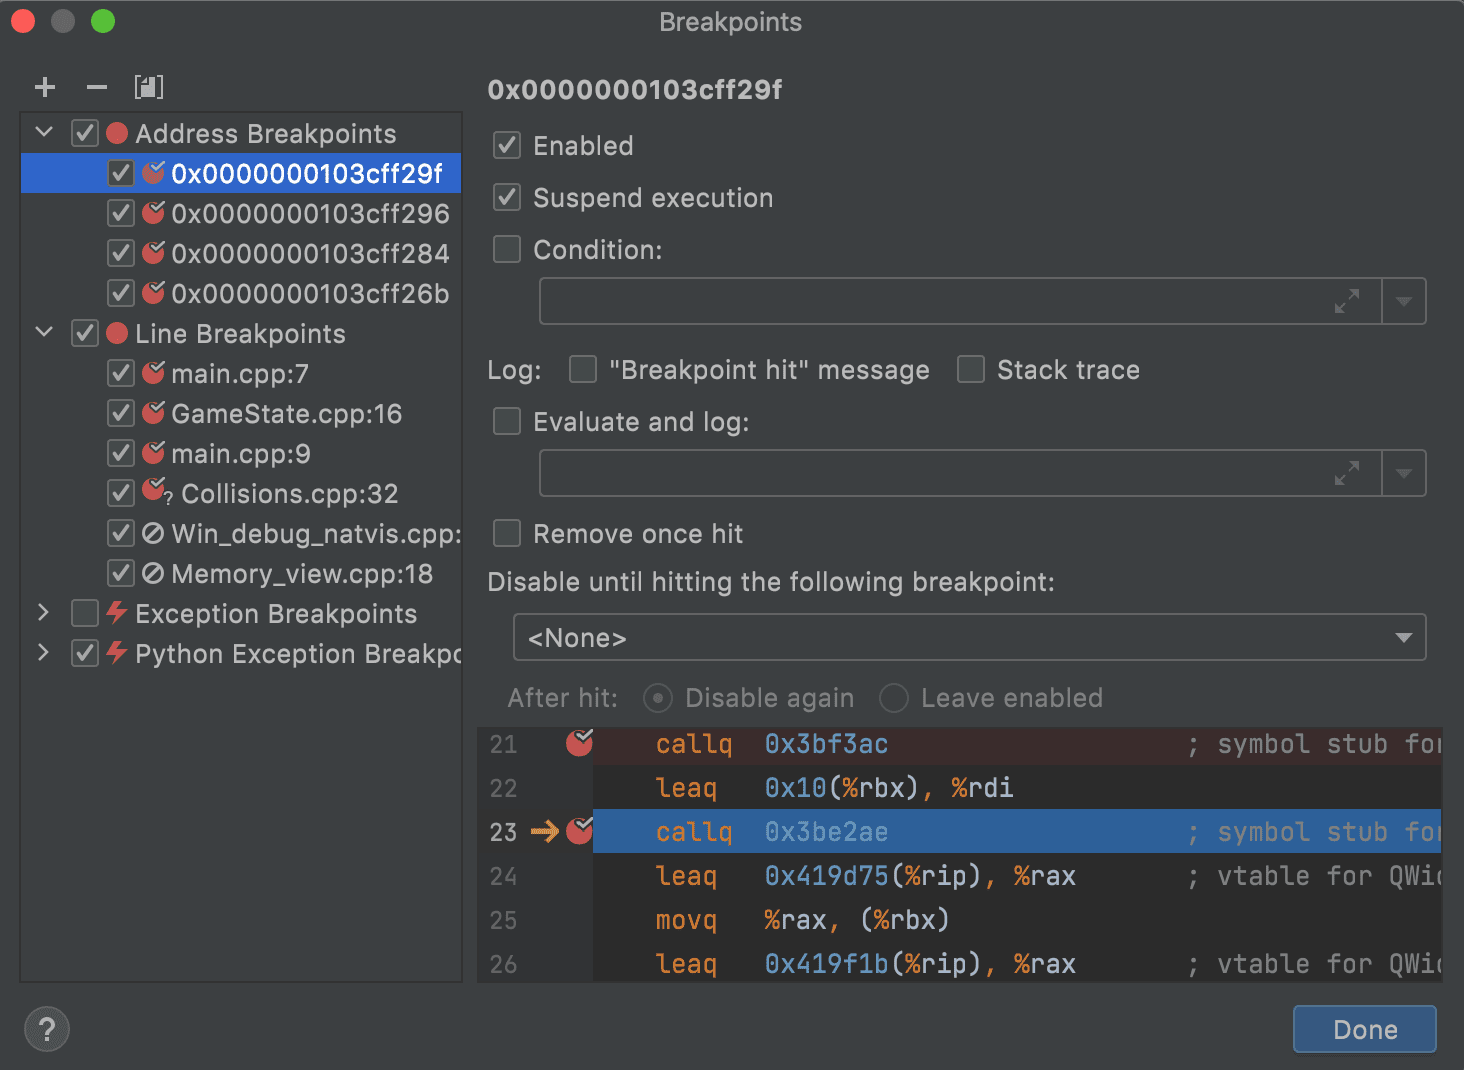
Regarding the disassembly view, there is now the ability to set breakpoints there. For these address breakpoints, you can configure many useful behavior patterns like the condition when it should be hit, and if it should suspend the execution or just log a message:
Preview Tab in debugger
When stepping in the debugger, having many tabs with new files opened in the editor can clutter it up. To keep your editor clear, you can view files in a single tab, rather than opening each file in a new one. Just enable Preview Tab.
Enabling Preview Tab affects more than just the debugger behavior – it’s an IDE-wide feature affecting the way files are opened in the editor. Check out the documentation if you want to learn more.
Debugger on Windows
On Windows, if you use the Microsoft Visual C++ compiler toolchain, the debugger from Visual Studio is not allowed in CLion due to licensing restrictions. That’s why CLion provides its own LLDB-based debugger. The same debugger is also used in Rider for Unreal Engine Preview, and unsurprisingly it has evolved quickly, thanks to the huge amount of feedback we get on it from the users.
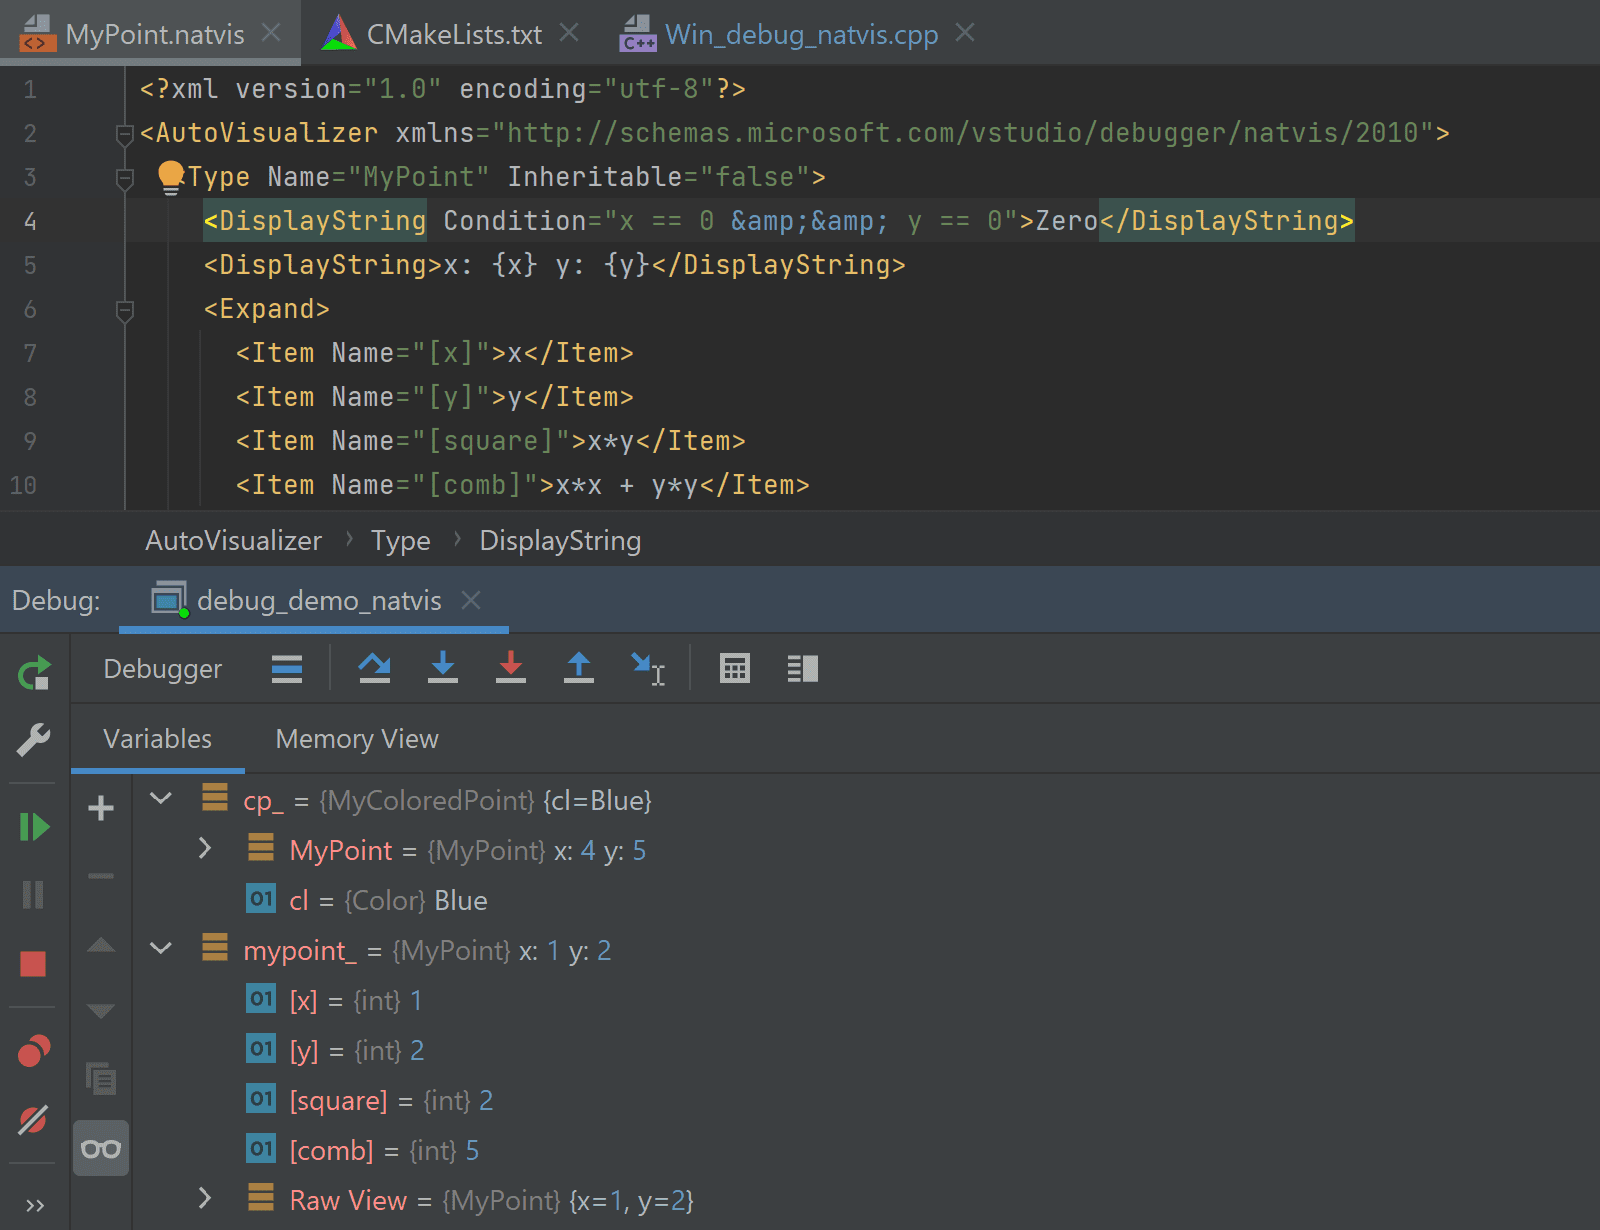
In CLion 2021.2, this LLDB-based debugger gets a massive overhaul to achieve better data rendering. The change affects both built-in rendering and Natvis support. For example, CLion now automatically generates colored one-line summaries for all structures not covered by Natvis, shows the [Raw View] for Natvis-generated values, and more. You can check all the details here.
Windows users can now debug with core dumps. The same Run | Open Core Dump action as previously on Linux and macOS helps start debugging sessions on Windows. Finally, it’s now possible to switch to the cmd.exe console to run and debug applications instead of using the internal CLion console.
LLDB
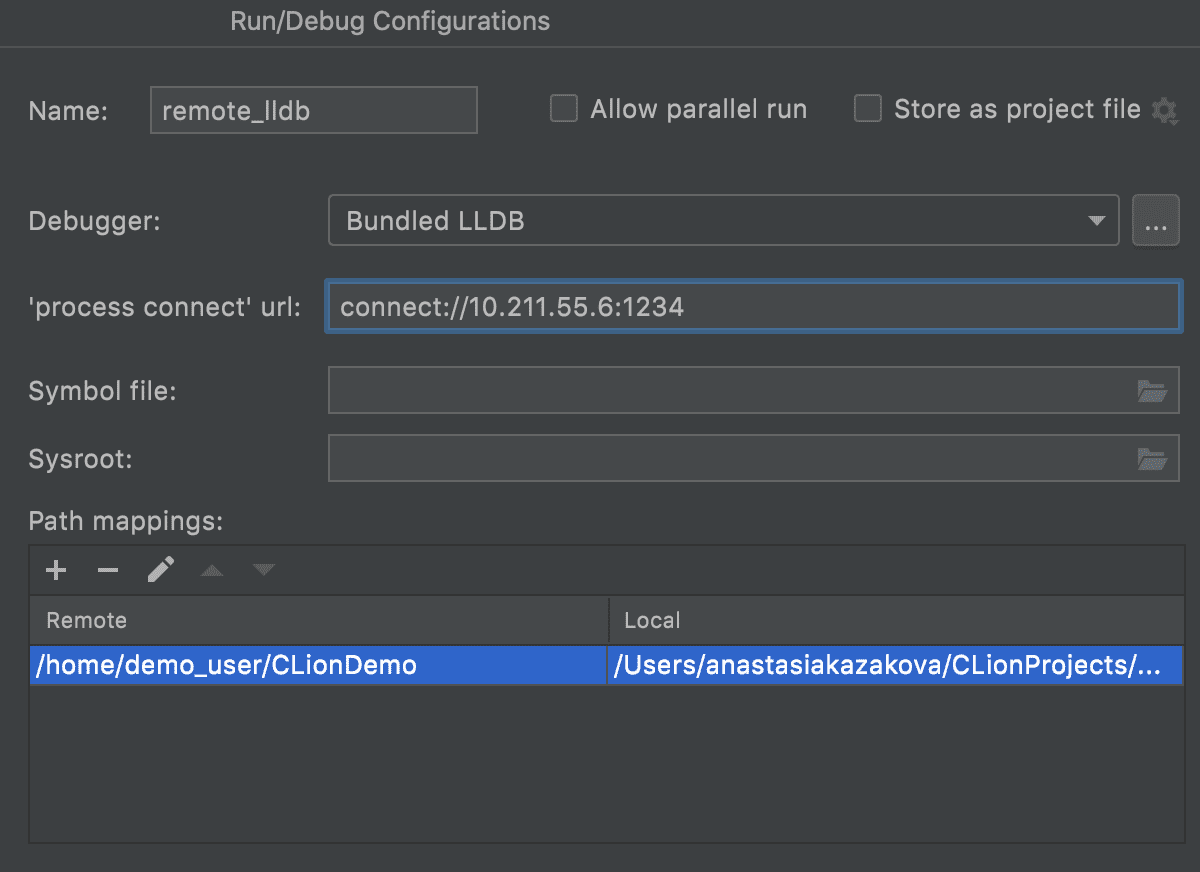
In CLion, you can debug any arbitrary executable remotely. This is now possible with both GDB and LLDB. We renamed the GDB Remote Debug configuration to Remote Debug and made it serve both LLDB and GDB remote debug cases:
On a remote host, you’ll need to launch lldb-server/debugserver. Check out our web help for more details.
To improve debugging with LLDB, LLDB v12.0 is now bundled in CLion 2021.2.
FreeRTOS thread view
FreeRTOS is a real-time operating system for microcontrollers. To debug applications using FreeRTOS, CLion provides a view of FreeRTOS tasks (threads) with their names and current statuses in the debug tool window:
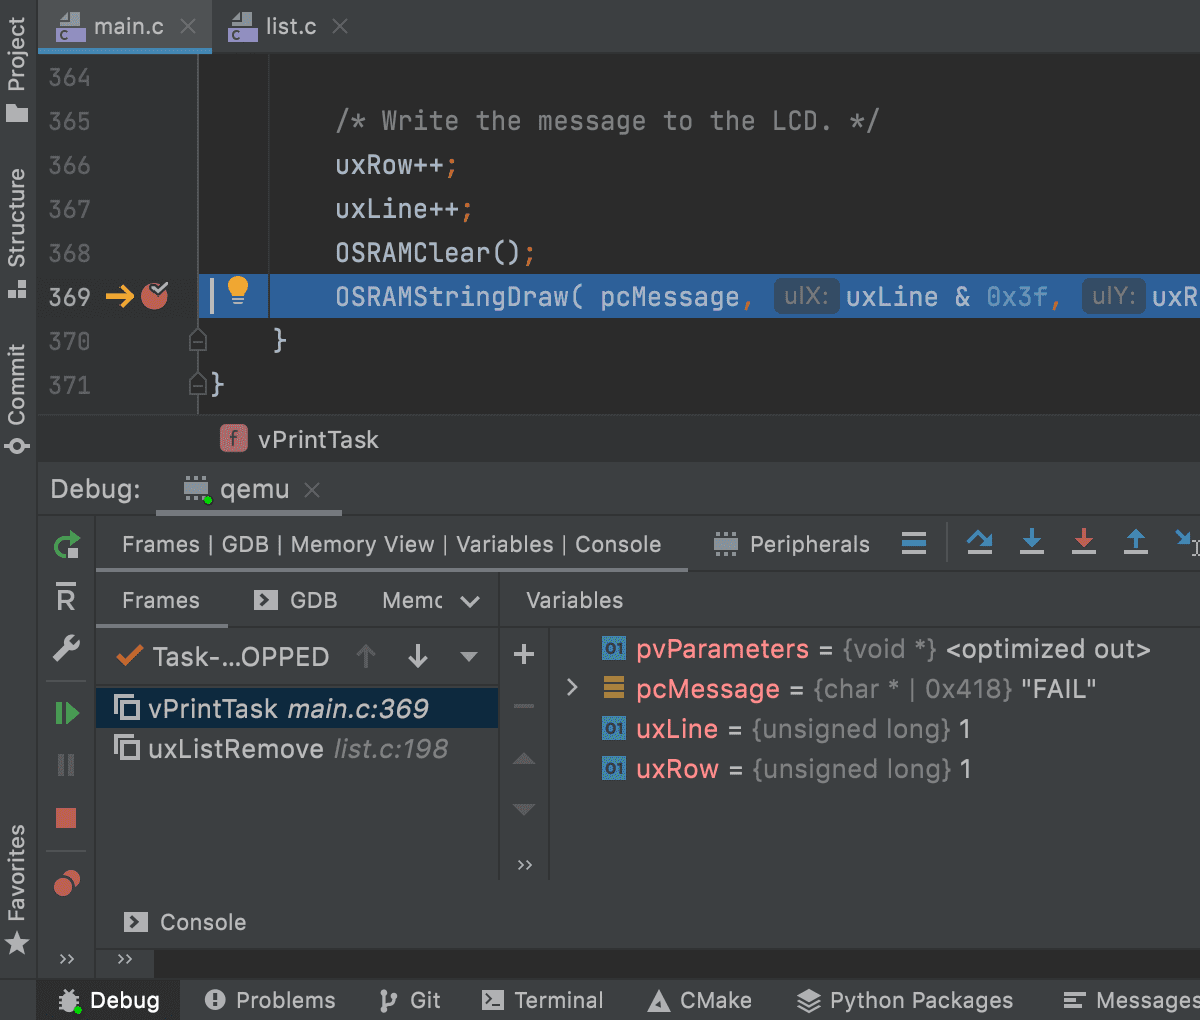
To get the FreeRTOS thread view, turn it on in Settings/Preferences | Build, Execution, Deployment | Embedded Development | RTOS Integration. Learn more in our online documentation.
Cling interpreter
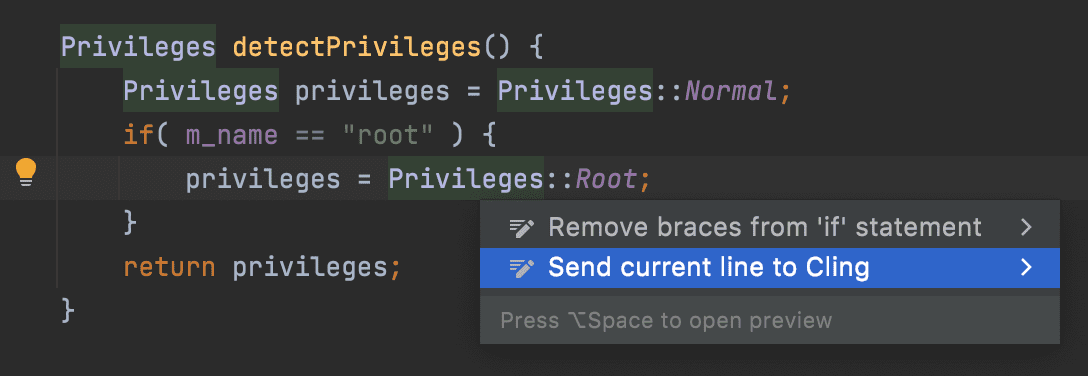
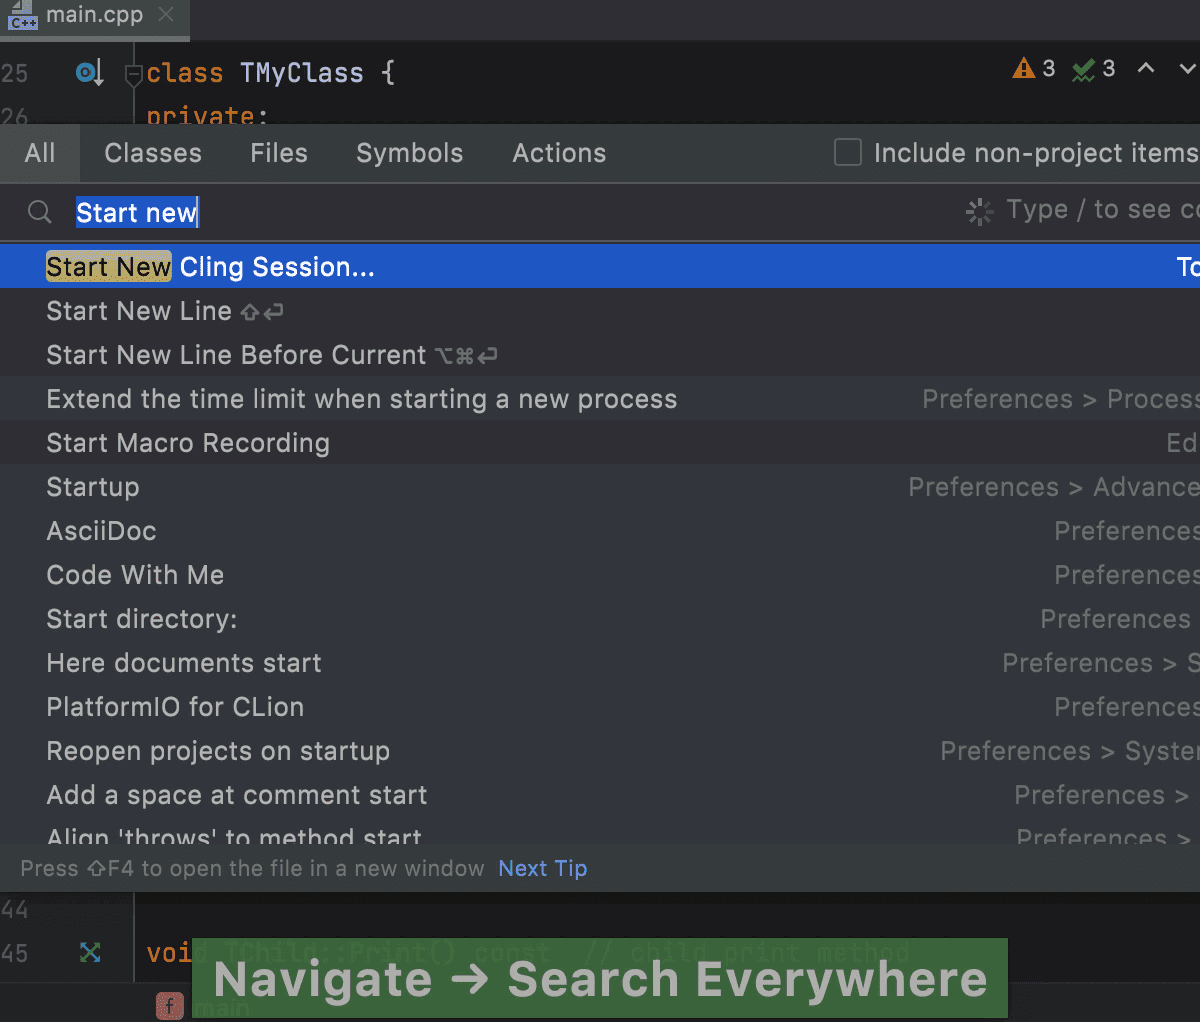
When studying C++ or prototyping something new, you might want a playground to check out your ideas, as in other languages. The Cling interpreter can help you with this! All you need to do to start using it is just download the Cling executable for your platform or install it via your OS-specific dependency manager, and configure a path to it in Settings/Preferences | Languages & Frameworks | C/C++ | Cling.
The IDE integration provides you with an IDE action to start the Cling session and a set of code intentions that allow you to send the current line or selection to Cling:
Of course, you can simply type code directly in the Cling terminal:
Object lifetimes static analysis
According to the C++ Foundation Developer Survey, memory safety issues like use-after-free/delete are among the top points of frustration for C++ developers. Many thanks to Herb Sutter for his Lifetime safety proposal that is trying to address these issues in C++.
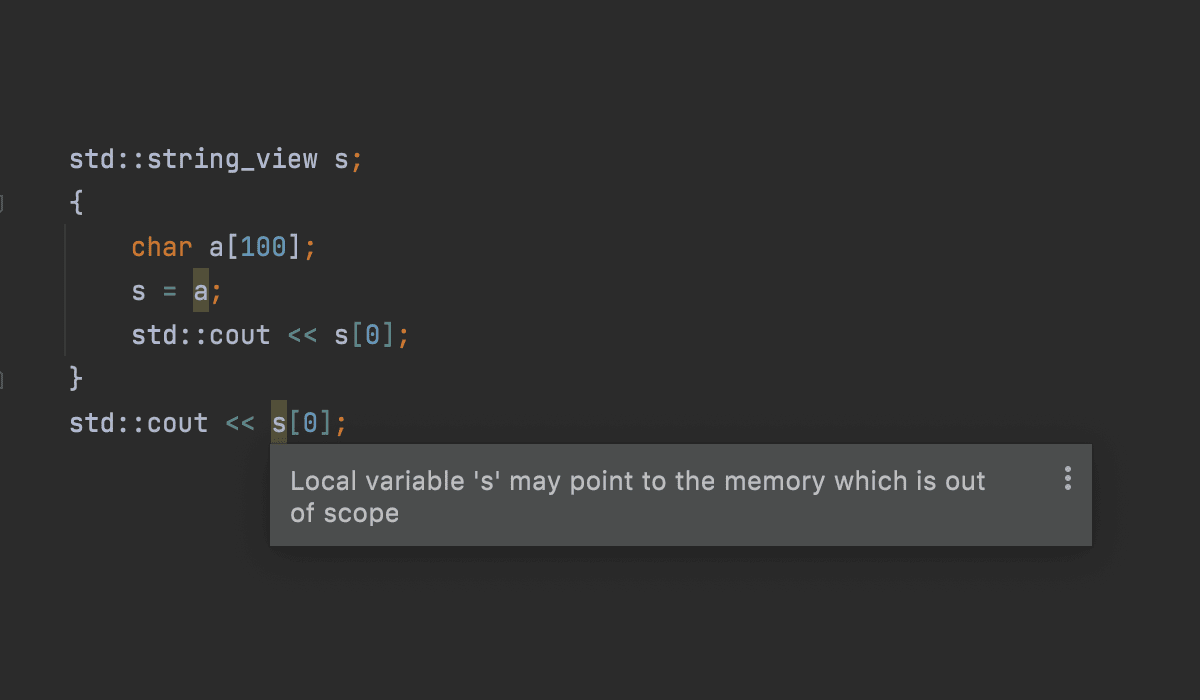
The proposal is not yet in the C++ standard, and major C++ compilers are not adopting it actively currently. But you don’t have to worry – CLion’s built-in static analyzer can check object lifetimes for you now!
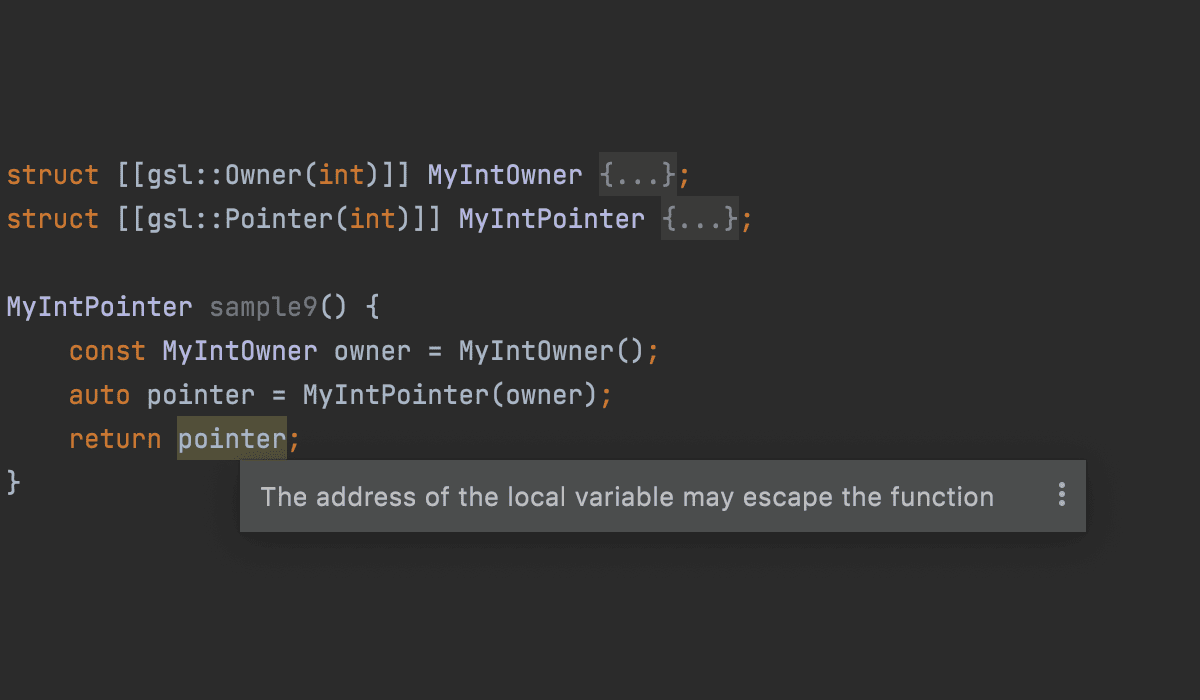
CLion catches common cases of dangling pointers and escaping from a local scope:
Additionally, mark your code with GSL annotations and help CLion catch even more potential Lifetimes issues:
Profiling in remote mode and on WSL
Eliminate performance issues in your code by using profiler integration in CLion. With the CLion 2021.2 release, profiling is now possible in remote mode and on WSL! To do so, configure the path to the Perf tool in CLion Settings/Preferences | Build, Execution, Deployment | Dynamic Analysis Tools | Perf.
While we are on the WSL topic, CLion now supports WSL whether it’s installed from the Microsoft Store or a custom distribution. All WSL distributions returned by the wsl -l -v command should now be listed in the WSL drop-down list in Settings | Build, Execution, Deployment | Toolchains.
Version Control and Local History
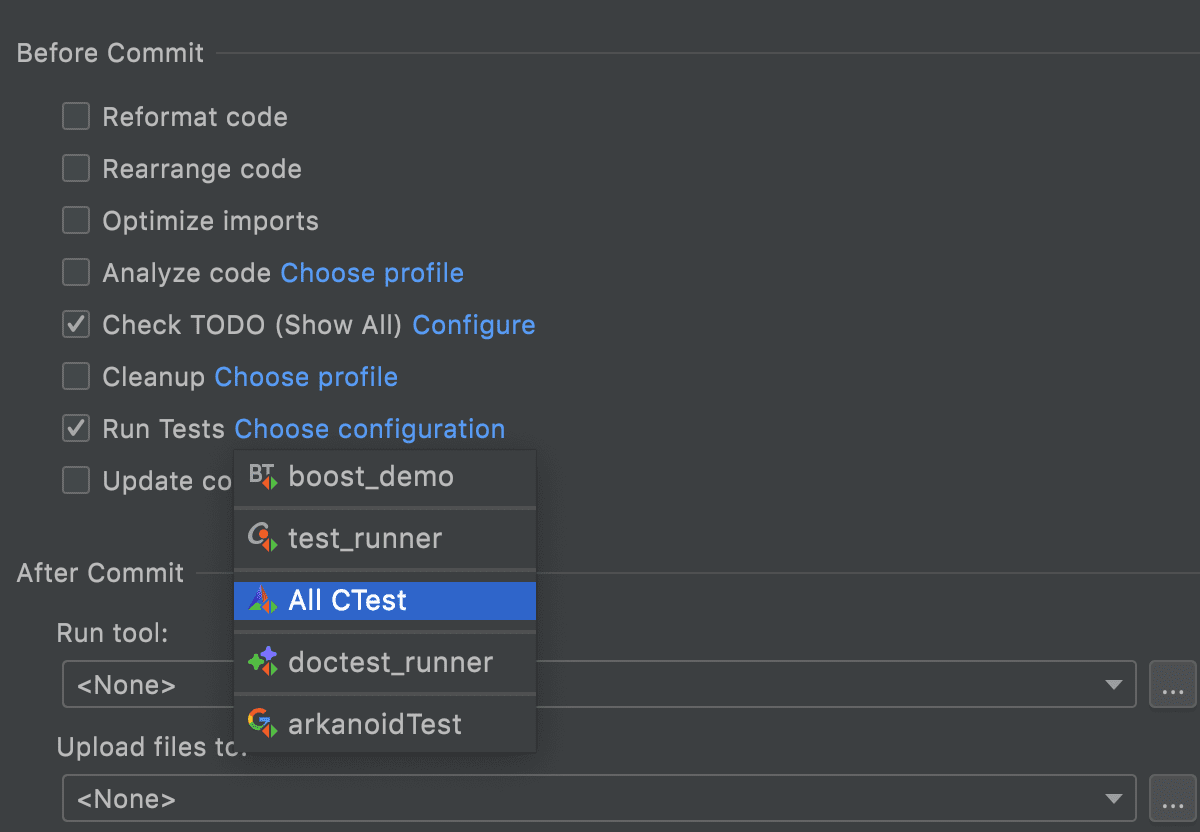
To make sure your commit is good enough, you can analyze the code with the customized profile or even run the selected test configuration before actually committing the code:
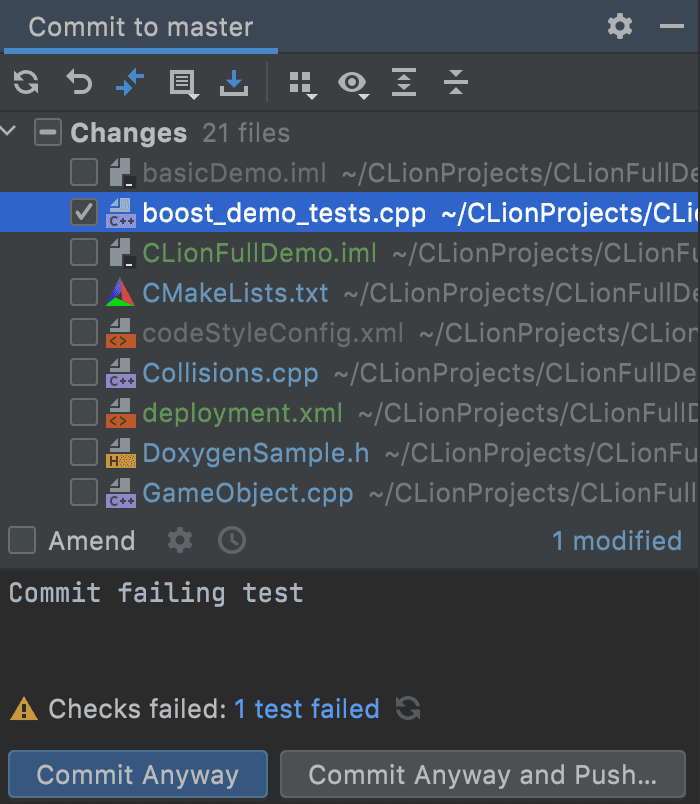
If the test fails, you can review the details and rerun the commit checks after the necessary fixes:
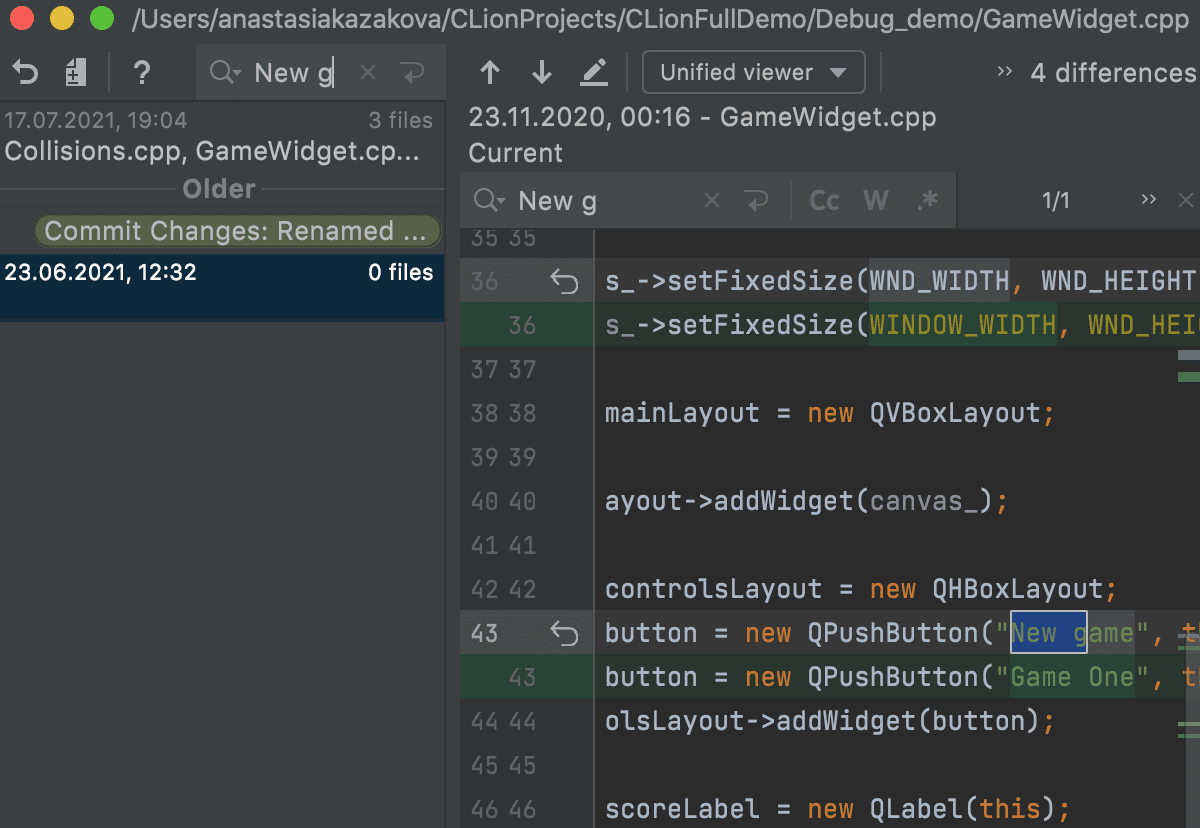
What if your project is not under the version control? Local History can help save you from accidental changes! You can now search through file revisions. This is useful if you need to look for something you’ve accidentally removed and revert the change:
Plugins update
Starting from this release, you can use CLion with a localized UI in Chinese, Korean, and Japanese. Install the non-bundled language pack plugins in Settings/Preferences | Plugins.
For Rust users, IntelliJ Rust introduced a new name resolution engine and initial WSL support. The plugin is now also capable of expanding certain procedural macros. We’ll publish a separate blog post about these changes later.
Other changes
Finally, we want to briefly mention some other valuable enhancements:
- Postfix code completion in C++ now works for literals.
- If you want certain operations to be performed on Save, you can now configure them all in one place in Settings/Preferences | Tools | Actions on Save.
- When using remote development mode for developing in Docker, you can use the “Local or mounted folder” connection type to avoid unnecessary source synchronization.
- You can now configure the colors that are used in Doxygen comments in Settings/Preferences | Editor | Color Scheme | C/C++ | Comments | Doxygen.
That’s it for now – we’ll publish a roadmap for CLion 2021.3 soon! Some features, such as custom compiler support and more debugger variables render enhancements, that we planned for the 2021.2 release cycle were moved to the next release, even though we started them during this iteration. This was done as we want to guarantee the best quality of the changes we deliver. Stay tuned!
We encourage you to give CLion 2021.2 a try. Update today if you have an active subscription, or start your free 30-day trial to evaluate the new features!
Your CLion team
JetBrains
The Drive to Develop