.NET Tools
Essential productivity kit for .NET and game developers
Unusual Ways of Boosting Up App Performance. Boxing and Collections

This is a first post in the series. The other ones can be found here:
- Unusual Ways of Boosting Up App Performance. Strings
- Unusual Ways of Boosting Up App Performance. Lambdas and LINQs
Many developers today are familiar with the performance profiling workflow: You run an application under the profiler, measure the execution times of methods, identify methods with high ‘own time,’ and work on optimizing them. This scenario, however, does not cover one important performance aspect: the time distributed among numerous garbage collections in your app. Of course you can evaluate the total time required for GC, but where does it come from, and how to reduce it? ‘Plain vanilla’ performance profiling won’t give you any clue about that.
Garbage collections always result from high memory traffic: the more memory is allocated, the more must be collected. As all we know, memory traffic optimization should be done with the help of a memory profiler. It allows you to determine how objects were allocated and collected and what methods stay behind these allocations. Looks simple in theory, right? However, in practice many developers end up with the words, “Okay, so some traffic in my app is generated by some system classes whose names I see for the first time in my life. I guess this could be because of some poor code design. What do I do now?”
This is what this post is about. Actually, this will be a series of posts where we share our experience of memory traffic profiling: what we consider ‘poor code design,’ how to find its traces in memory, and, of course, what we consider best practices.* Here’s a simple example: If you see objects of a value type in the heap, then surely boxing is to blame. Boxing always implies additional memory allocation, so removing is very likely to make your app better.
The first post in the series will focus on boxing. Where to look and how to act if a ‘bad memory pattern’ is detected?
*Best practices described in this series allowed us to increase the performance of certain algorithms in our .NET products by 20%-50%.
What Tools You Will Need
Before we go any further, let’s look at the tools we’ll need. The list of tools we use here at JetBrains is pretty short:
-
dotMemory memory profiler.
The profiling algorithm is always the same regardless of the issue you’re trying to find:-
Start profiling your application with memory traffic collection enabled.
-
Collect a memory snapshot after the method or functionality you’re interested in finishes working.
-
Open the snapshot and select the Memory Traffic view.
-
- ReSharper plugin called Heap Allocations Viewer. The plugin highlights all places in your code where memory is allocated. This is not a must, but it makes coding much more convenient and in some sense ‘forces’ you to avoid excessive allocations.
Boxing
Boxing is converting a value type to the object type. For example: ![]()
Why is this a problem? Value types are stored in the stack, while reference types (object) are stored in the managed heap. Therefore, to assign an integer value to an object, CLR has to take the value from the stack and copy it to the heap. Of course, this movement impacts app performance.
How to Find
With dotMemory, finding boxing is an elementary task:
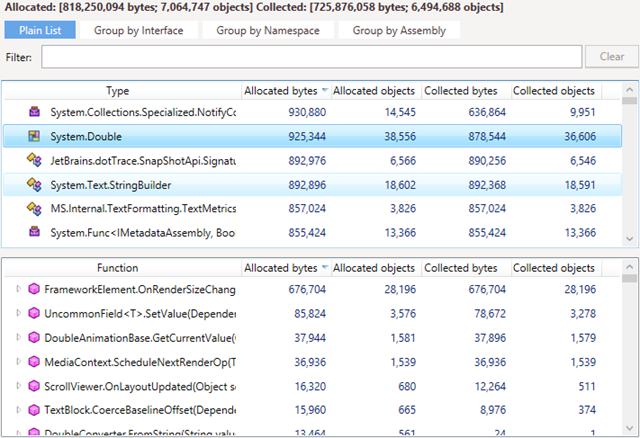
- Open a memory snapshot and select the Memory Traffic view.
- Find objects of a value type. All these objects are the result of boxing.
- Identify methods that allocate these objects and generate a major portion of the traffic.
 The Heap Allocations Viewer plugin also highlights allocations made because of boxing.
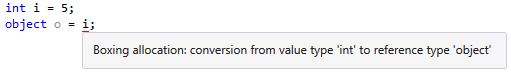
The main concern here is that the plugin shows you only the fact of a boxing allocation. But from the performance perspective, you’re more interested in how frequently this boxing takes place. E.g., if the code with a boxing allocation is called once, then optimizing it won’t help much. Taking this into account, dotMemory is much more reliable in detecting whether boxing causes real problems.
How to Fix
First of all: before fixing the boxing issue, make sure it really is an issue, i.e. it does generate significant traffic. If it does, your task is clear-cut: rewrite your code to eliminate boxing. When you introduce some struct type, make sure that methods that work with this struct don’t convert it to a reference type anywhere in the code. For example, one common mistake is passing variables of value types to methods working with strings (e.g., String.Format):
A simple fix is to call the ToString() method of the appropriate value type:![]()
Resizing Collections
Dynamically-sized collections such as Dictionary, List, HashSet, and StringBuilder have the following specifics: When the collection size exceeds the current bounds, .NET resizes the collection and redefines the entire collection in memory. Obviously, if this happens frequently, your app’s performance will suffer.
How to Find
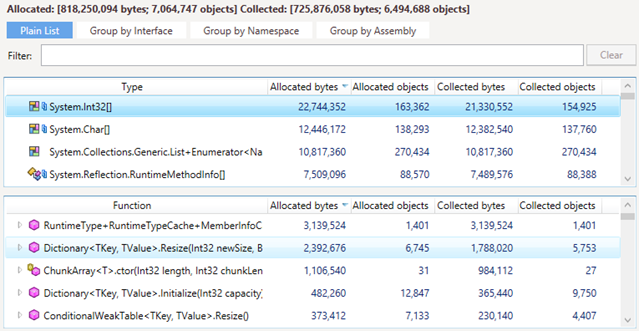
The insides of dynamic collections can be seen in the managed heap as arrays of a value type (e.g. Int32 in case of Dictionary) or of the String type (in case of List). The best way to find resized collections is to use dotMemory. For example, to find whether Dictionary or HashSet objects in your app are resized too often:
- Open a memory snapshot on the Memory Traffic view.
- Find arrays of the
System.Int32type. - Find the
Dictionary<>.ResizeandHashSet<>.SetCapacitymethods and check the traffic they generate.
 The workflow for the
 List collections is similar. The only difference is that you should check the System.String arrays and the List<>.SetCapacity method that creates them.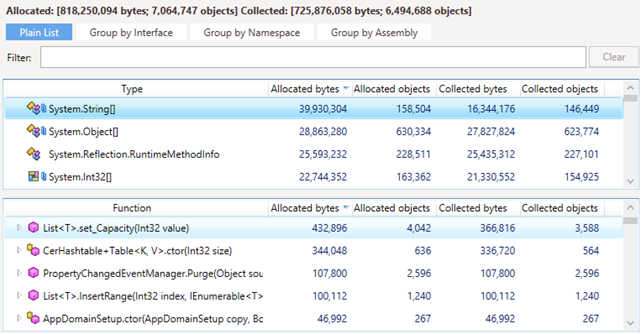 In case of
 StringBuilder, look for System.Char arrays created by the StringBuilder.ExpandByABlock method. 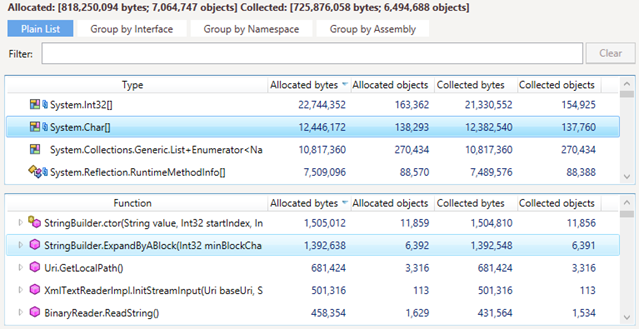
How to Fix
If the traffic caused by the ‘resize’ methods is significant, the only solution is reducing the number of cases when the resize is needed. Try to predict the required size and initialize a collection with this size or larger. ![]()
In addition, keep in mind that any allocation greater than or equal to 85,000 bytes goes on the Large Object Heap (LOH). Allocating memory in LOH has some performance penalties: as LOH is not compacted, some additional interaction between CLR and the free list is required at the time of allocation. Nevertheless, in some cases allocating objects in LOH makes sense, for example, in the case of large collections that must endure the entire lifetime of an application (e.g. cache).
Enumerating Collections
When working with dynamic collections, pay attention to the way you enumerate them. The typical major headache here is enumerating a collection using foreach only knowing that it implements the IEnumerable interface. Consider the following example: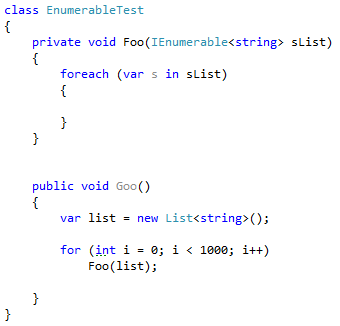
The list in the Foo method is cast to the IEnumerable interface, which implies further boxing of the enumerator.
How to Find
As with any other boxing, the described behavior can be easily seen in dotMemory.
- Open a memory snapshot and select the Memory Traffic view.
- Find the
System.Collections.Generic.List+Enumeratorvalue type and check generated traffic. - Find methods that originate those objects.
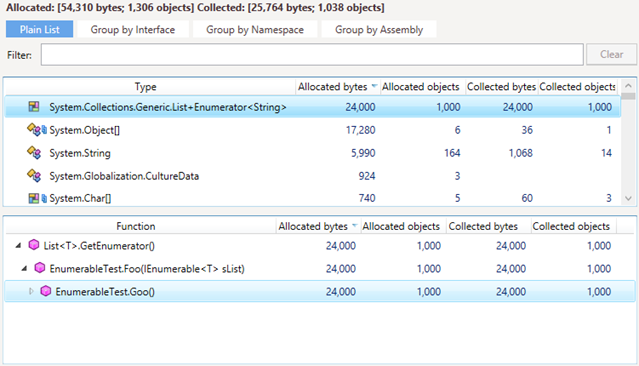 As you can see, a new enumerator was created each time we called the
 Foo method.
The same behavior applies to arrays as well. The only difference is that you should check traffic for the SZArrayHelper+SZGenericArrayEnumerator<> class.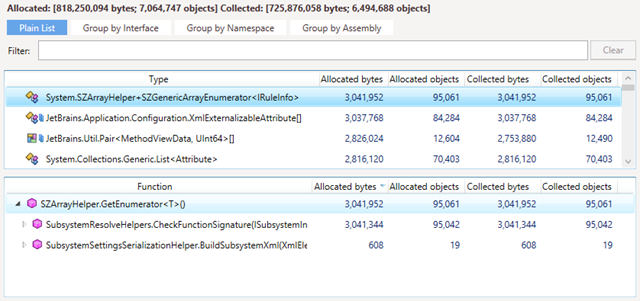 The Heap Allocation Viewer plug-in will also warn you about hidden allocations:
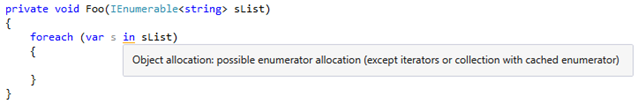
How to Fix
Avoid casting a collection to an interface. In our example above, the best solution would be to create a Foo method overload that accepts the List<string> collection.
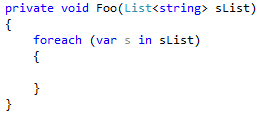
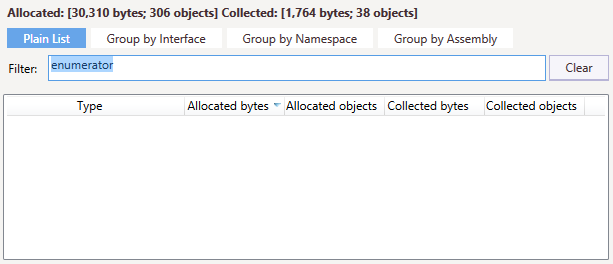
If we profile the code after the fix, we’ll see that the Foo method doesn’t create enumerators anymore.
In the next installment of this series, we’re going to take a look at the best approaches for working with strings. Stay tuned!
Subscribe to a monthly digest curated from the .NET Tools blog: