.NET Tools
Essential productivity kit for .NET and game developers
Smart Tooltips in dotTrace 2016.1
If you’ve used dotTrace integrated in Visual Studio before 2016.1, you probably noticed its main drawback compared to its standalone counterpart. It lacked the fully functional Threads diagram. The only ability to select threads was to use the Threads filter that had no way of selecting specific time intervals, viewing threads activity, and so on.
dotTrace 2016.1 removes this drawback by adding the exact same diagram you are used to using in the standalone dotTrace Timeline Viewer.
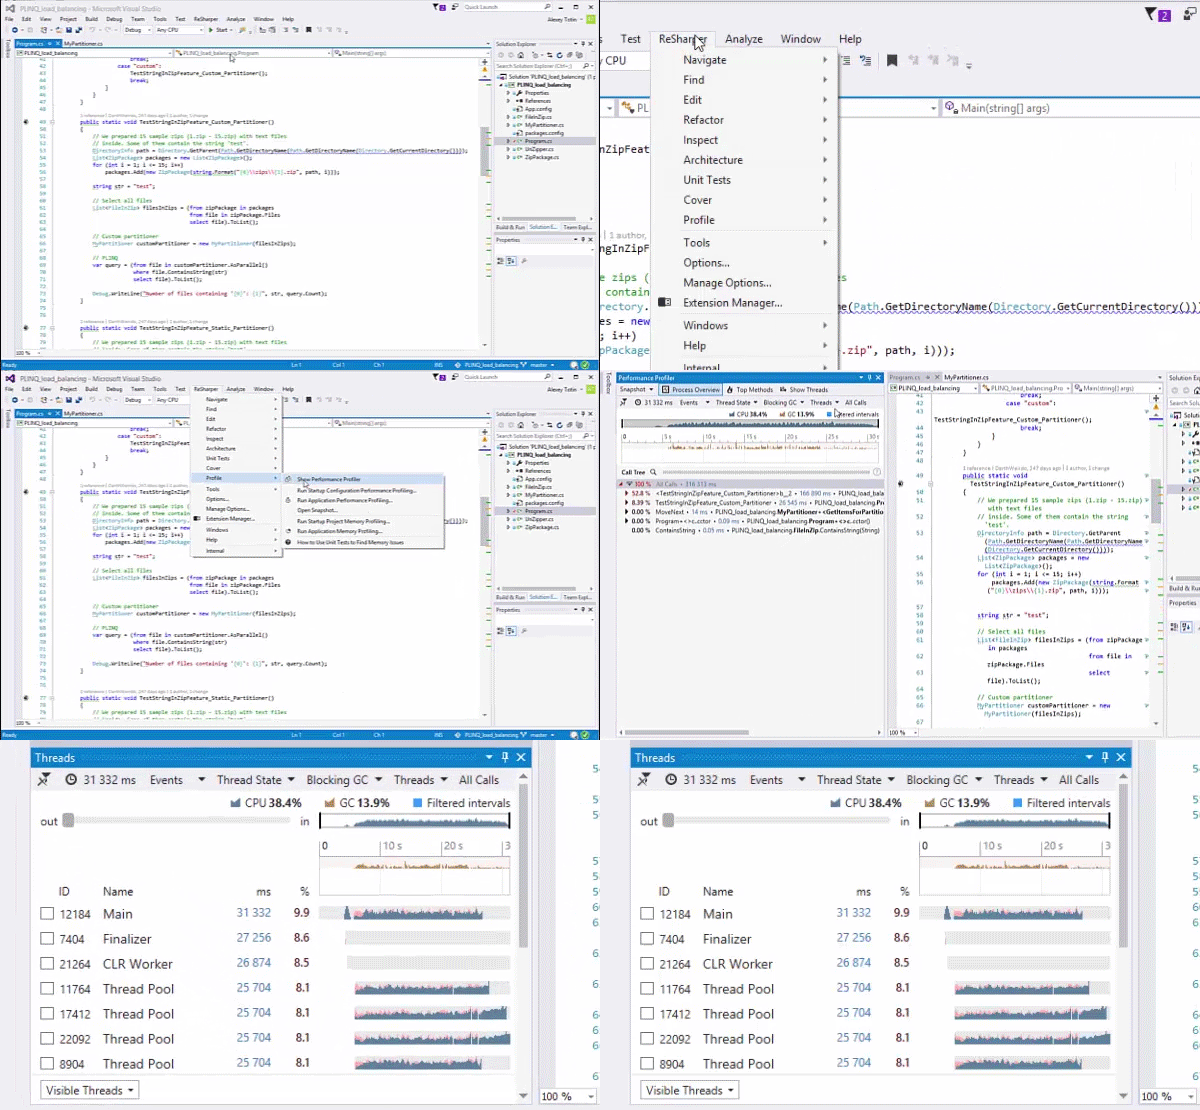
But that’s not all! The Threads diagram in both standalone and Visual Studio viewers gets smart tooltips. Hover the mouse over a specific time point on the timeline to see a tooltip showing the current thread state, executed method, and other info. Tooltips are context-sensitive: if some filter is applied, the tooltip will contain additional data on the filtered event.
Use these new tooltips to visually examine the control flow of your application without digging into the call tree.
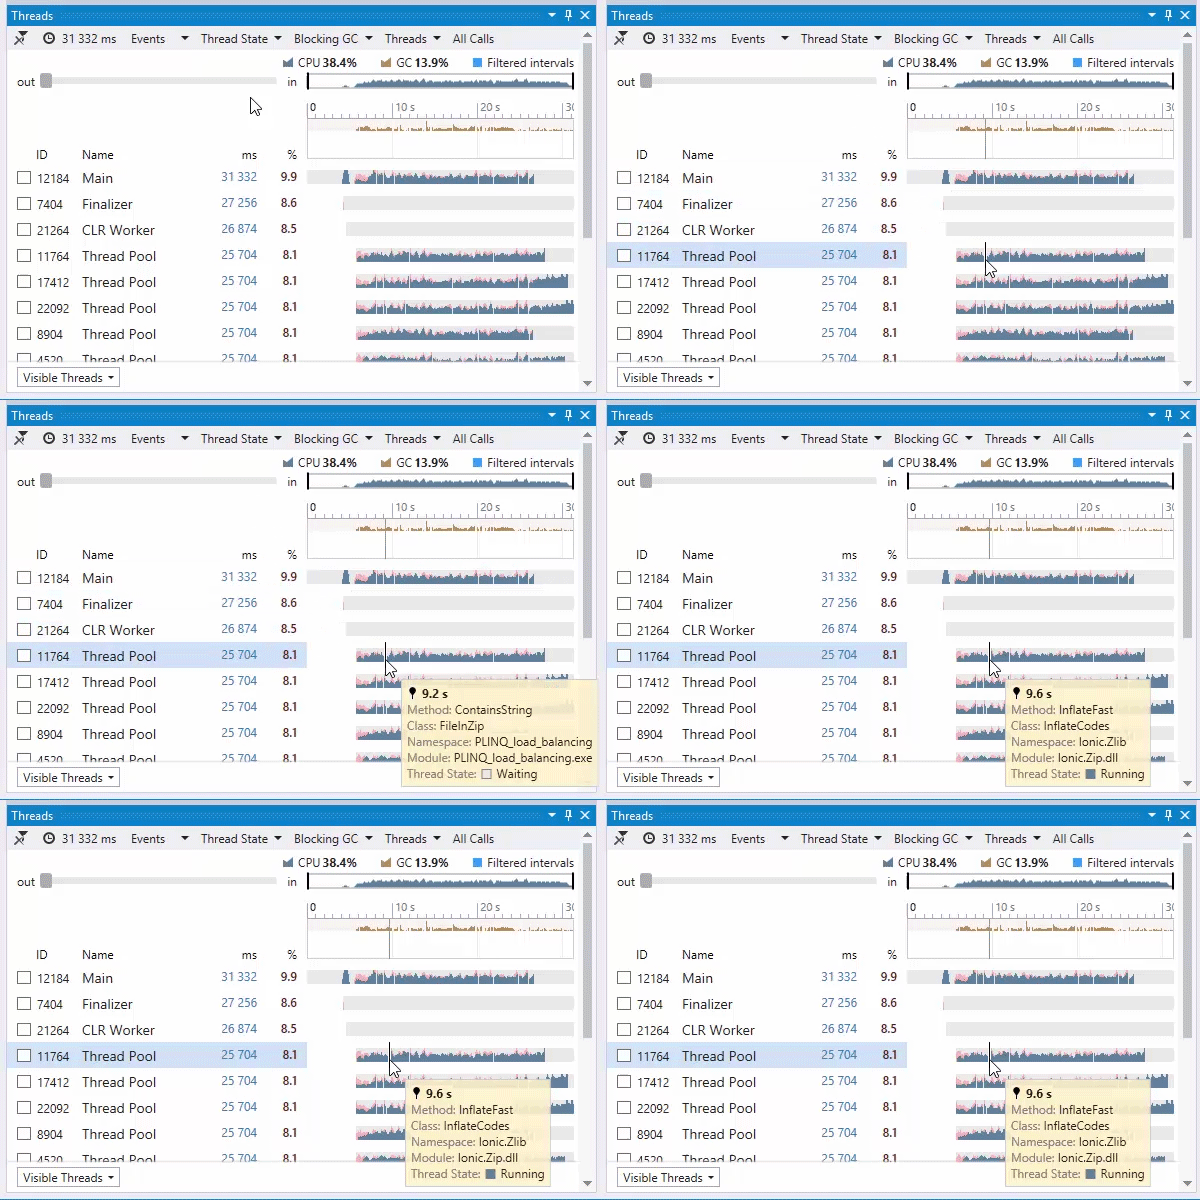
For example, when no event filters are applied, the tooltip will show only general data for the specific time point: the name of the method that was executed, class and namespace names, as well as thread state:
When you apply a filter, the tooltip will also contain info about the filtered event. For example, when you turn on the File I/O filter, the tooltip shows data on file operation, file name and data size:
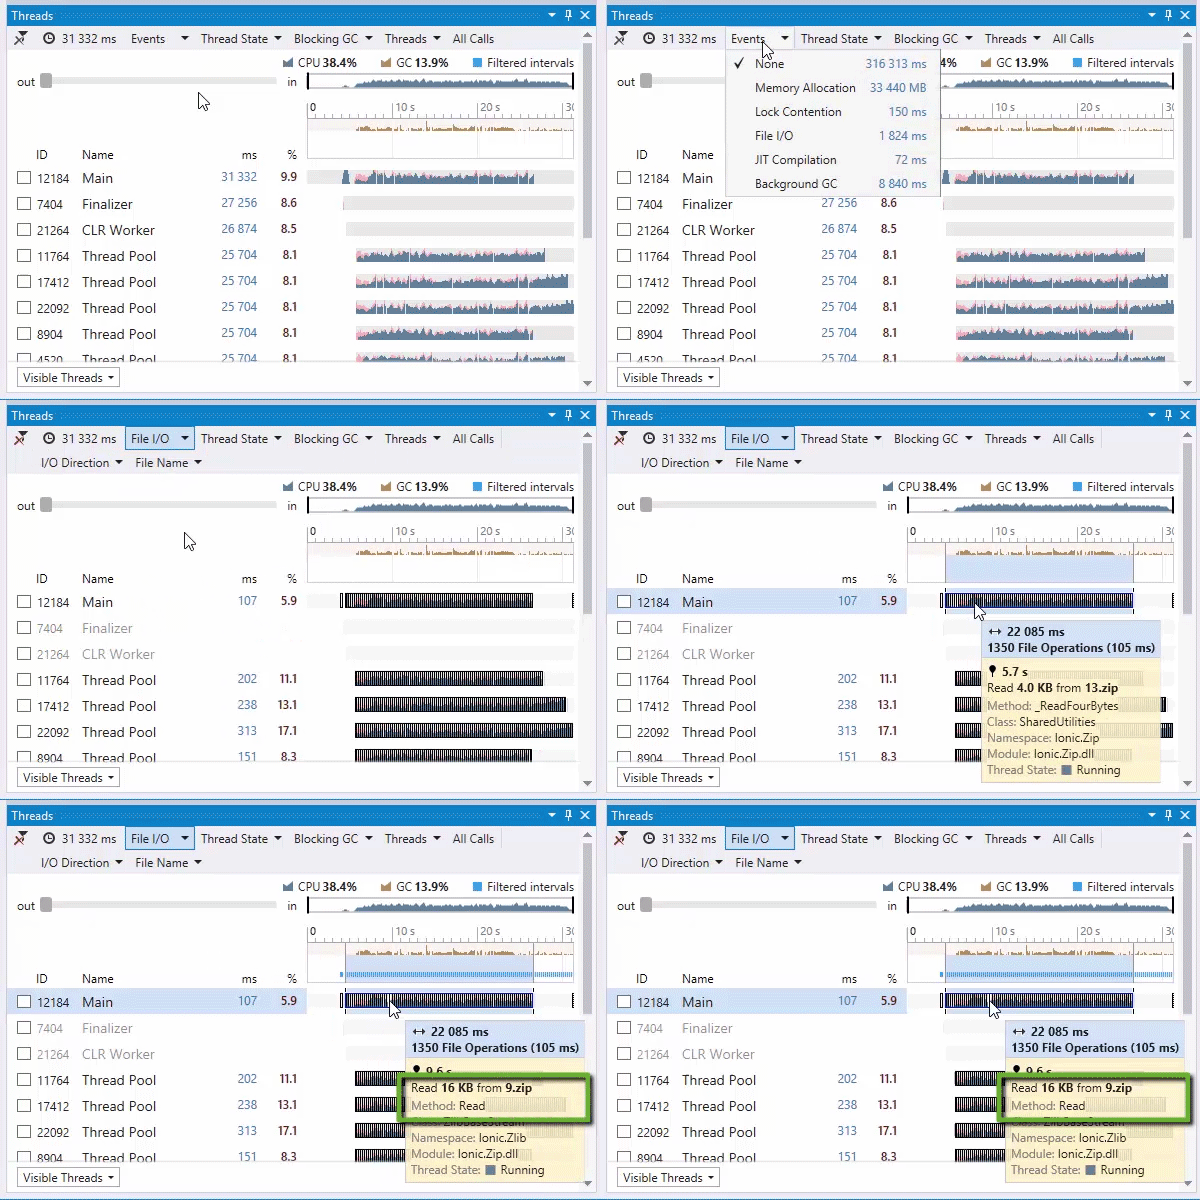
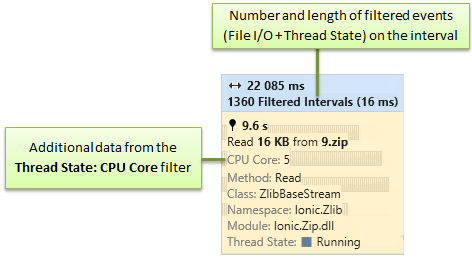
Note that the tooltip also shows data on the filtered time intervals: the overall length of the highlighted interval and how many events it contains:
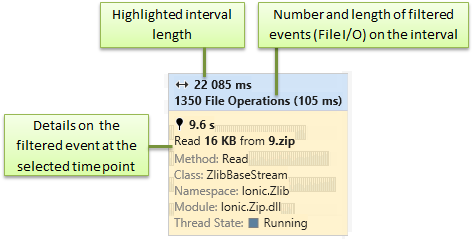
If you apply more filters, the tooltip will simply add their data to the list. For example, if you add the filter by Thread State, the tooltip will additionally show the CPU core data:
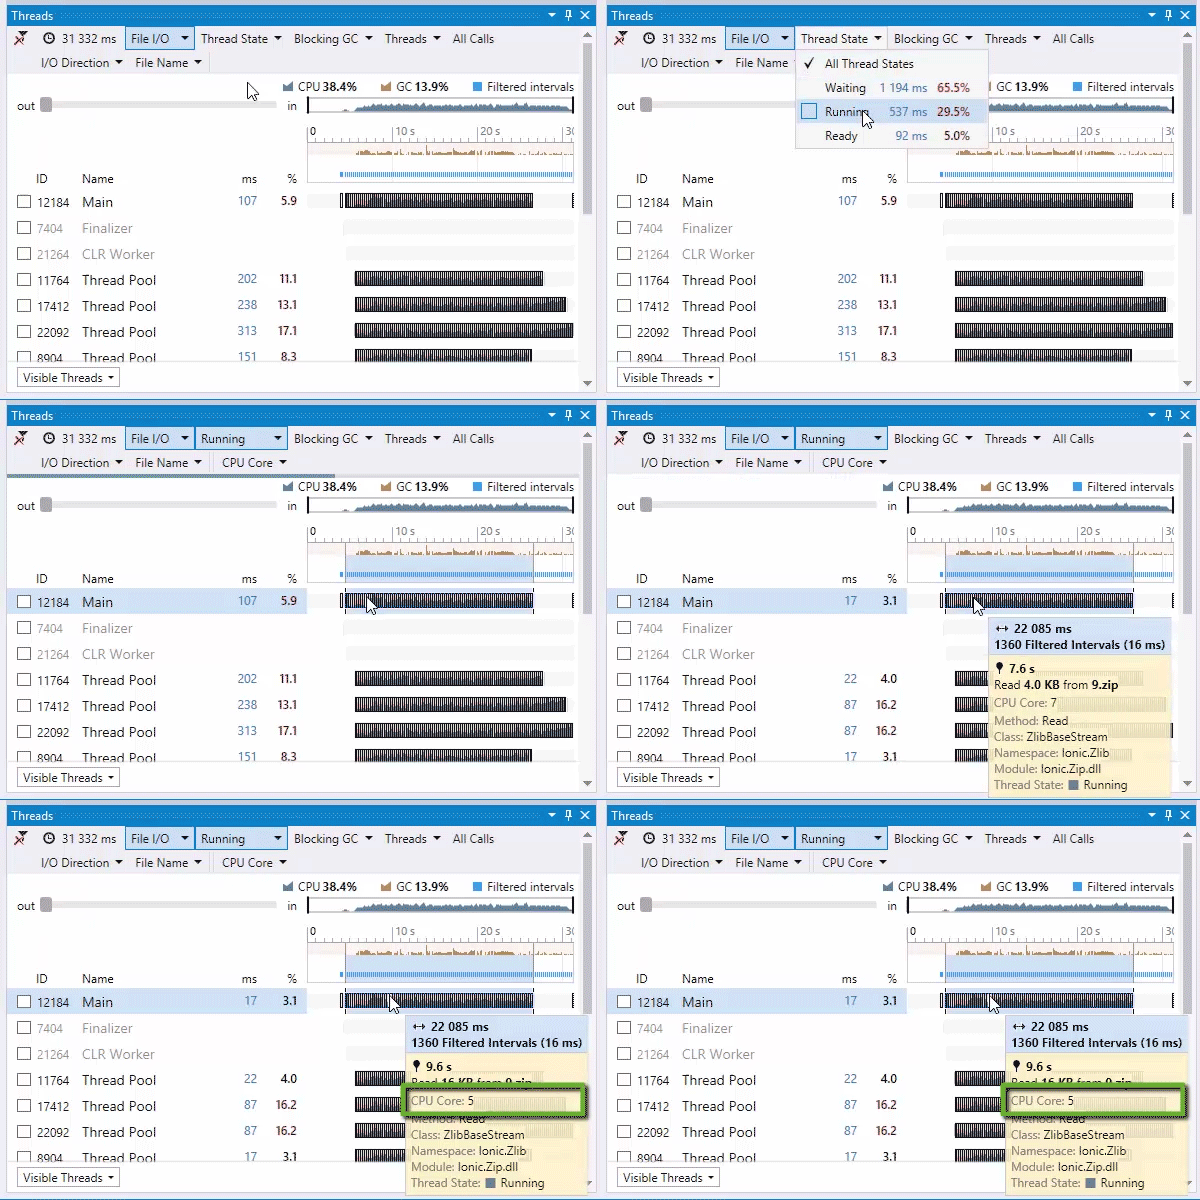
Note that data on the filtered time intervals at the top of the tooltip also gets updated:
We hope you find this new feature useful. Do try it on your own by installing the latest dotTrace 2016.1 from the ReSharper Ultimate toolset.
Subscribe to a monthly digest curated from the .NET Tools blog:


