

.NET Tools
Essential productivity kit for .NET and game developers
ReSharper Ultimate 2016.2 EAP: What’s new in builds 9-11

ReSharper Ultimate 2016.2 EAP has been open for over two months, and we are approaching release now. Most probably, the new things described below will round up the feature set of upcoming ReSharper Ultimate 2016.2. So here is what’s new in the latest EAP builds.
ReSharper
In addition to 100+ fixed issues in the mainline ReSharper, there are some new features worth mentioning:
-
Go to Text navigation (Ctrl+T,T,T) lets you quickly find and navigate to any text in source and textual files. This new feature uses trigram indexing to make text search blazingly fast. Similar to other navigation commands, if there are too many matching items you can hit + on the numeric keypad to explore results in the Find Results window.

-
Warnings in solution-wide analysis will help you constantly keep track of all warnings in your solution: both actual compiler warnings and ReSharper’s inspections with the ‘Warning’ severity level. Before, the status bar indicator would turn green as soon as the last error in the solution was fixed. Now, the indicator can stay orange while there are unresolved warnings. It is still up to you whether to enable the solution-wide analysis and whether to include warnings in it: just right-click the status bar indicator to configure everything.

-
A way to propagate XML documentation with the
<inheritdoc/>tag, which is a good alternative to copying documentation from base types/members to derivatives. Although the tag is non-standard, it is understood by tools such as NDoc, Sandcastle, and Stylecop; and there are also requests to support it in .NET Core and Roslyn.
So you can now use a context action to add the<inheritdoc/>comment to derived members; you can enable adding<inheritdoc/>automatically when generating missing/overriding members; the Quick Documentation popup will display the correct documentation even if the tag explicitly refers to specific symbol, i.e.<inheritdoc cref="SomeSymbol"/>. -
The Process Explorer window (ReSharper | Windows | Process Explorer), which was previously only available in dotPeek, provides you with the list of currently running processes, allows exploring their modules and decompiling those of them that are .NET assemblies.

-
New formatter options that let you control spaces before and after
++and--operators as well as spaces before and inside parenthesis ofcheckedanddefaultexpressions. - In terms of TypeScript, ReSharper now fully supports TypeScript 2.0. Another long awaited feature makes the main navigation commands (Go to Declaration and Find Usages) work correctly when dealing with type aliases.
ReSharper C++
-
You can now generate documentation comments for C++ symbols simply with a context action. If necessary, you can customize the comment stub by editing the ‘doc’ live template that ReSharper uses for generation.

-
When your caret is on one of a function’s exits (
return,throw, etc.) ReSharper C++ will automatically highlight all other function exits including exits from loops andswitchstatements. -
New code inspections and quick-fixes: ‘Missing default case in a
switchstatement’ and ‘Non-explicit conversion operator’ -
Code style for default pointer initializer. You can specify
0,nullptrorNULLas the preferred initializer in the options, and ReSharper will help you maintain this style in your code base.
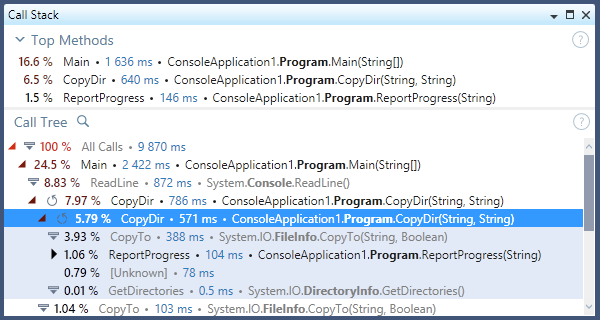
dotTrace
Recursive call stacks can be deep and difficult to analyze. Previously, Timeline Viewer would show call stacks “as is”, i.e recursive calls were simply shown as they were called: one after another in the stack trace. Of course, on complex call stacks with multiple recursive calls this would result in almost infinite stack scrolling. Now, Timeline Viewer allows you to fold such calls to streamline stack analysis.
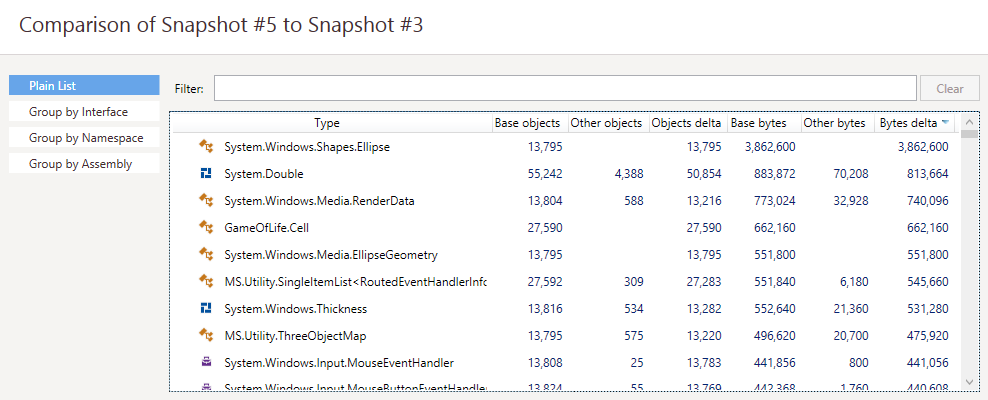
dotMemory
dotMemory now allows you to compare memory snapshots stored in different workspaces, or, in other words, collected in different profiling sessions.
For example, this can be useful to find out how particular changes in code affect your application’s memory usage. All you need are two snapshots taken before and after committing changes.
dotCover
-
Filtering processes from console runner lets you reduce unnecessary overhead by excluding child processes that are irrelevant to the coverage analysis. To enable a process filter, use the
/ProcessFiltersparameter. For example,/ProcessFilters=+:prA;+prBwill exclude all processes except prA and prB;/ProcessFilters=-:prCwill exclude prC from the coverage. - Hide auto-properties option allows you to exclude auto-properties from the coverage analysis.
Please feel free to download the latest 2016.2 EAP build and let us know what you think. If you have any problems, please raise issues in ReSharper, ReSharper C++, dotTrace, dotMemory or dotCover issue trackers.


