

.NET Tools
Essential productivity kit for .NET and game developers
Deep event analysis with dotTrace 2016.3

dotTrace 2016.3 introduces a new Events window which is available in both standalone dotTrace and dotTrace integrated in Visual Studio.
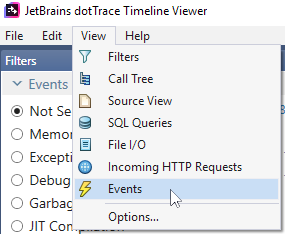
To open the window in the standalone Timeline Viewer, use the View | Events menu:
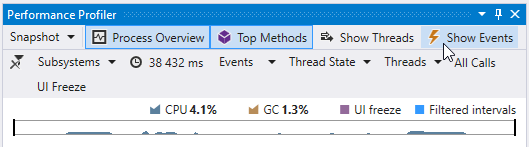
In Visual Studio, click Show Events in the Performance Profiler window:
What is the Events window?
It’s a tool window that shows the list of events that occurred in the profiled application, including file operations, HTTP requests, SQL queries, exceptions, and JIT compilation. By default, events are sorted by the time of their occurrence. Strictly speaking, it’s just an event log.
When would you want to use it?
Use the Events window like any other event log — for analyzing complex cases and bugs when the data provided by other filters is not enough.
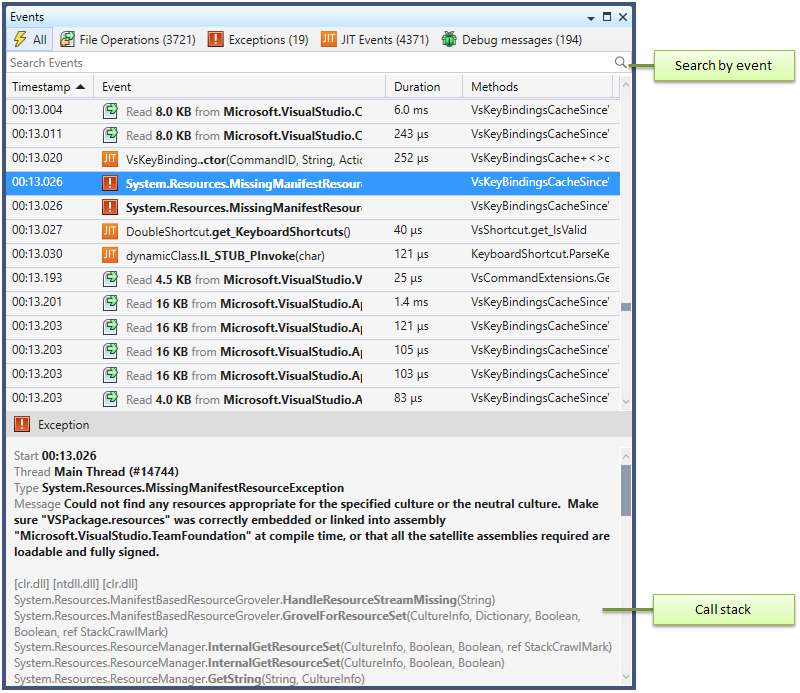
First of all, the Events window may help you analyze situations when a particular sequence of actions (e.g., SQL requests, file I/O, and so on) in your application leads to an exception. Regular timeline filters show you only aggregated information for a selected time interval, and it’s not easy to identify a correlation between actions and exceptions. On the contrary, the Events tool window shows the list of events in exactly the same order they occurred, which means you can determine what events preceded a particular exception.
To do this, narrow the time interval using standard timeline filters (to eliminate any events you don’t need) and then find particular events in the Events tool window. Use the search field at the top to help with your search. The Events tool window shows call stack information for every event so you can determine the call that originated the event right in place.
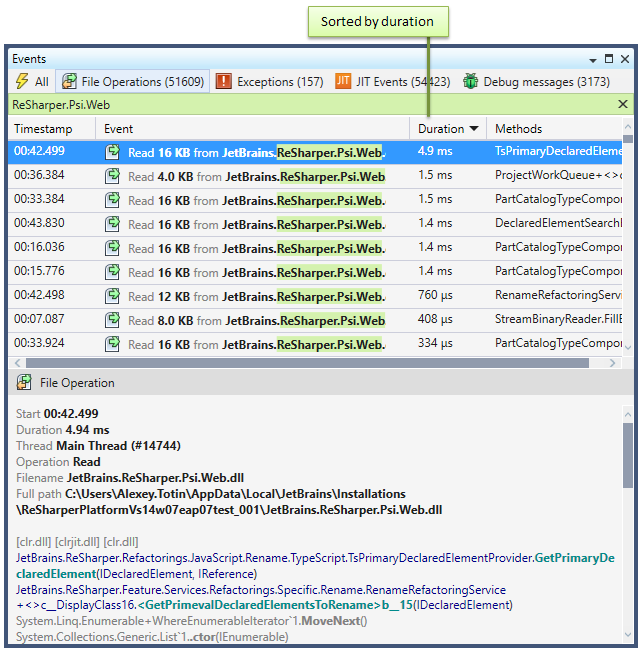
The second scenario where the list of events can help is when you need to refine your analysis results. Let’s assume that you used filters to find out that your application writes to a particular file 10 times and these writing operations are taking too long. With the Events tool window, you can go even deeper and find out which of those 10 events took the longest. If some events lasted longer than the others (simply sort the log by Duration), then it’s a good reason to look at the call stack that’s behind them.
As ever, we invite you to download the latest ReSharper Ultimate to try this and other new dotTrace features in practice.


