

.NET Tools
Essential productivity kit for .NET and game developers
Rider EAP 17: NuGet, unit testing, good and bad news on debugging

UPDATE: Rider EAP build 18 re-introduced CoreCLR debugging on Windows. Implementations for Linux and macOS will make their return later, stay tuned.
Ah, the scent of fresh software in the morning. We just published a fresh Rider Early Access Preview (EAP) version, go grab it! (Unless you’re about to debug .NET Core: if you are, read on first.)

What’s in this build? Significant performance improvements were made, shared projects are now supported, code inspection severity can be configured, settings for our unit test runner can be edited, various updates to the NuGet tool window UI, and more. Check out the list of fixes in this build if you feel like digging into details.
Before we proceed with good news about this build, we have to share some bad news: as of this build, we’re temporarily disabling CoreCLR debugging in Rider. Here’s why:
Debugging: bad news (about CoreCLR)
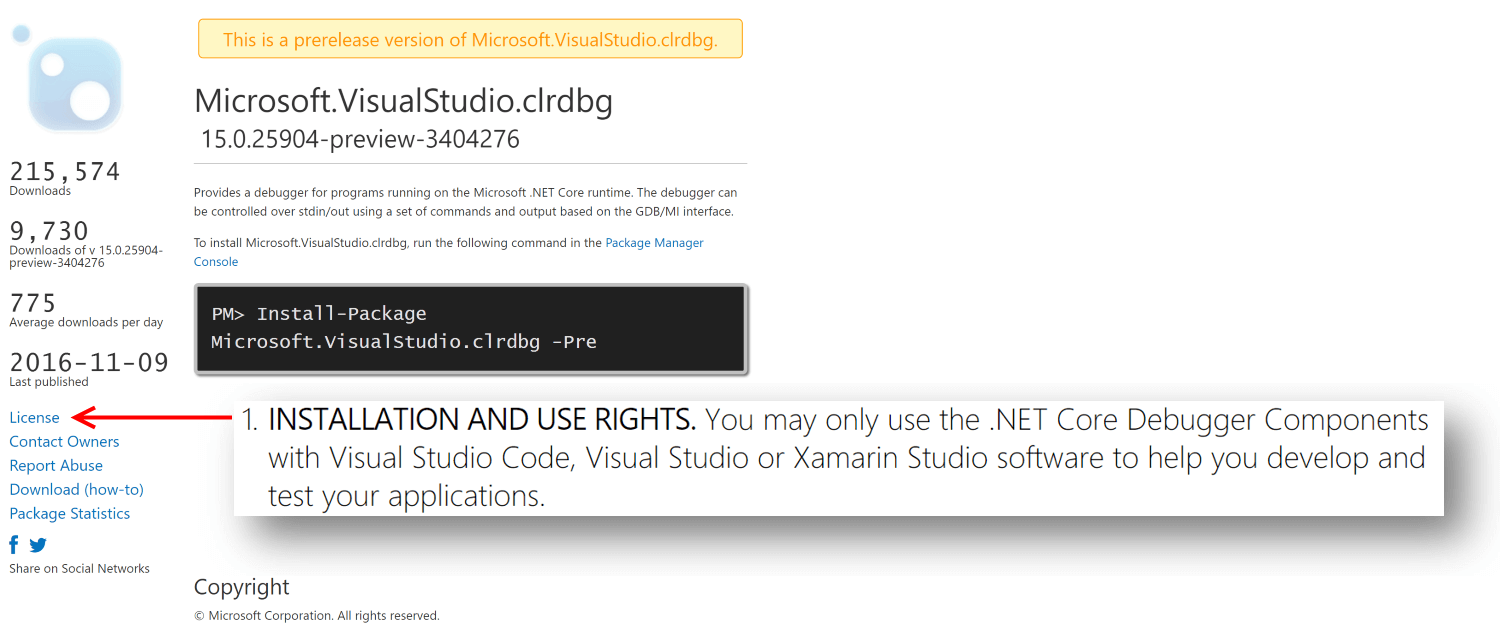
In the near future, Rider will not allow debugging .NET Core applications that target CoreCLR. This is due to a licensing issue with a package that we’ve been using*. We were using this functionality considering it part of .NET Core which is Open Source, but it turned out that this specific package has a different licensing model. It explicitly only allows usage from Visual Studio, VS Code or Xamarin Studio.
Given this is the only package that is available that exposes the debugging API for .NET Core, we are evaluating our options as to how to resolve the matter and will be looking to restore CoreCLR debugging functionality in coming months. In the meantime, if you want to debug .NET Core applications on Windows, you can target the full .NET runtime instead of CoreCLR.
* This might lead to a 404 as Microsoft have confirmed they mistakenly published the package on NuGet.org and will be removing it shortly.
Bad news over
Only good news ahead.
Debugging: good news
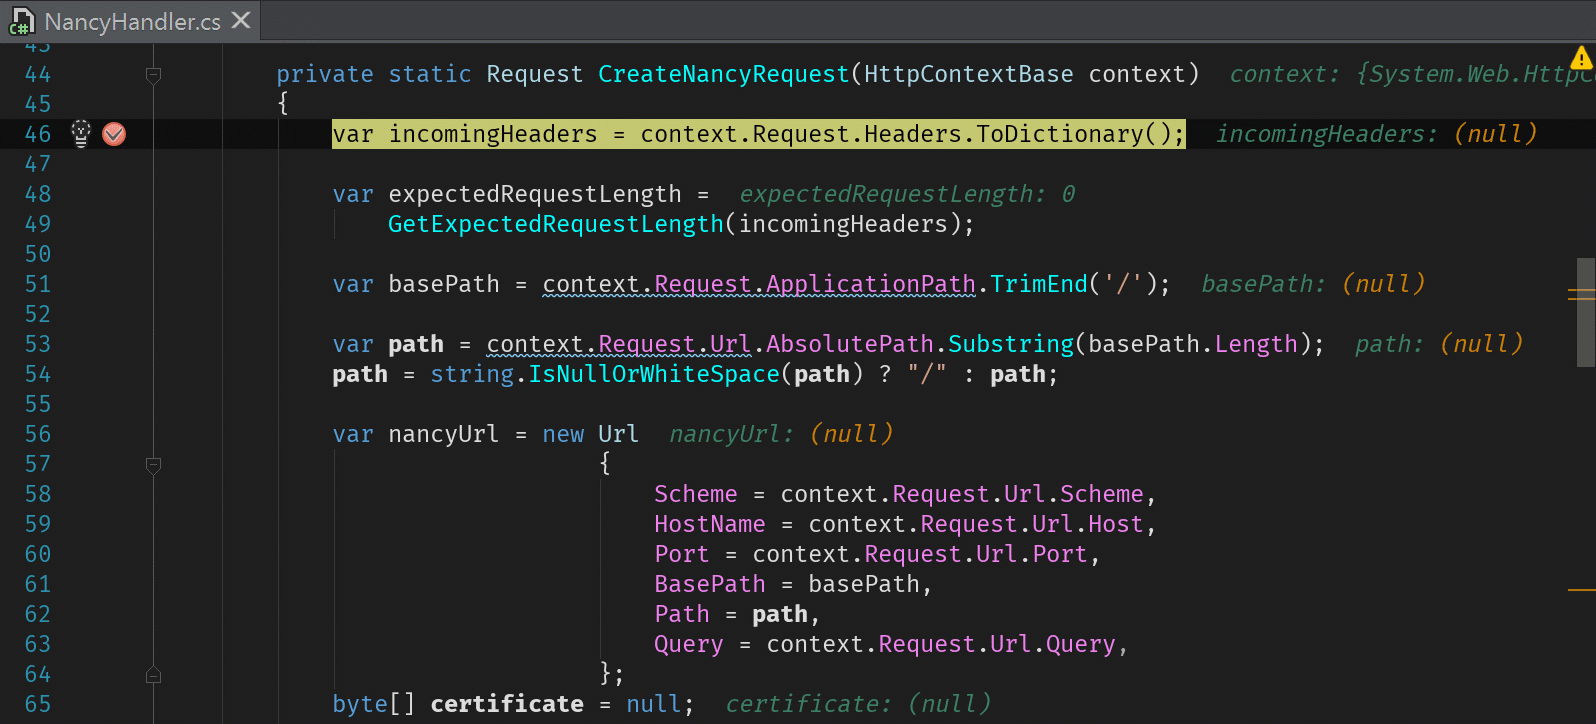
In the previous EAP of Rider, we added displaying of variable values in the editor, right next to the code, and added navigation to code from the variables tab.
Conditional breakpoints were already there, so we can tell the debugger to only break execution when a variable has a certain value, e.g. person.Name == "Maarten". In this new EAP, we added hit count filters. What if we suspect a bug only occurs in the 1.000 iteration of a loop? Step over a thousand times? Hit count filters help in telling the debugger to only break after the breakpoint was hit a number of times. We can specify the filter using Ctrl+Alt+B on a breakpoint.
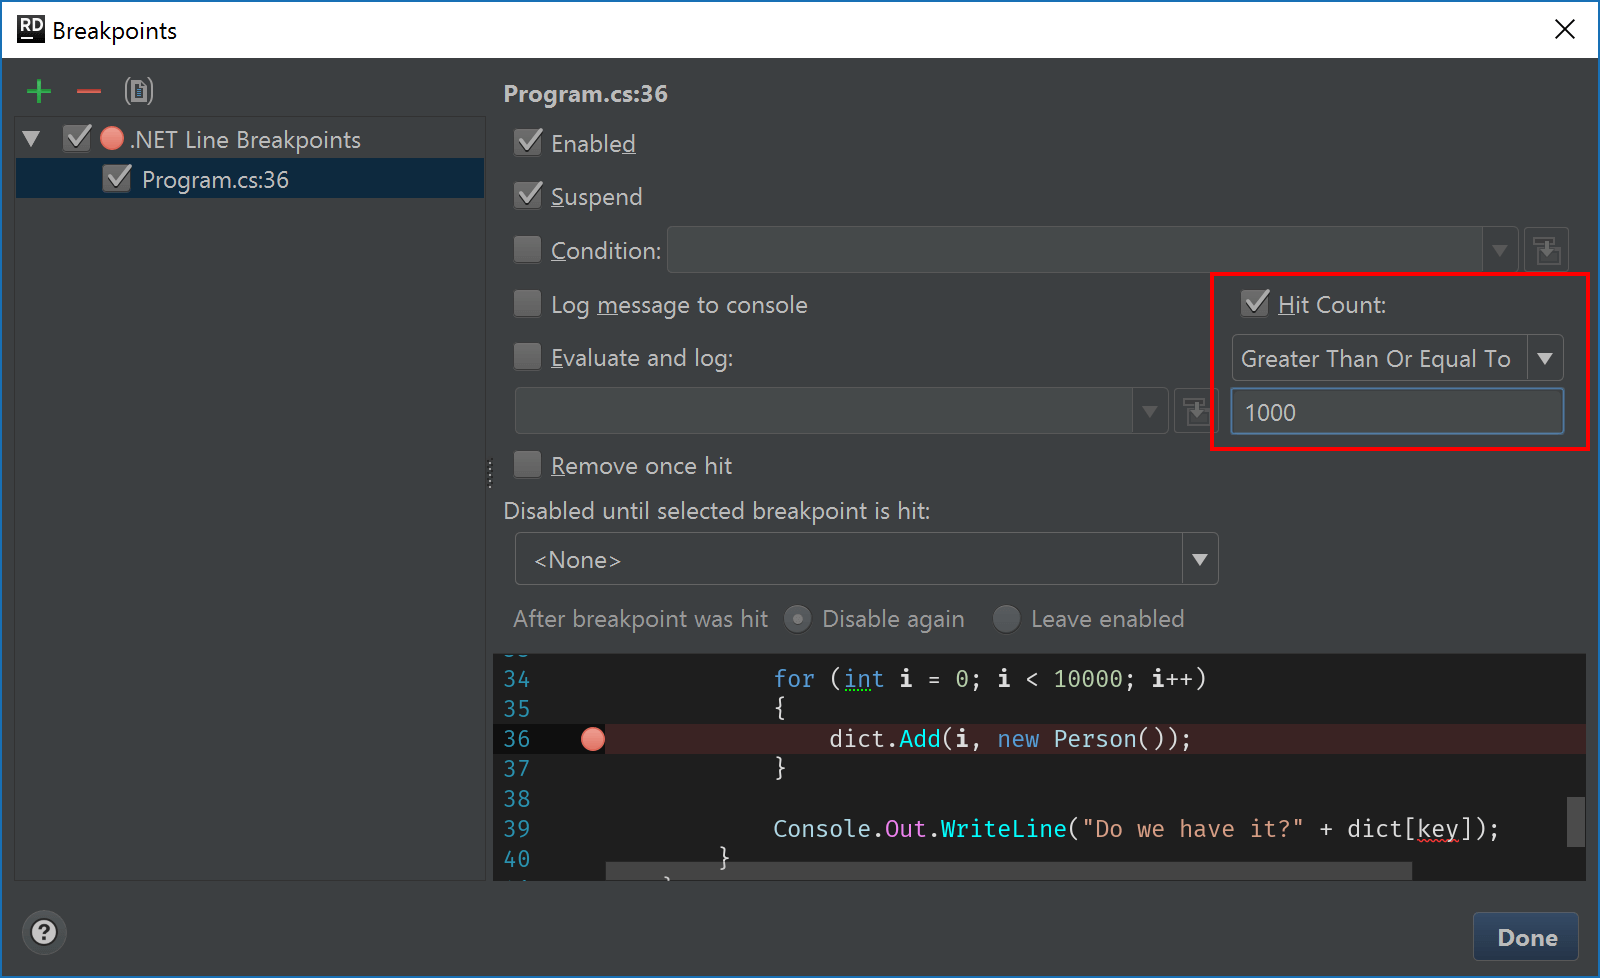
Do explore this dialog some more, as there is some great debugging functionality in there (such as only enabling a breakpoint if another breakpoint was hit).
Code completion
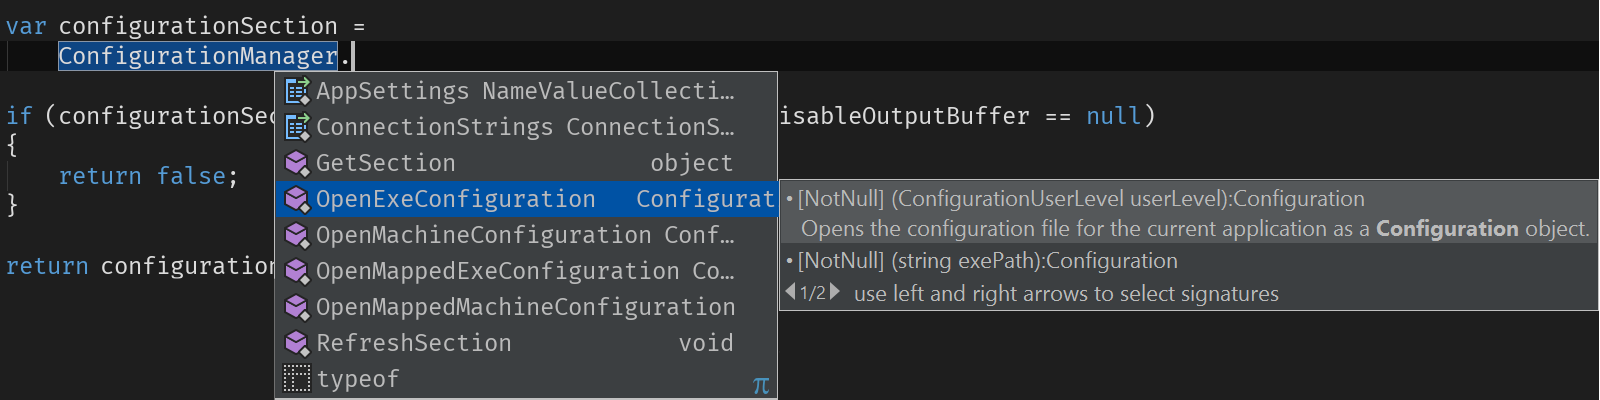
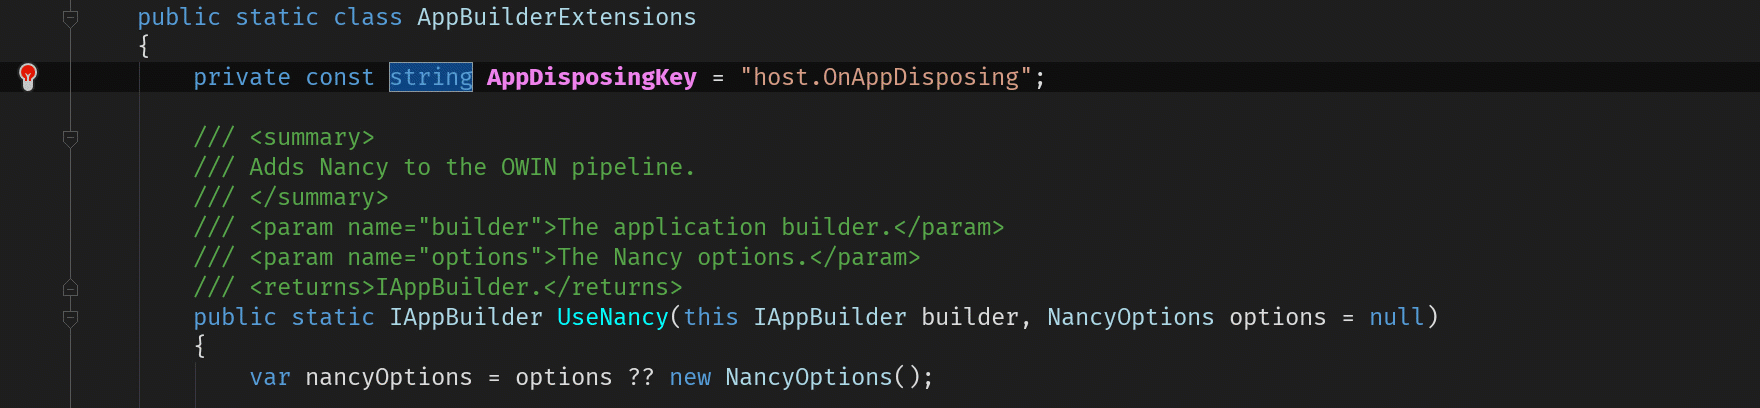
When code completion suggests a method, Rider now displays a summary info popup. It displays the method’s summary and parameter information. If there are multiple overloads, we can switch between them using the left and right arrow keys.
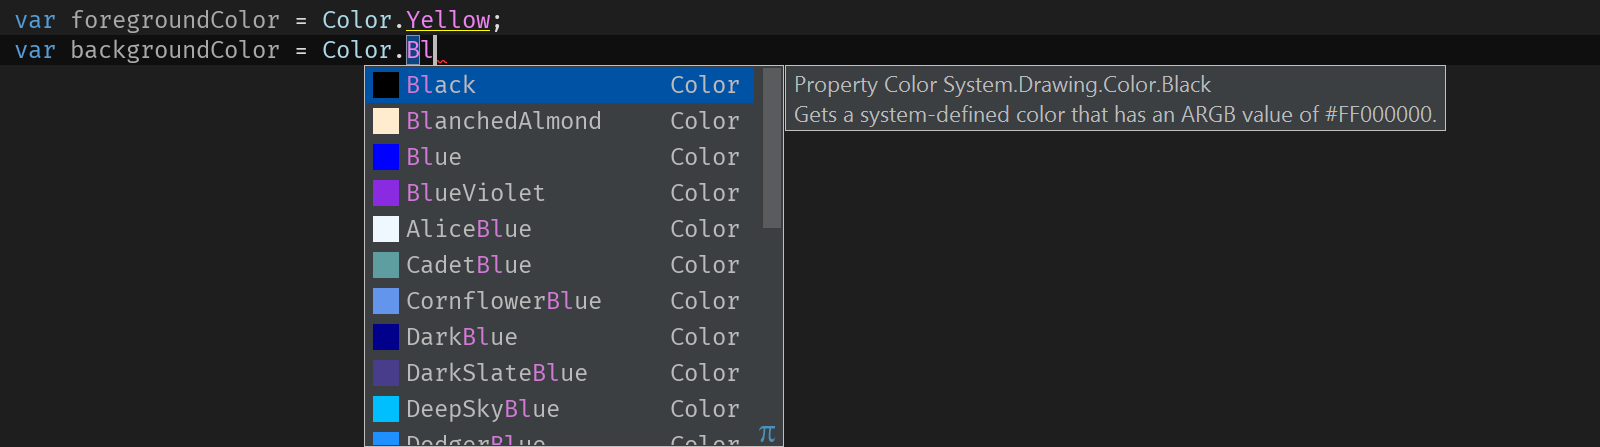
Code completion is now available when working with colors in C#, XAML and CSS. Rider suggests available colors which we can use in our code. Not only that: the editor will also underline the selected color so that when reading code, our brain can parse things more easily using visual cues.
NuGet
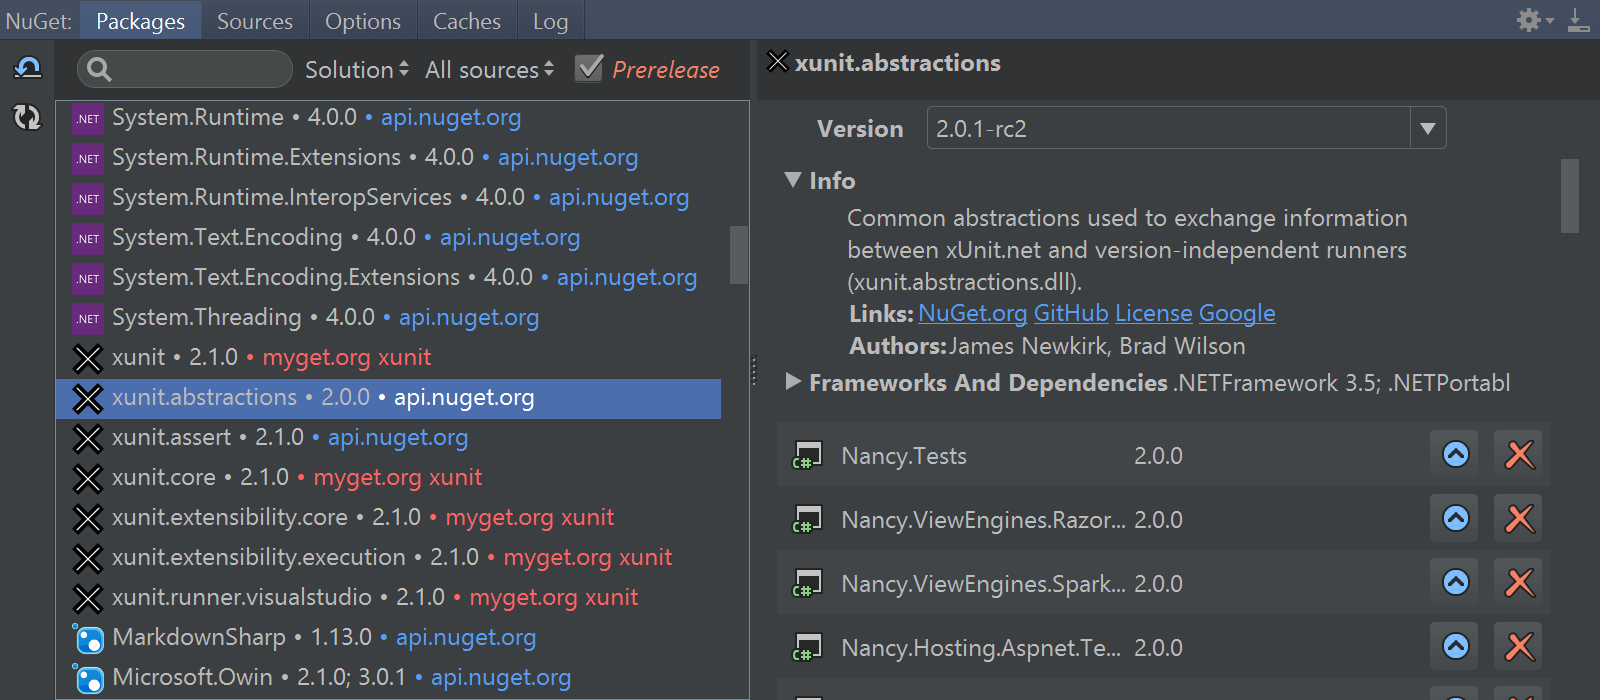
We made quite some changes to the NuGet experience in Rider. Various bugs were fixed, project.json and UWP support was improved. A very visible change is in the user interface: we redesigned the NuGet tool window.
Instead of three panels, there are now only two. On the left-hand side, installed packages and search results are shown. The list also highlights the package source that was used to retrieve the package. On the right-hand side, we display package metadata as well as the projects the package is installed in, with buttons to upgrade, downgrade, install or uninstall the package.
Inspection severity
Code inspections help us adhere to code style settings and general development best practices. We can apply a quick-fix to let Rider help us update the code for us. Severity of these inspections can be configured from the settings, or simply from the editor using Alt+Enter:
Unit testing
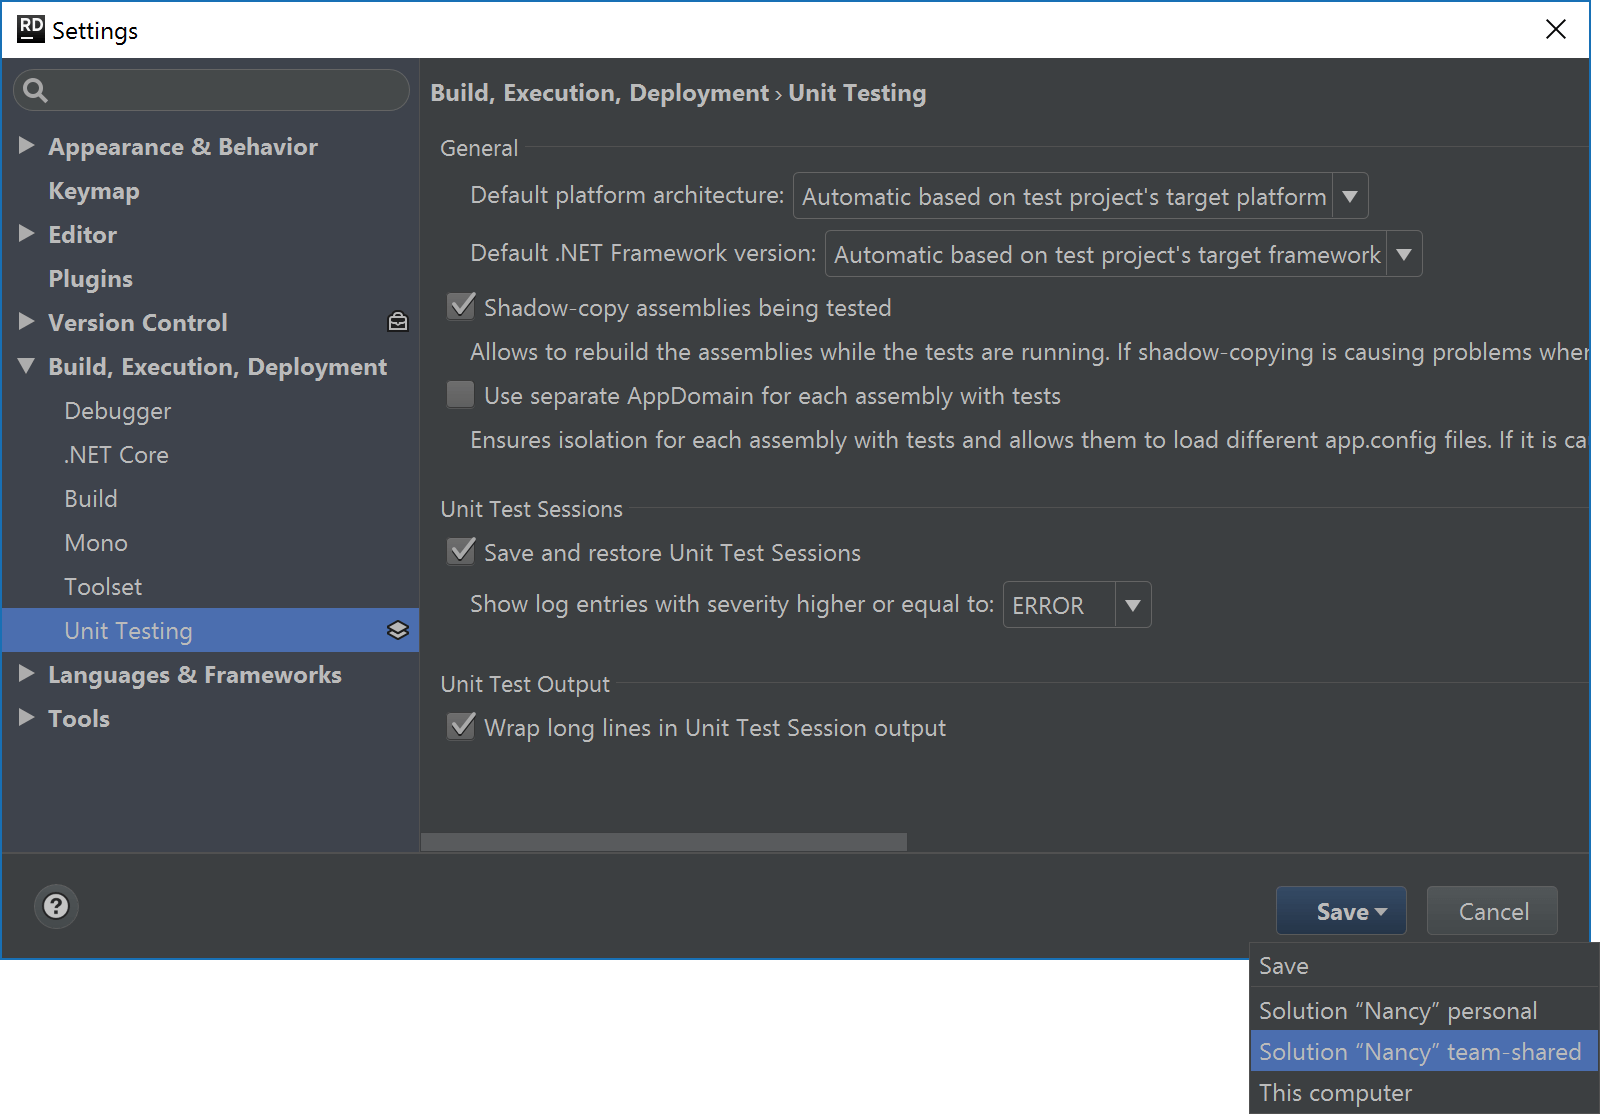
The Rider unit test runner has been there for a while, and we now added a settings page for it. Under Build, Execution, Deployment | Unit Testing, we can configure options like the platform architecture or .NET Framework version to use. Shadow-copy and AppDomain options can be specified as well.
As a bonus, unit testing settings (and various other settings, too), can be stored in ReSharper settings layers and shared with team members working on the same solution, whether in Rider or ReSharper.
Build
The Build tool window can show us the raw build log (as text), or a summary of warnings and errors in a tree view. From the tree, we can Jump to Source (F4) and navigate to the next/previous item (Ctrl+Alt+Up/Down).
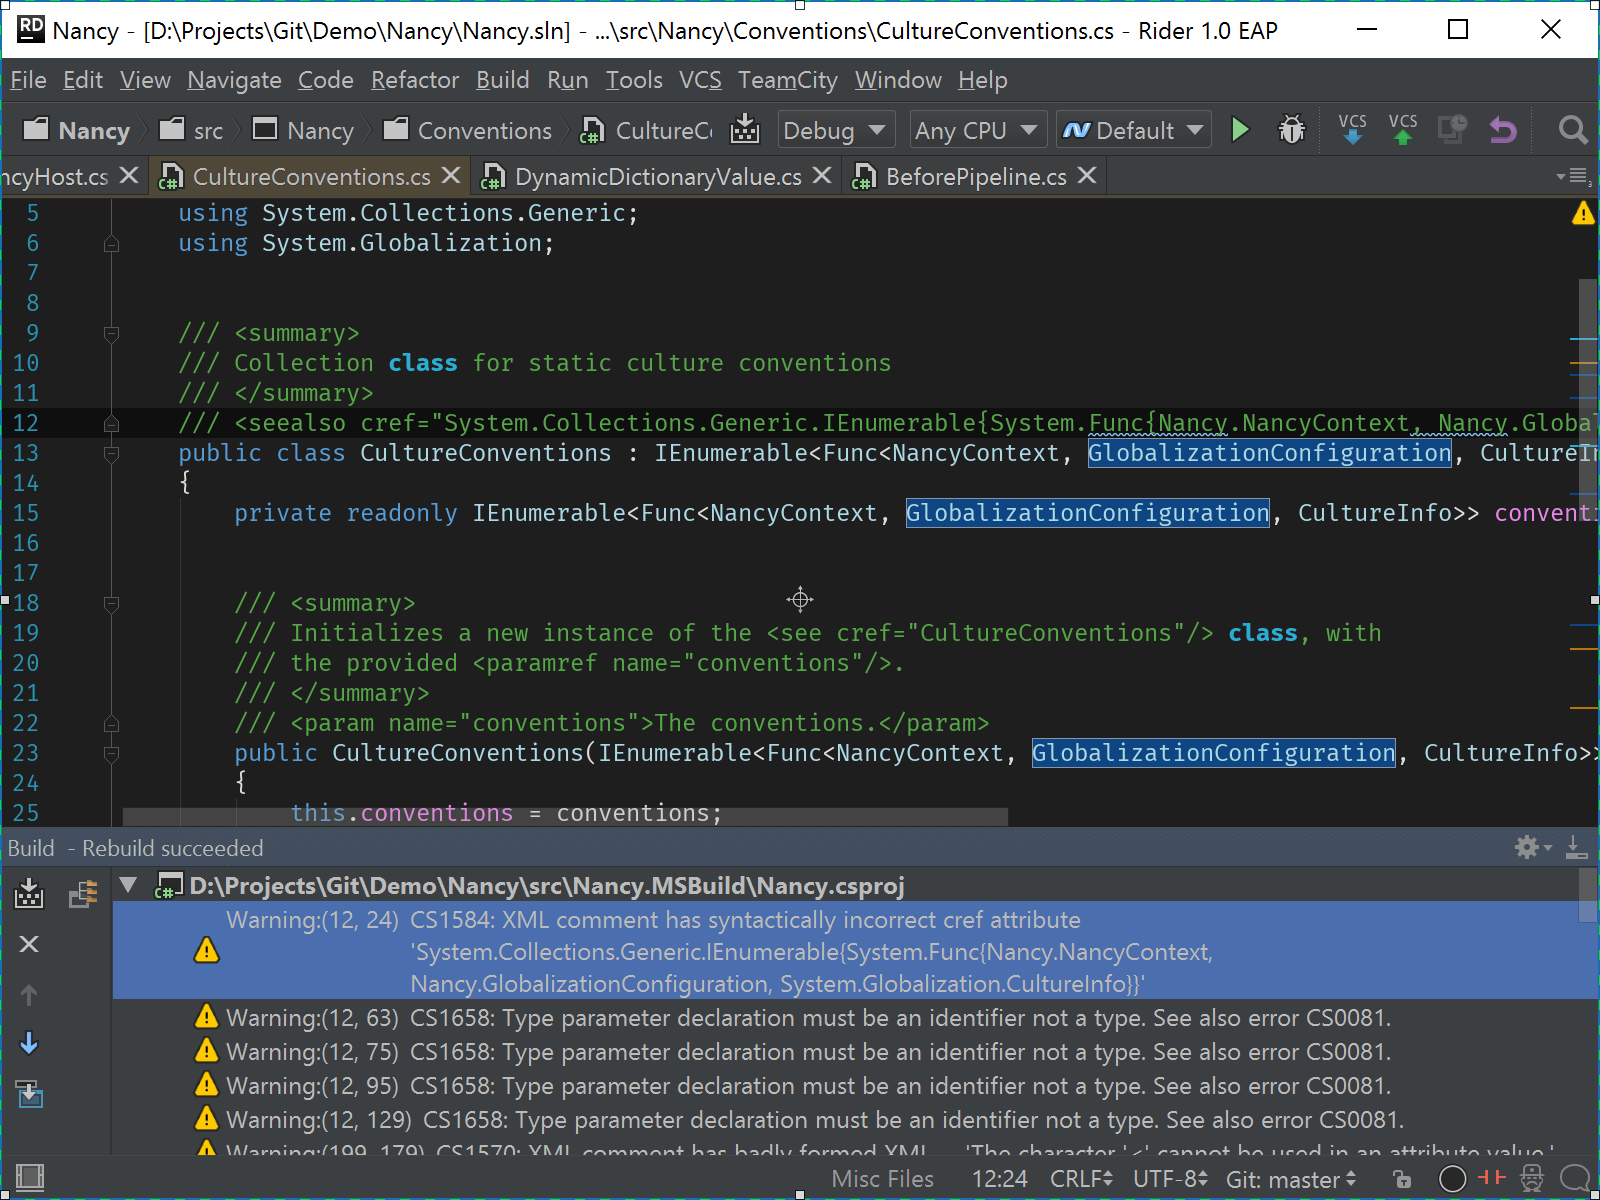
In the Solution Explorer context menu (or under the Build menu), we can build the entire solution or individual projects with MSBuild diagnostics enabled. This will set verbosity to diagnostic, providing us with more details of what is happening during build.
Performance improvements
Significant performance improvements were made in the new Rider EAP. Code completion is much snappier, and there is virtually no latency when typing. We also improved NuGet client performance.
On Linux and Mac OS X, we fixed slow Solution Analysis, which played mostly in ASP.NET projects. Turned out to be an interesting bug! Fixing it did result in better performance and resolved backend crashes and exceptions related to file paths.
Download
We hope that even though we have to suspend CoreCLR debugging for now, you’ll want to test-drive the latest Rider EAP build! Your feedback and comments are appreciated!


