

.NET Tools
Essential productivity kit for .NET and game developers
Using dotPeek to figure out why IIS crashed

Here’s a story on how I once used dotPeek to provide debugger symbols and (decompiled) source code for a crashed application for which we had nothing but the application assemblies available. Namespaces have been altered to protect the innocent.
![]()
Nothing better than a good cup of coffee in the morning! Opening up the issue tracker, “the folks from IT” logged an issue about an application server crashing over night. They automatically captured a crash dump of the IIS worker process and attached it to the issue – this should help in diagnosing the root cause of that crash. One more coffee refill, and then let’s dive in!
Opening a crash dump
The attached crash dump is a .dmp file, which means it could be a full crash dump or a minidump. The difference is in the amount of data contained in the dump: a full crash dump has all sorts of details, including the data that was in memory at the time of the crash. A minidump contains enough information to perform basic debugging operations, such as looking at stack traces, loaded modules and so on. File size is just over 40MB, so it’s definitely not a full crash dump.
Note: not sure how to capture a crash dump? Check automatically capturing crash dumps to have Windows create a crash dump whenever a given application crashes. Another option would be using SysInternals ProcDump – procdump processname -ma -e -x output_file.dmp will capture a dump when the application gives up.
Now where do we start? Exploring the contents of a dump file can be done with various tools, such as WinDbg (part of the Windows SDK) or using Visual Studio. The first offers die-hard functionality, but usually loading the crash dump in Visual Studio will provide us with enough information. Already halfway through our coffee, this is what we can see after opening the w3wp.exe.3192.dmp file:
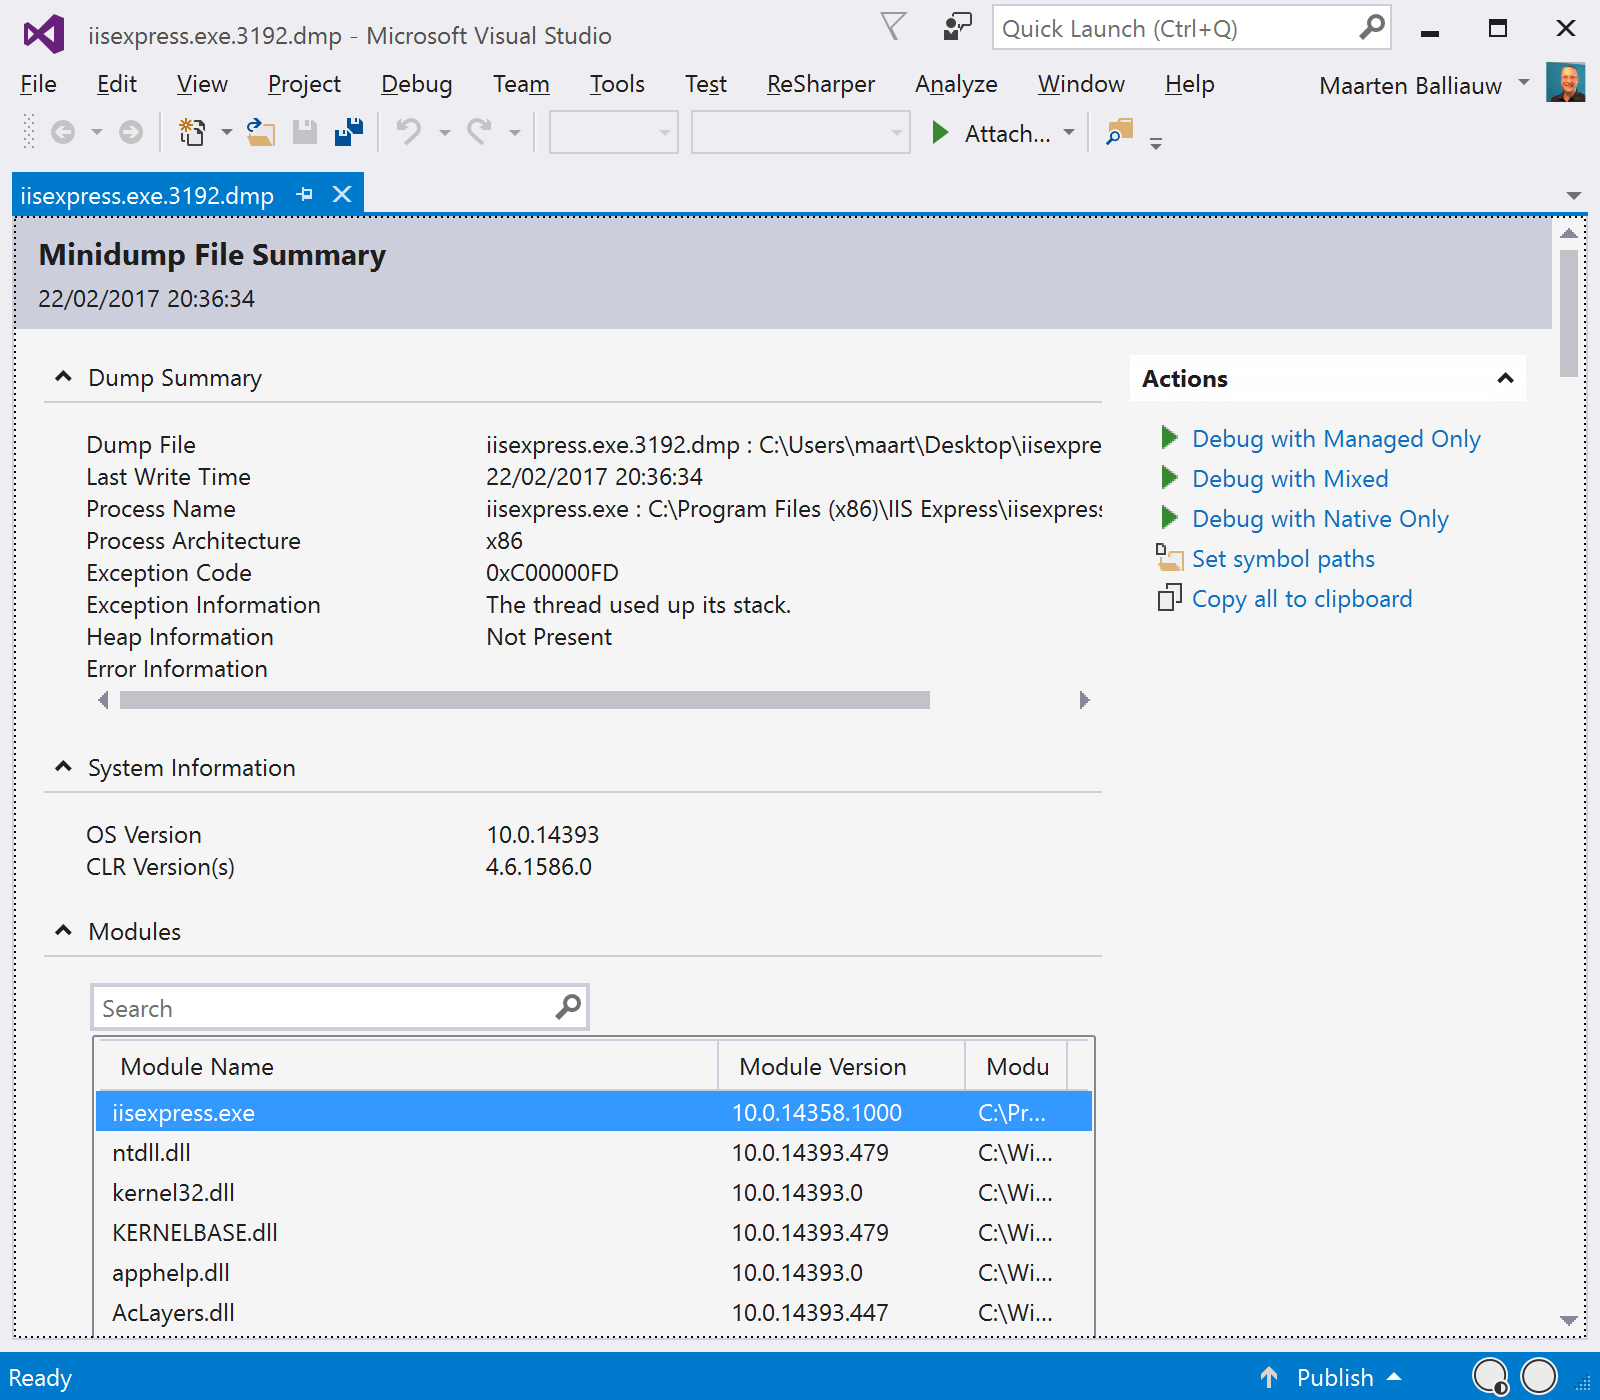
We can already see a number of things from the dump summary: operating system, CLR version, modules that were loaded, but more important: we can see an exception code and exception information. It looks like IIS crashed because of a stack overflow (“The thread used up its stack”). Interesting! Seems we may be able to finish this investigation before we’re out of coffee…
Analyzing the crash dump
In the Actions pane, we can Debug our dump file. What this will do is load all available information from the dump file, and provide that information via the tool windows we’re used to. Visual Studio can do this for managed code (.NET), unmanaged code, or “mixed”. If we Debug with Managed Only, we’ll be able to look at the stack trace at the moment the exception occurred, and we should be able to find out where this exception originated.
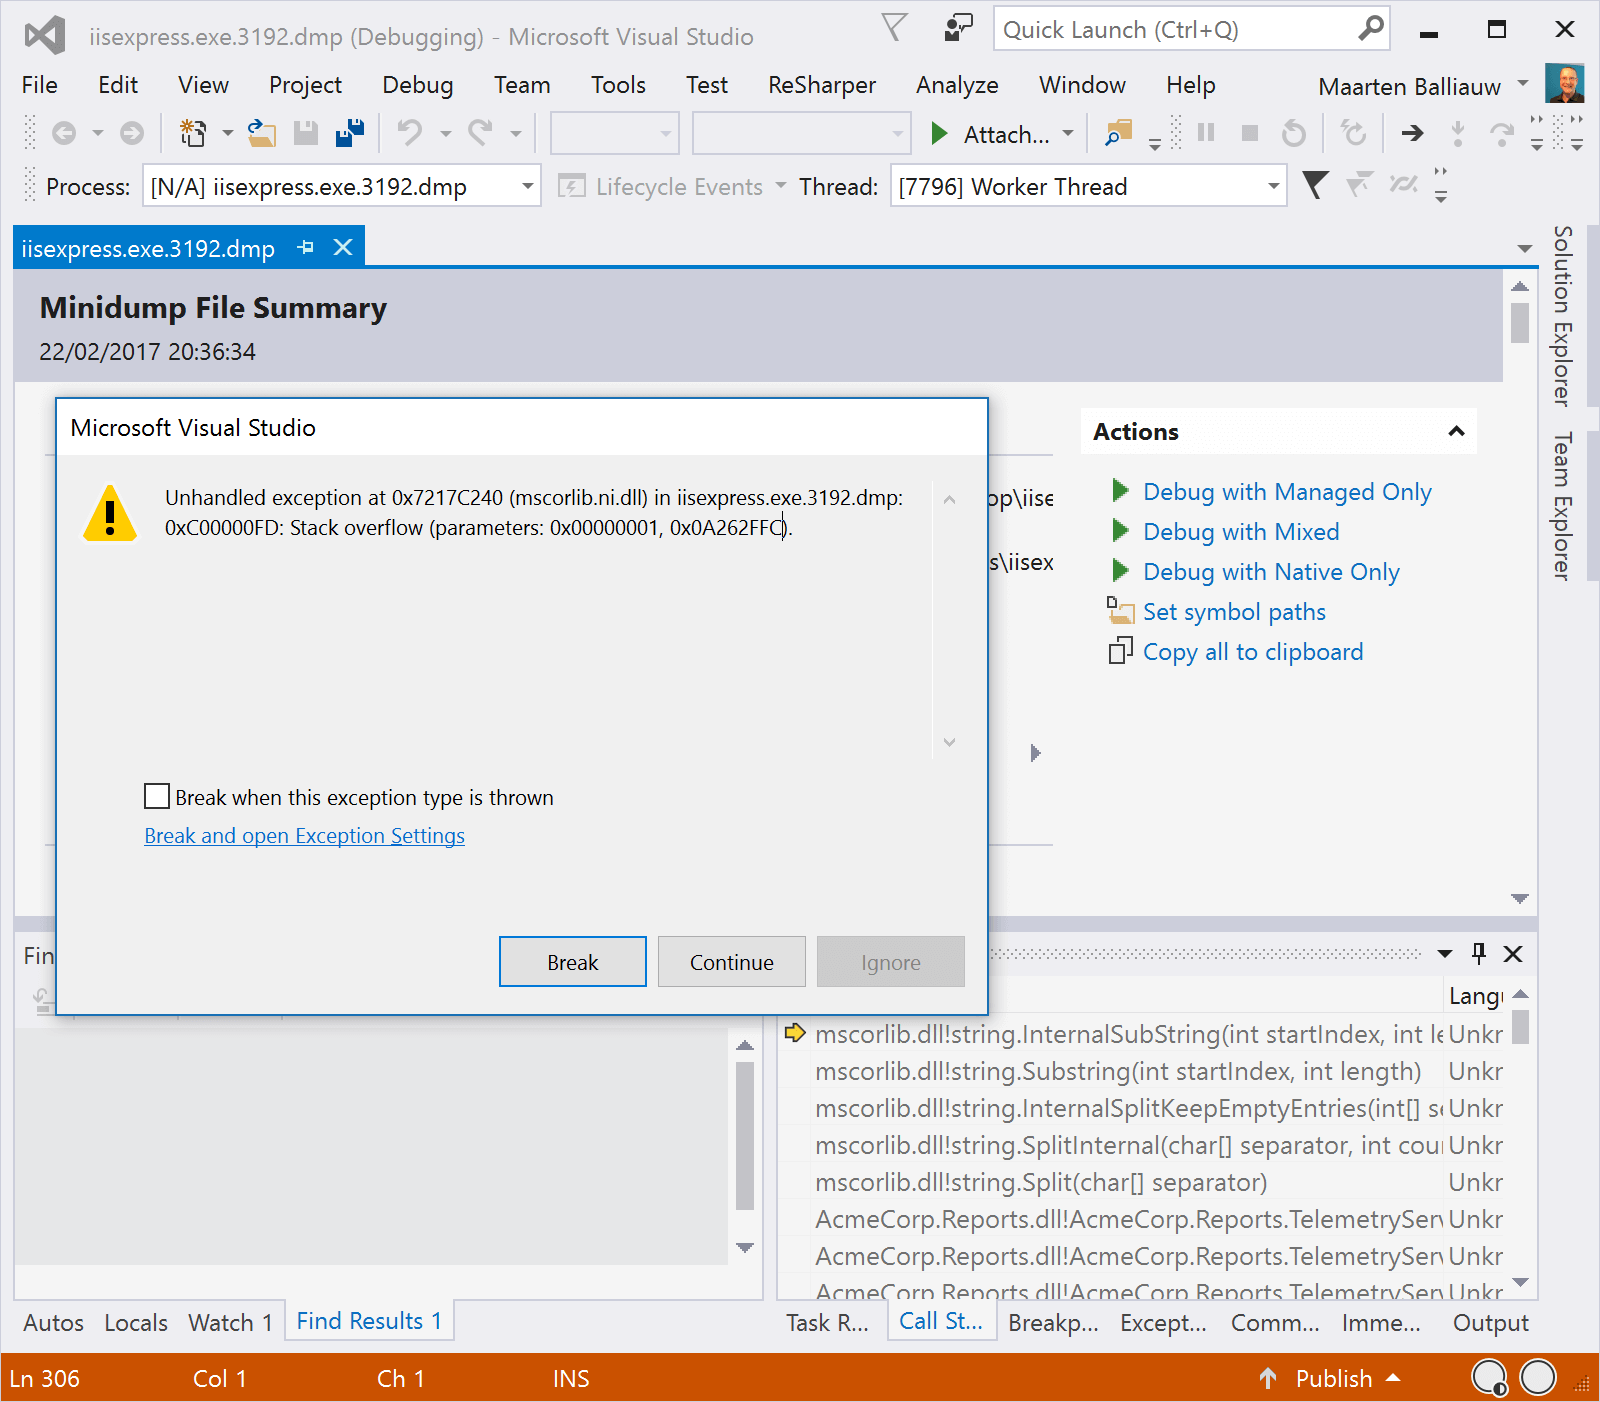
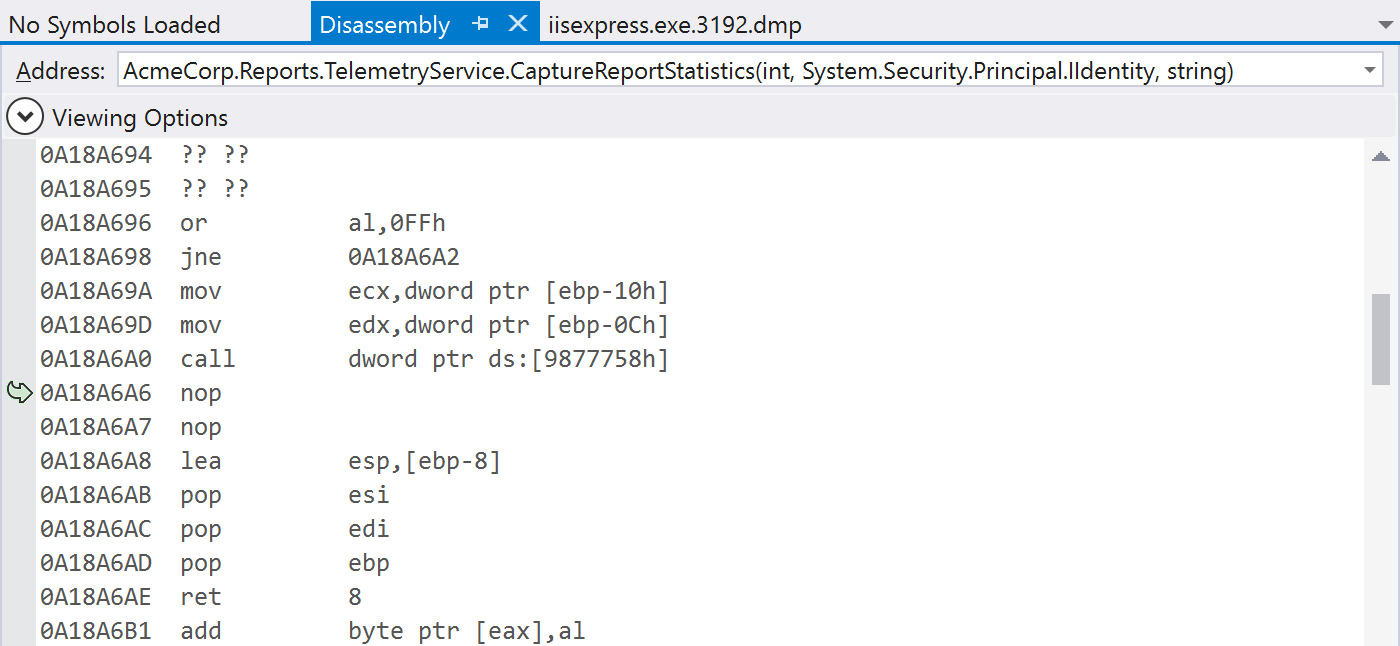
That all sounds great! Let’s click Break and see what we can find. In the Call Stack, we can see there are quite a number of recursive TelemetryService.CaptureReportStatistics calls – which would explain the stack overflow that crashed our server. That method is quite complex, so it would be good if we were able to pinpoint exactly where the recursive call comes from. Unfortunately, Visual Studio tells us “Symbol loading skipped”, which means all we can see in terms of code would be the disassembly.
Confusing, but we can fix that. All we need is debugger symbols, which can map the execution stack back to our source code. In other words: if we fetch the .pdb files for our application from the build server, we should be able to look at the exact line of code where the exception was thrown. Of course the symbols should match the exact build that was deployed at the time of the crash, but we have that information. Except…
No symbols (.pdb) are to be found on the build server! Only the assemblies (.dll) are there – not the symbols! (insert swearing)
That’s sad – we’re now unable to map the crash dump to our code, making it a much harder task to find that bad line of code. Time for a second coffee… Unless – could we use the dotPeek built-in symbol server to solve our quest?
Analyzing the crash dump using dotPeek symbol server
The IT folks provided us with a crash dump, and our build server still has the application assemblies. Let’s see if we can use dotPeek to provide us with debugger symbols and (decompiled) source code to find the root cause of our application crash.
dotPeek is a (free) decompiler which we can use to load an assembly and then look at its source code. A great feature is a built-in symbol server, which serves those decompiled sources so they can be used in WinDbg, Visual Studio or any other debugging tool being used. We can just launch it from the menu or the tool bar, but before doing that let’s look at the options first.
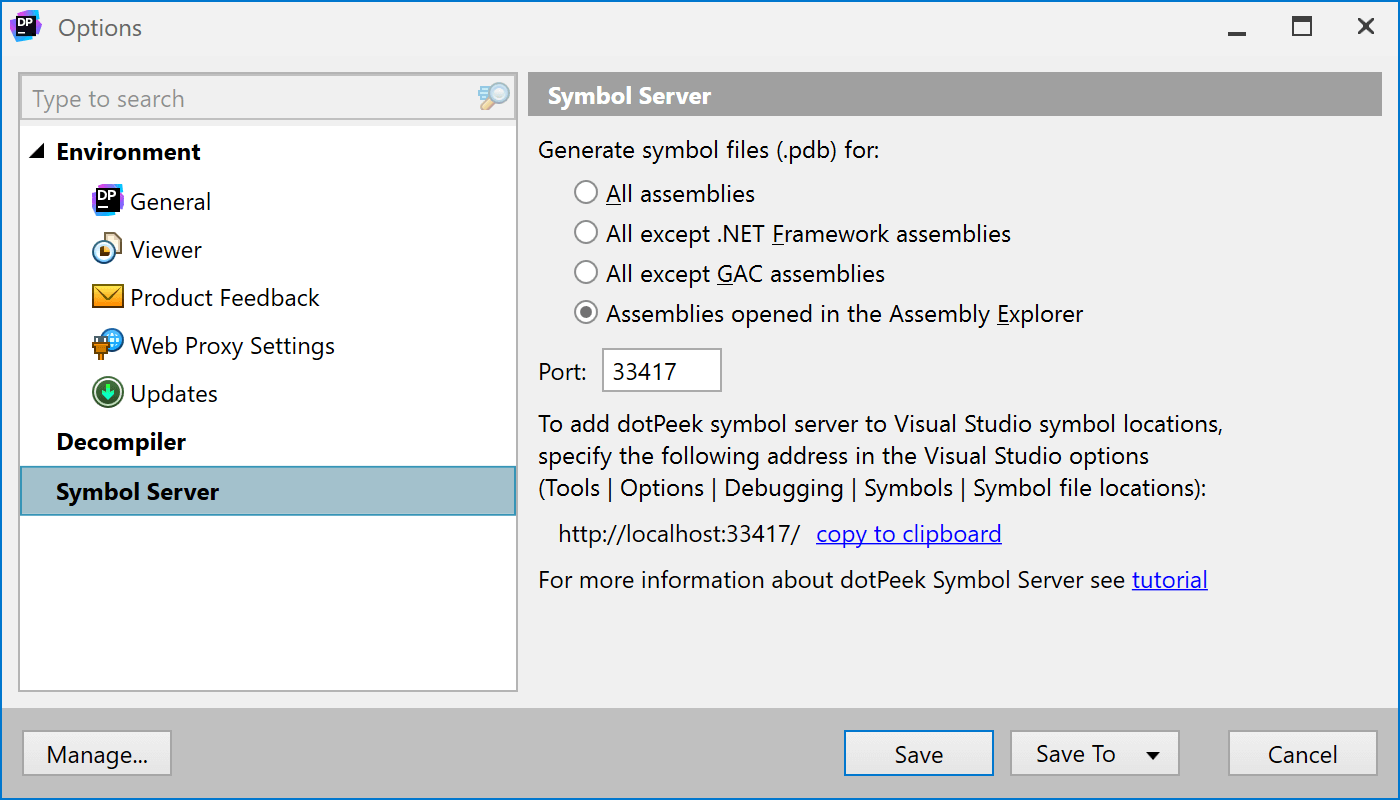
To prevent dotPeek from decompiling all assemblies it can find, let’s limit it to only decompile assemblies we explicitly open in dotPeek. This should speed up symbol loading in Visual Studio afterwards, as we’ll just be decompiling the assemblies we are interested in. Also note the symbol server URL, http://localhost:33417/, as we’ll need that one in a bit.
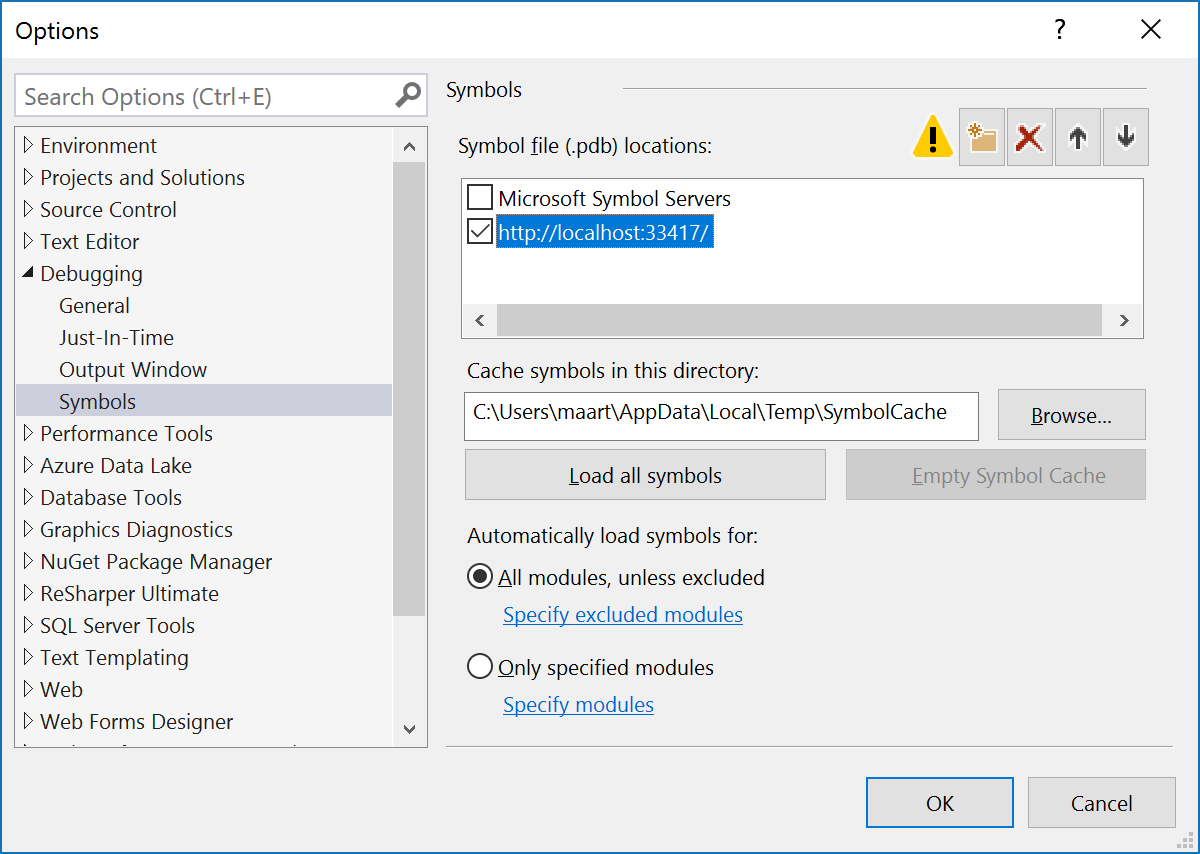
dotPeek’s symbol server is configured and started, all that’s left to do is load our application assembly which was still available on the build server (File | Open…), and then configure the symbol server URL in Visual Studio. We can configure symbol servers and symbols loading from the options, on the Debugging | Symbols page. Depending on the scenario, other options can be configured here as well but for this one, we’re totally fine just providing our dotPeek symbol server URL.
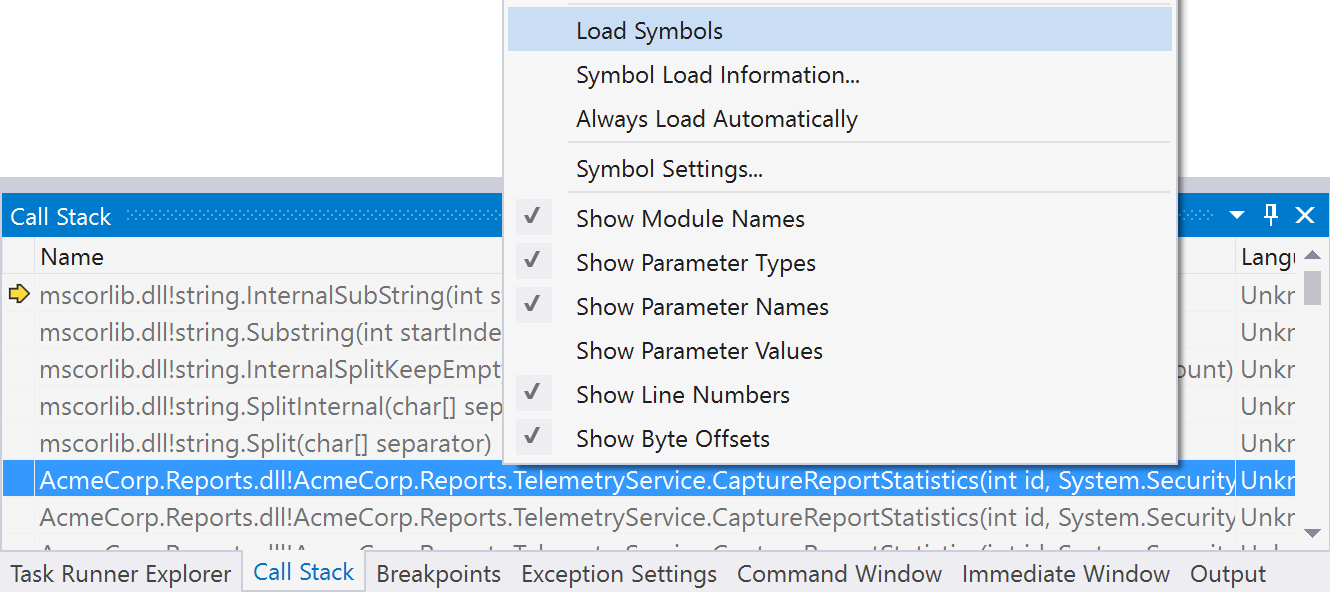
Here comes the magic: we can now load symbols for our application into Visual Studio. From the call stack, we can use the context menu Load symbols on the highest entry that shows our assembly name.
In the dotPeek Project/Pdb Generation Status tool window, we’ll see our assembly being decompiled and PDB’s being generated. And in Visual Studio, we can now double-click our stack frame and see the decompiled code that triggered the stack overflow exception and crashed our application!
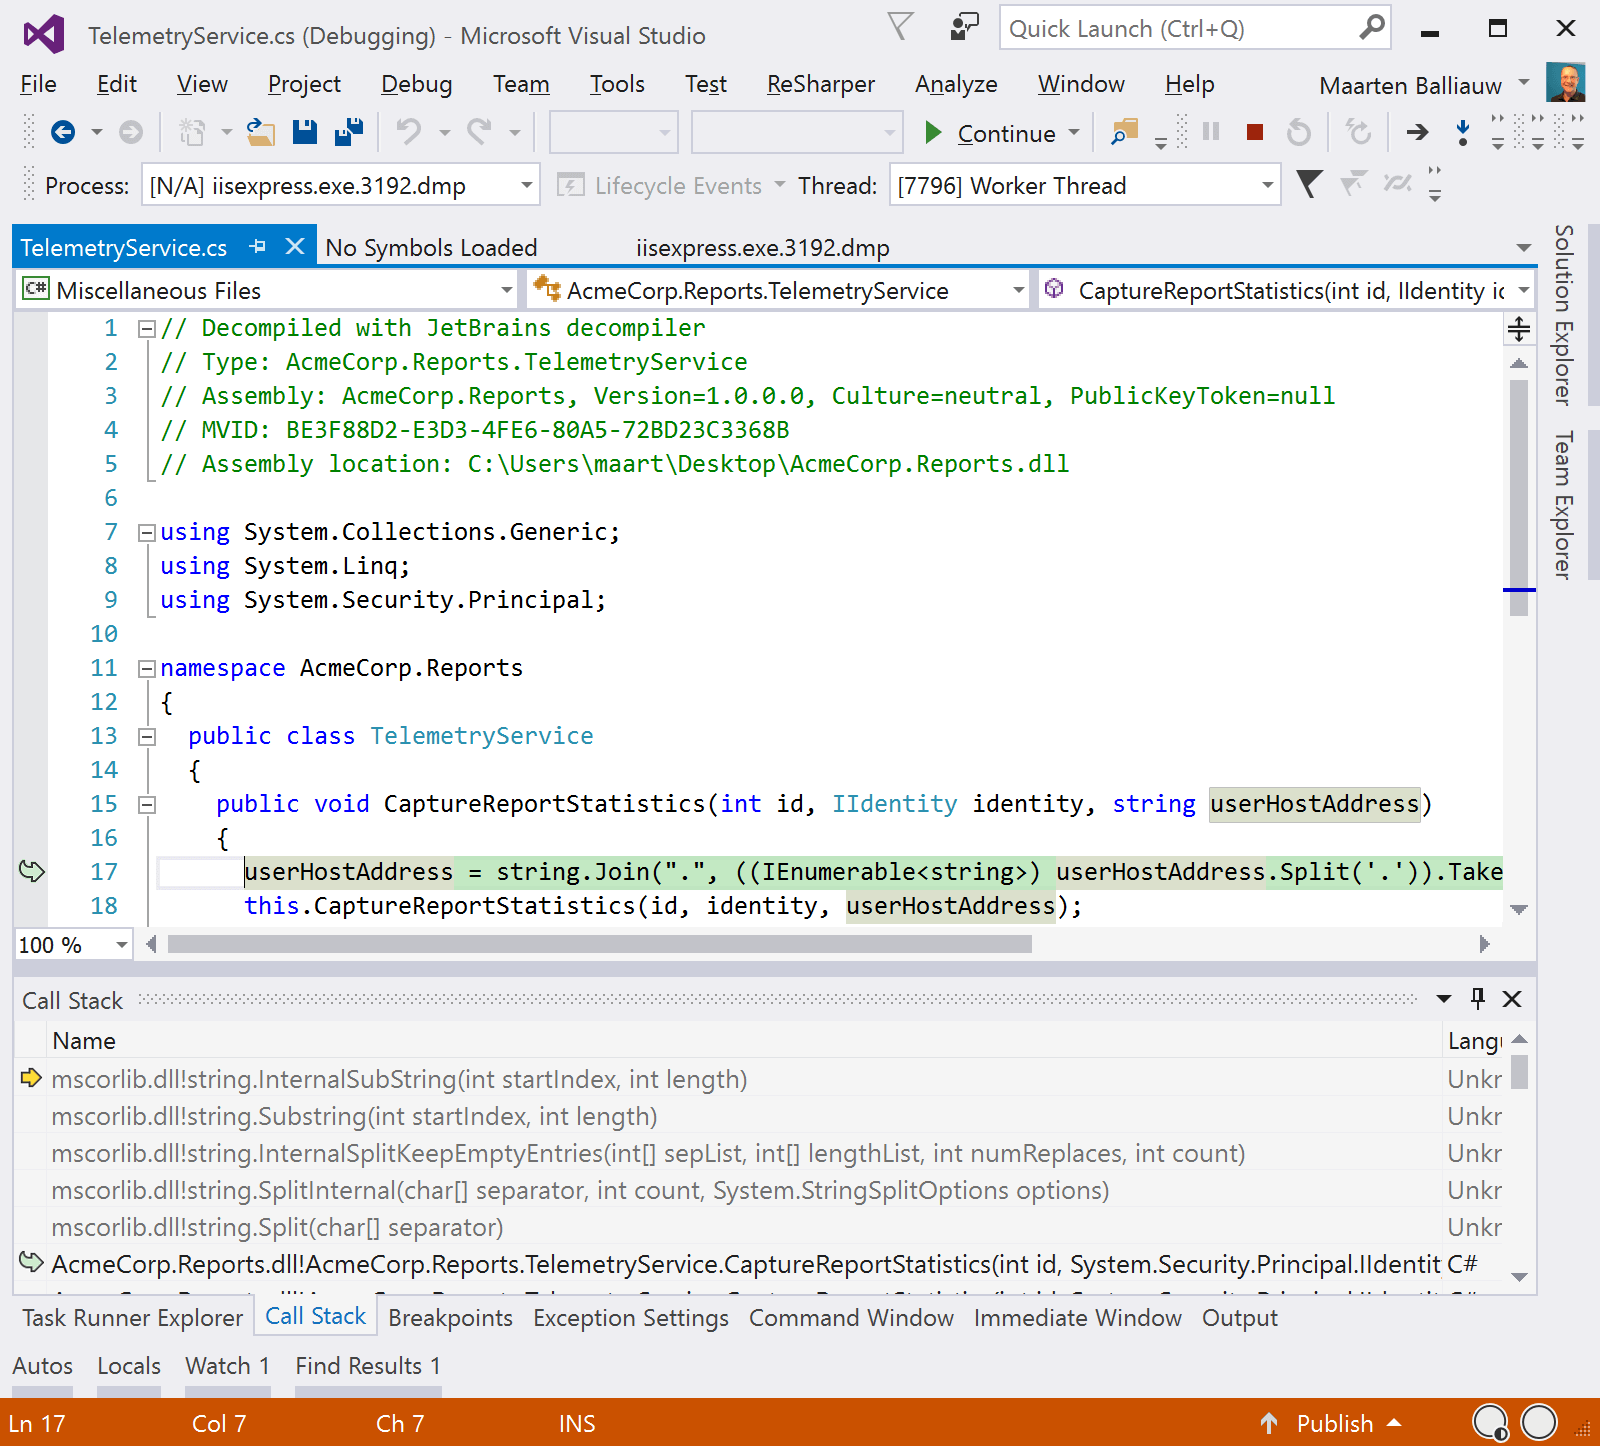
The morning started with a fresh coffee, a crash dump and no debuger symbols, and now we are able to see the exact line of code that crashed our application over night. dotPeek helped us in generating the .pdb file and decompiling source code from just our application’s assembly. Time for another coffee, and then fix the code…
Download dotPeek, our free .NET decompiler, and give it a try! We’d love to hear your feedback, as well as any great stories you may have on working with it.


