.NET Tools
Essential productivity kit for .NET and game developers
Rider EAP 22: Xamarin iOS, unit testing improvements, compound run configurations and more
Good news, everyone! A new Rider EAP build is now available for download!
As always, a fresh EAP means we’ve been fixing a number of bugs, improved existing features and added some new ones. Rider EAP 22 comes with:
- Xamarin Mac and iOS support lets us work on our code and run/debug our projects on emulators and real devices.
- Unit testing improvements with new toolbars, context actions and more.
- Our NuGet client now has a UI to manage NuGet package sources and shows the effective NuGet configuration in use.
- The debugger can now attach to compound configurations to debug two or more projects at the same time.
- Additional settings for code inspections were added.
- There’s now a Favorites tool window showing favorites, bookmarks and breakpoints.
- The productivity guide helps you become a Rider keyboard ninja!
Let’s take a look.
Xamarin Mac and iOS support
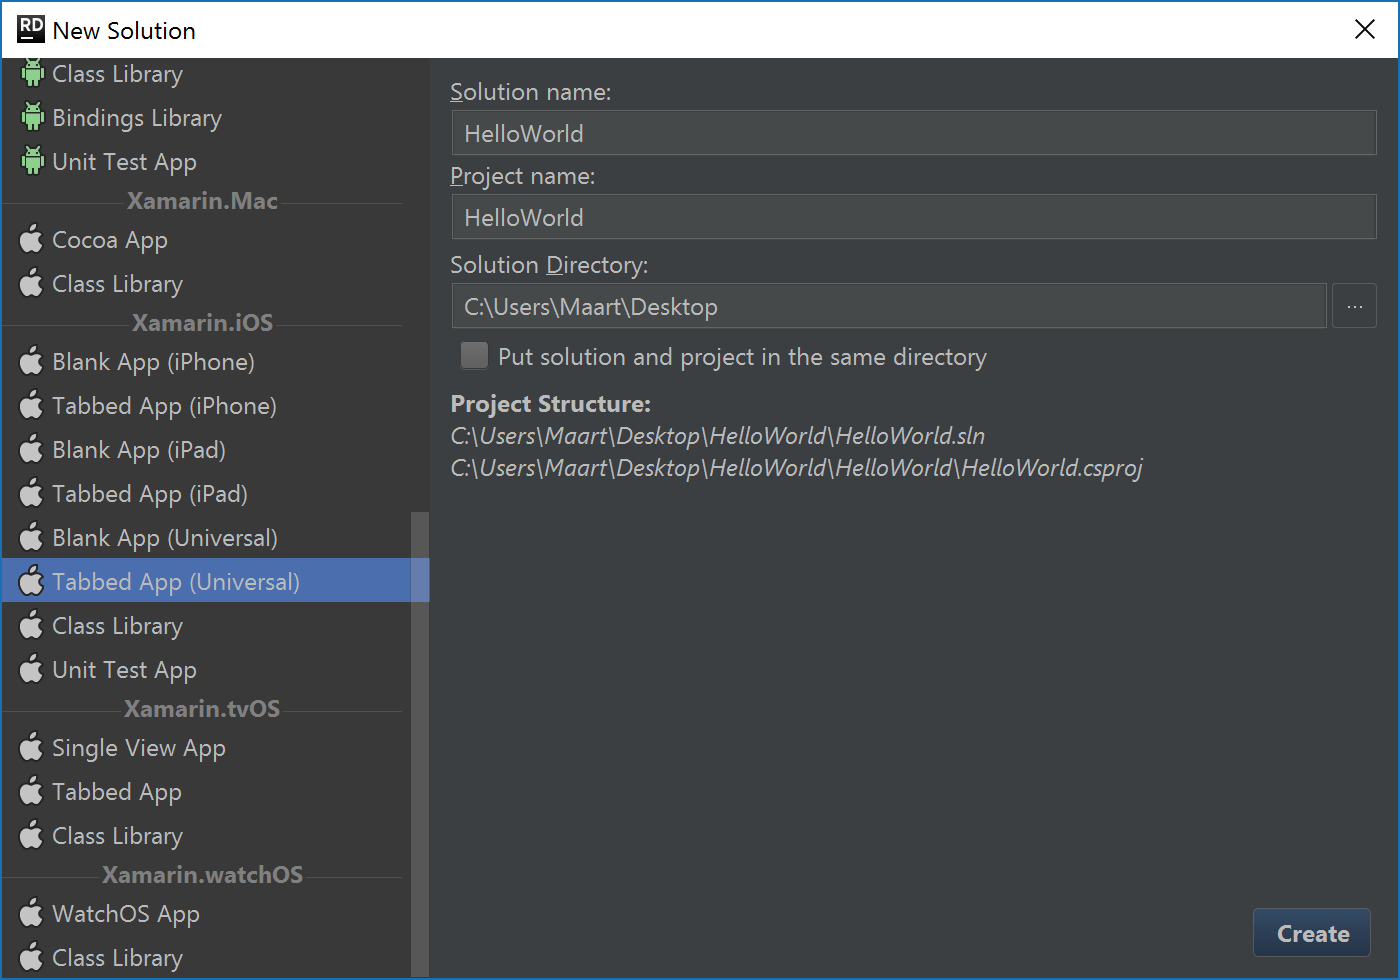
In Rider EAP 20 we added Xamarin Android support for Rider, and now we’re adding Xamarin Mac and iOS support. If the required Xamarin SDK’s are installed, Rider supports creating new and working with existing projects. Project templates are available, too:
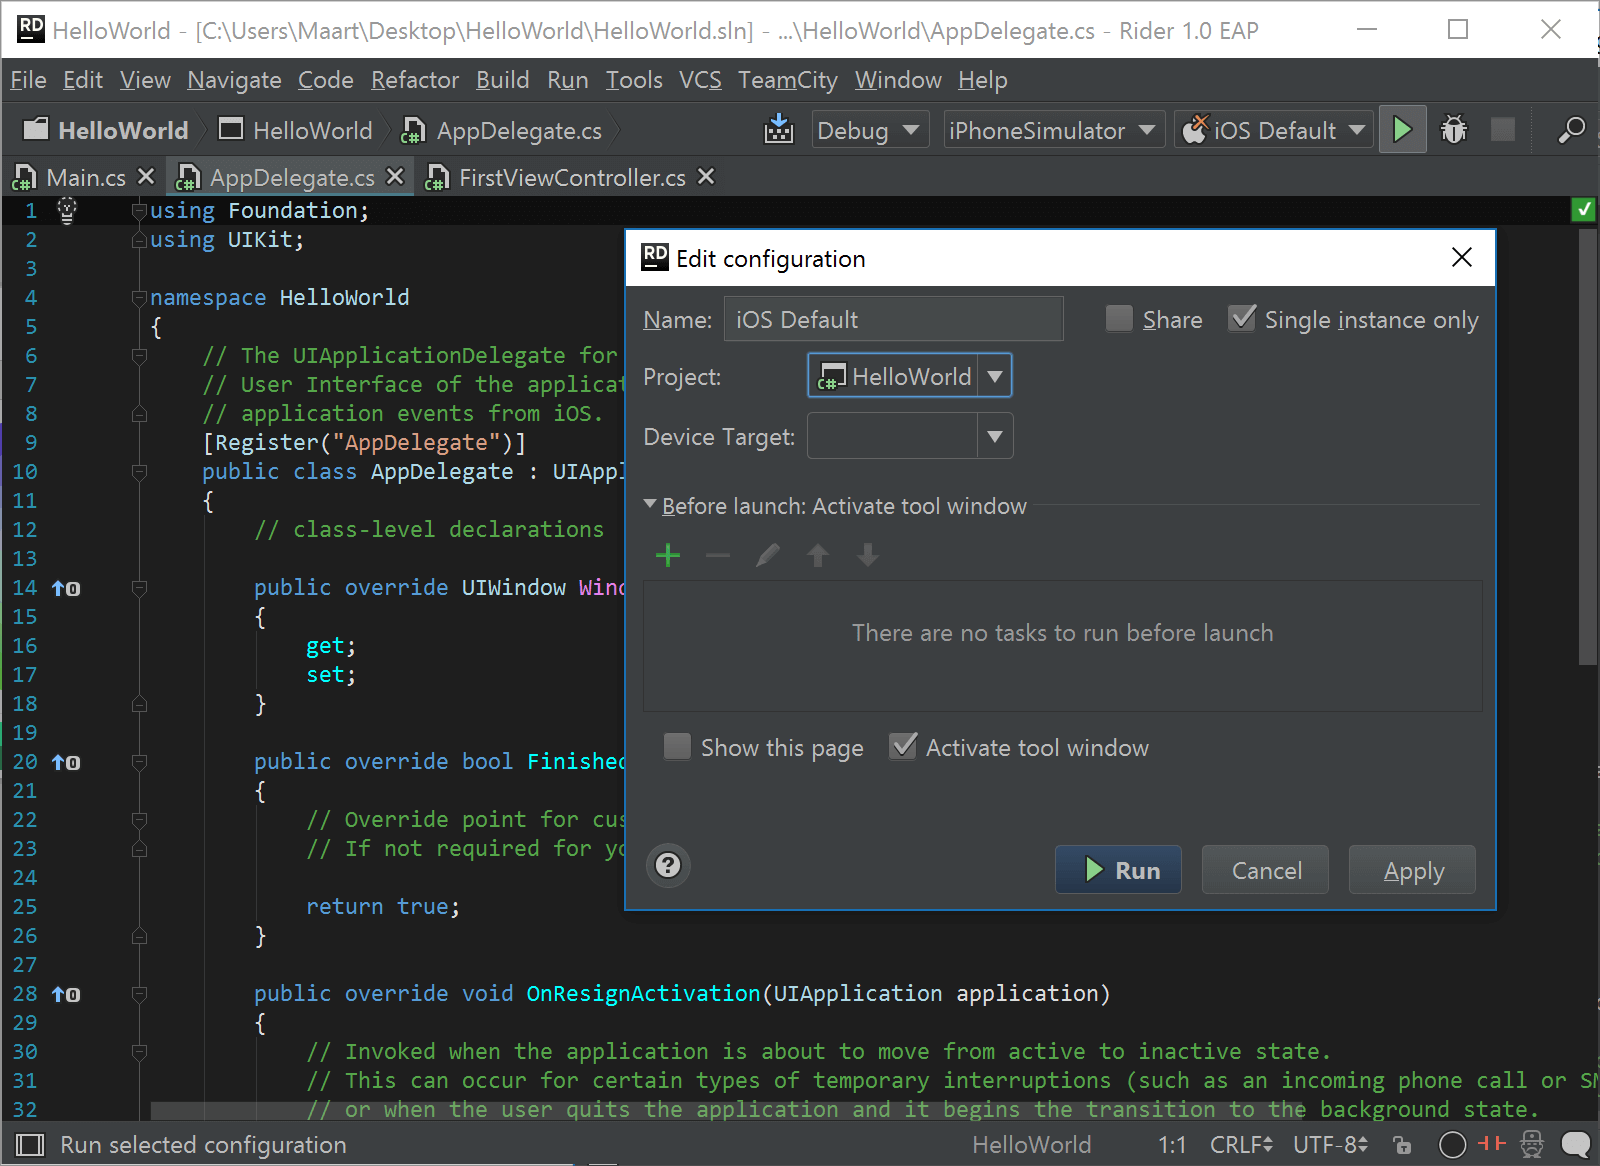
Just as with any other C#, VB.NET or F# project, Rider provides rich code editing features, navigation, code inspections and quick-fixes and refactorings for Xamarin projects. And of course, we can run/debug our code, too. We can run on a real device or connect to an emulator.
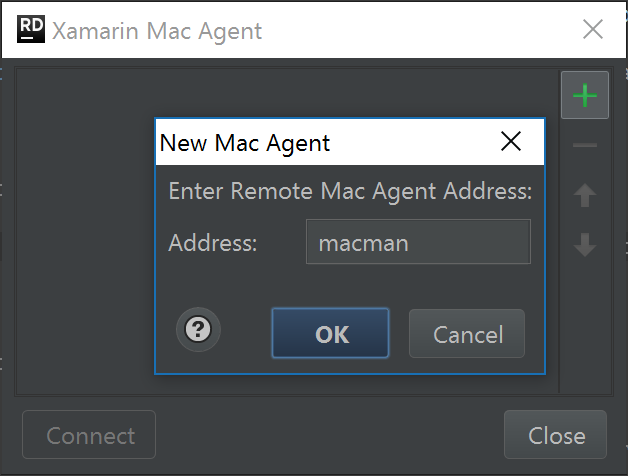
From the Tools | iOS | Xamarin Mac Agent menu, we can configure remote Mac agents on which we can run and debug our code.
Unit testing improvements
Rider comes with a unit test runner that helps us run and debug unit tests written using NUnit, xUnit.net, Jasmine and QUnit.
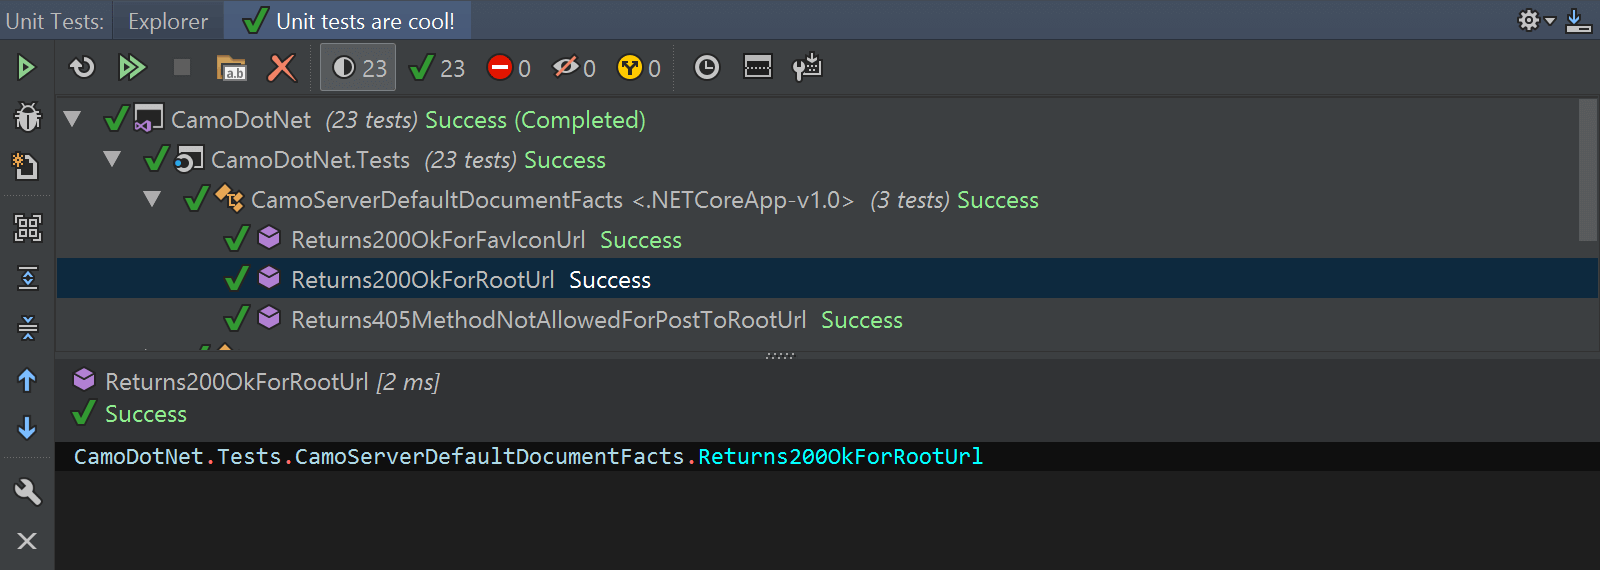
In this latest Rider EAP, we’ve updated the test runner tool window and now support various context actions to run and debug tests and manage test sessions from the editor:
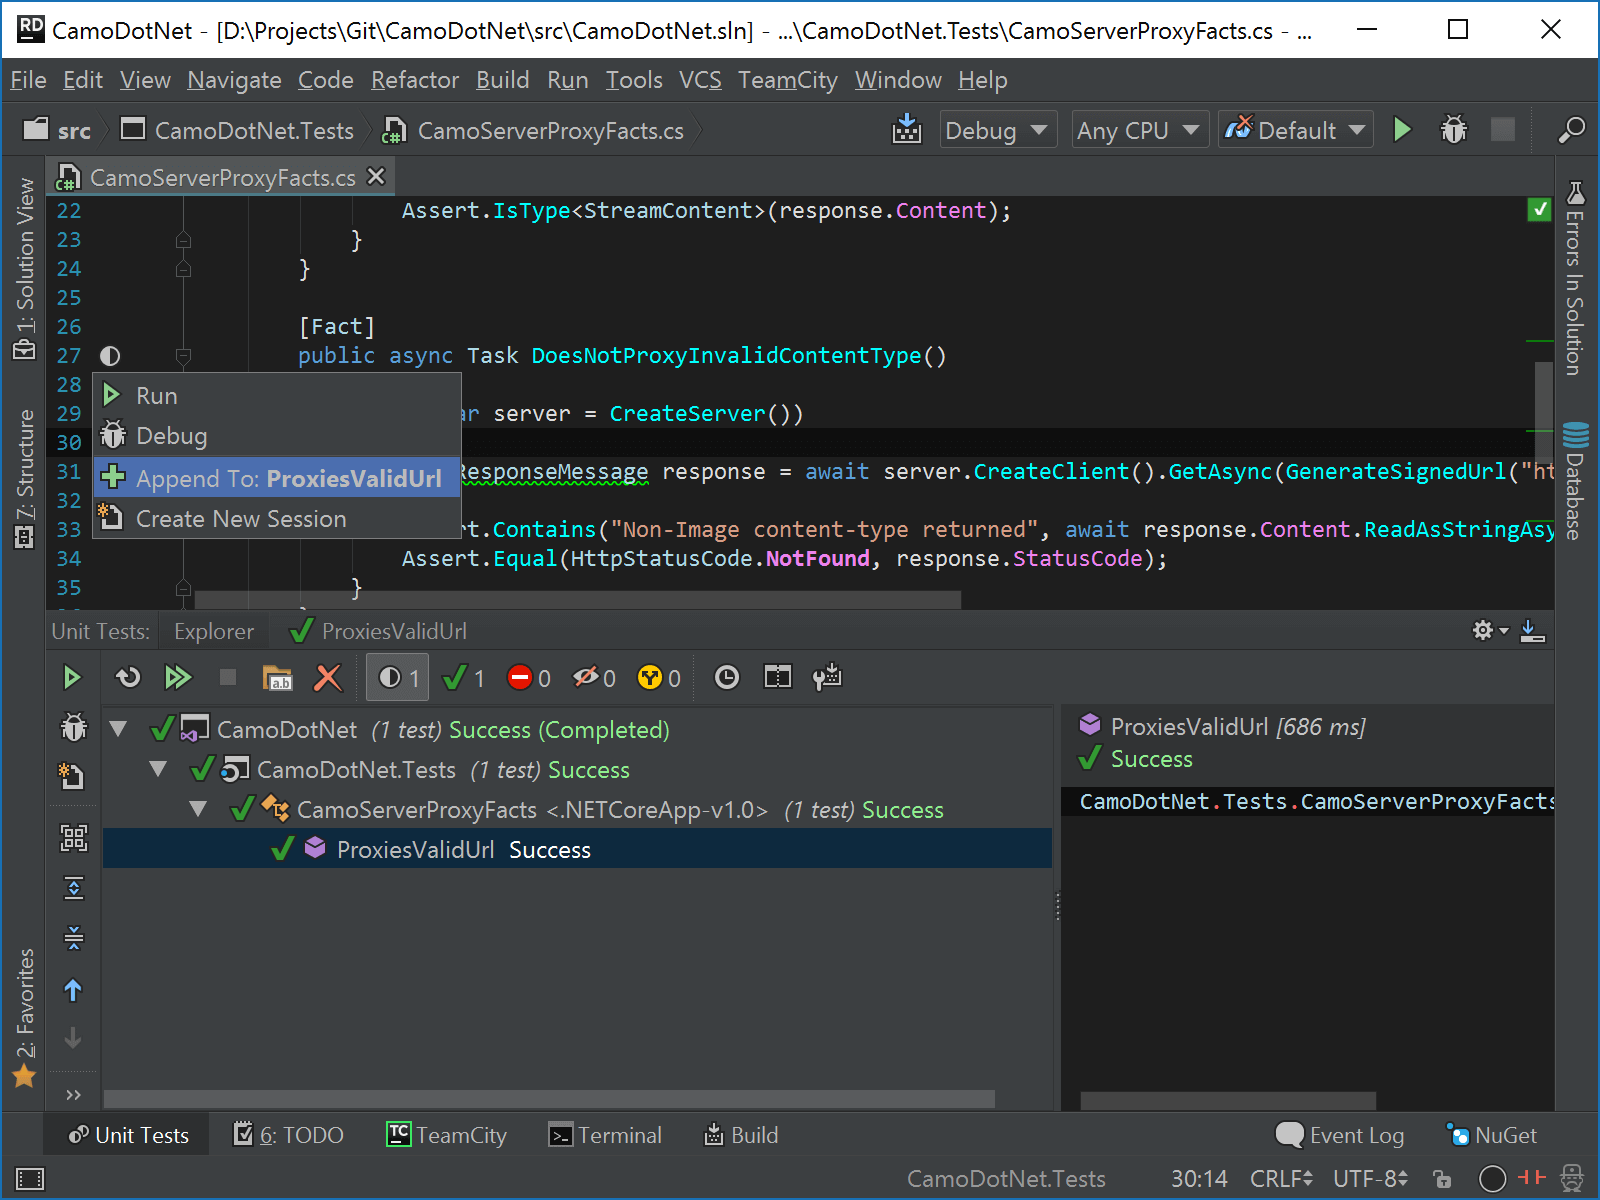
The test results tool window’s toolbars have received a makeover, providing an easy way to filter tests by status. We can show/hide successful tests, failed tests, ignored tests, helping us structure our work. And when tests are inconclusive, Rider will help us figure out why. The test output position can also be changed – either at the right or at the bottom of the tool window.
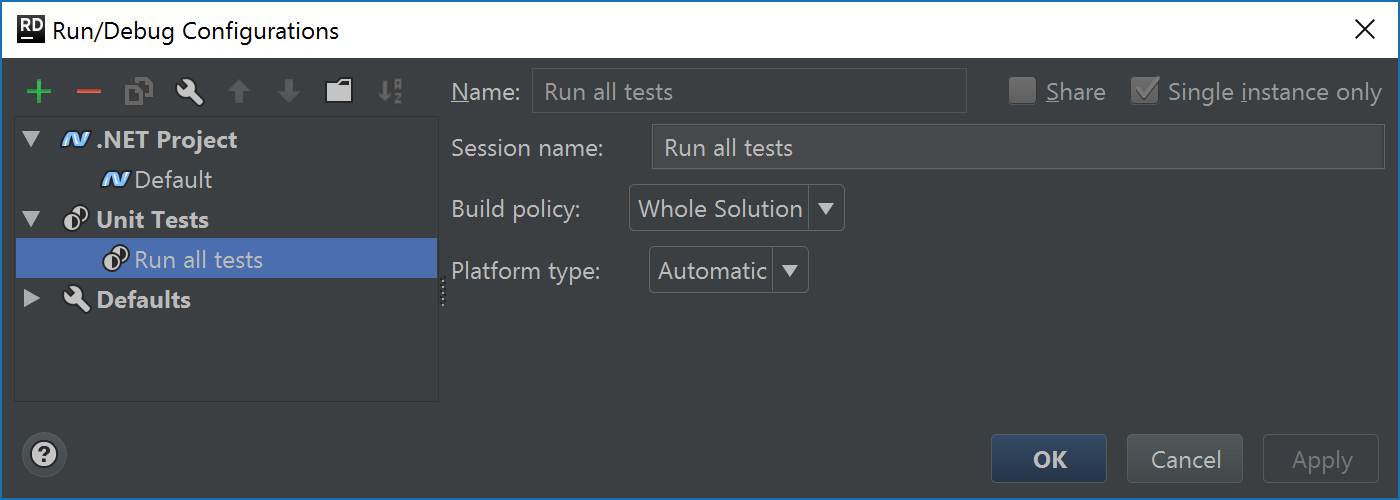
Test sessions are also stored as a run/debug configuration. This makes it easy to re-run a given test session at a later point in time – and gives us some options such as specifying which projects to build before running tests and for which platform.
NuGet
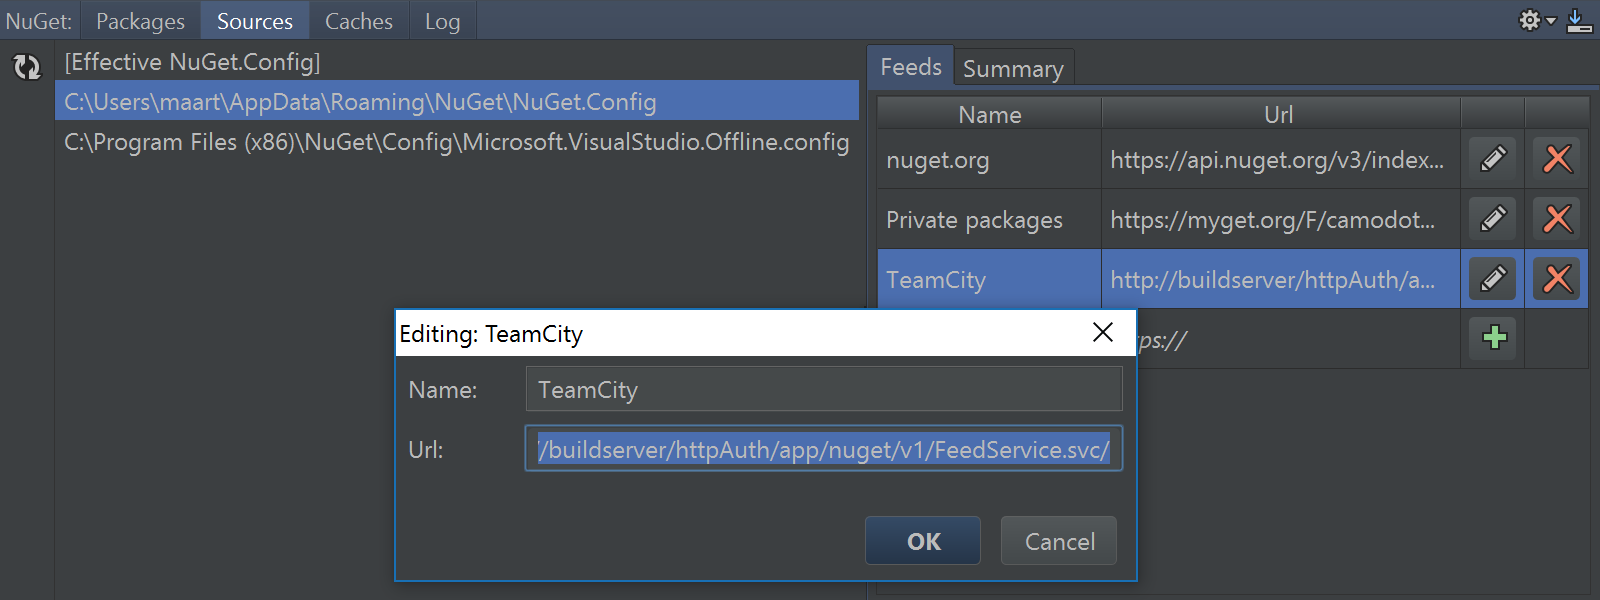
Many development teams are using their private NuGet repository, such as TeamCity’s NuGet server, to distribute packages to a known set of developers. Rider’s built-in NuGet client makes it easy to make use of those repositories: package sources can now be managed via the UI.
From the NuGet tool window, we can add or edit package sources in the NuGet configuration files that are applicable to the current project.
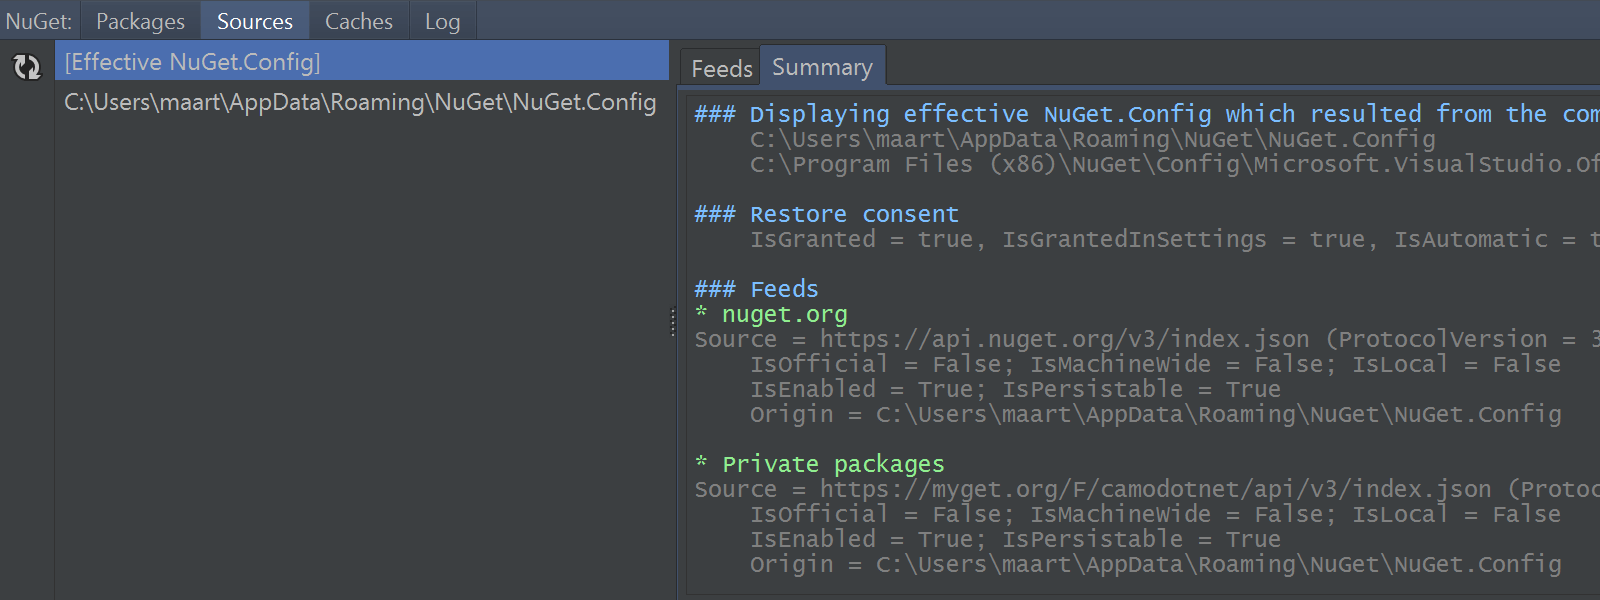
While NuGet comes with a default NuGet configuration on our system, we can also add solution-specific NuGet configuration files to change NuGet’s behavior in some cases. For example we could configure where a solution’s NuGet packages should be (re)stored locally. When multiple NuGet configuration files apply to the project, Rider shows us the effective NuGet.config so we can easily see which package sources and other settings apply, either as a list or via a text-based summary:
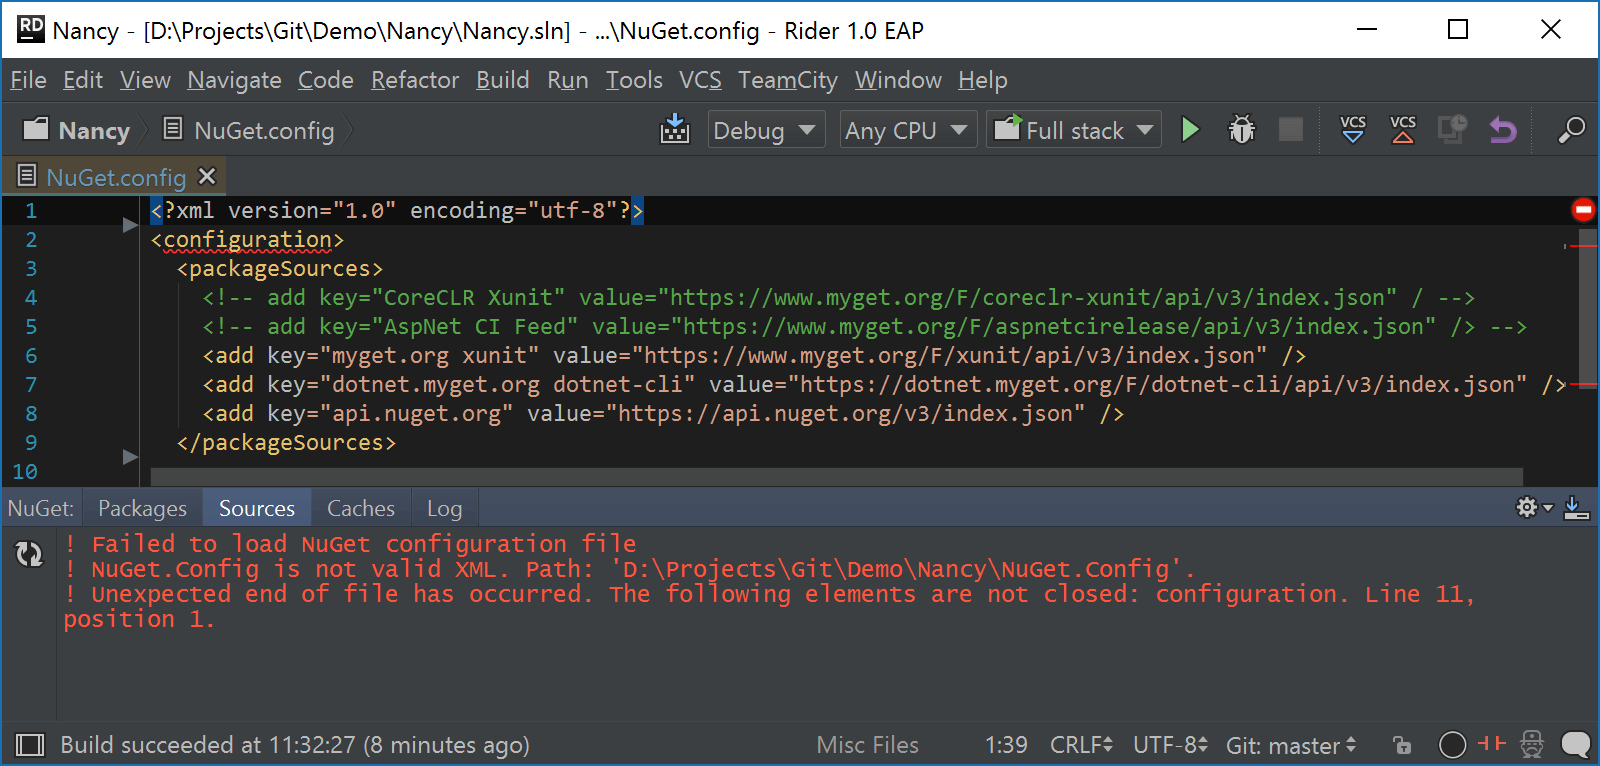
Of course we can still edit NuGet.config files manually. And when we make a mistake, Rider won’t just crash on us like other IDE’s might do. Instead, it will diagnose the issue and tell us what is wrong:
Debugging for compound run/debug configurations
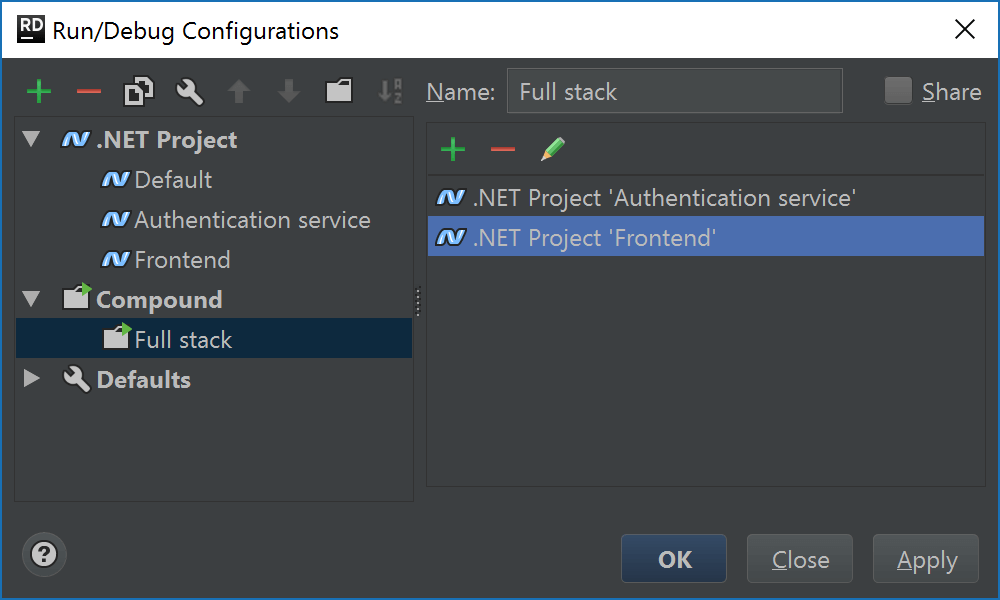
Many times, applications we are building are not just one project. An example could be a front-end application that talks to a back-end REST API. In order to run this type of application on a development machine, Rider has always supported Compound run configurations – a type of run configuration that launches two (or more) other run configurations:
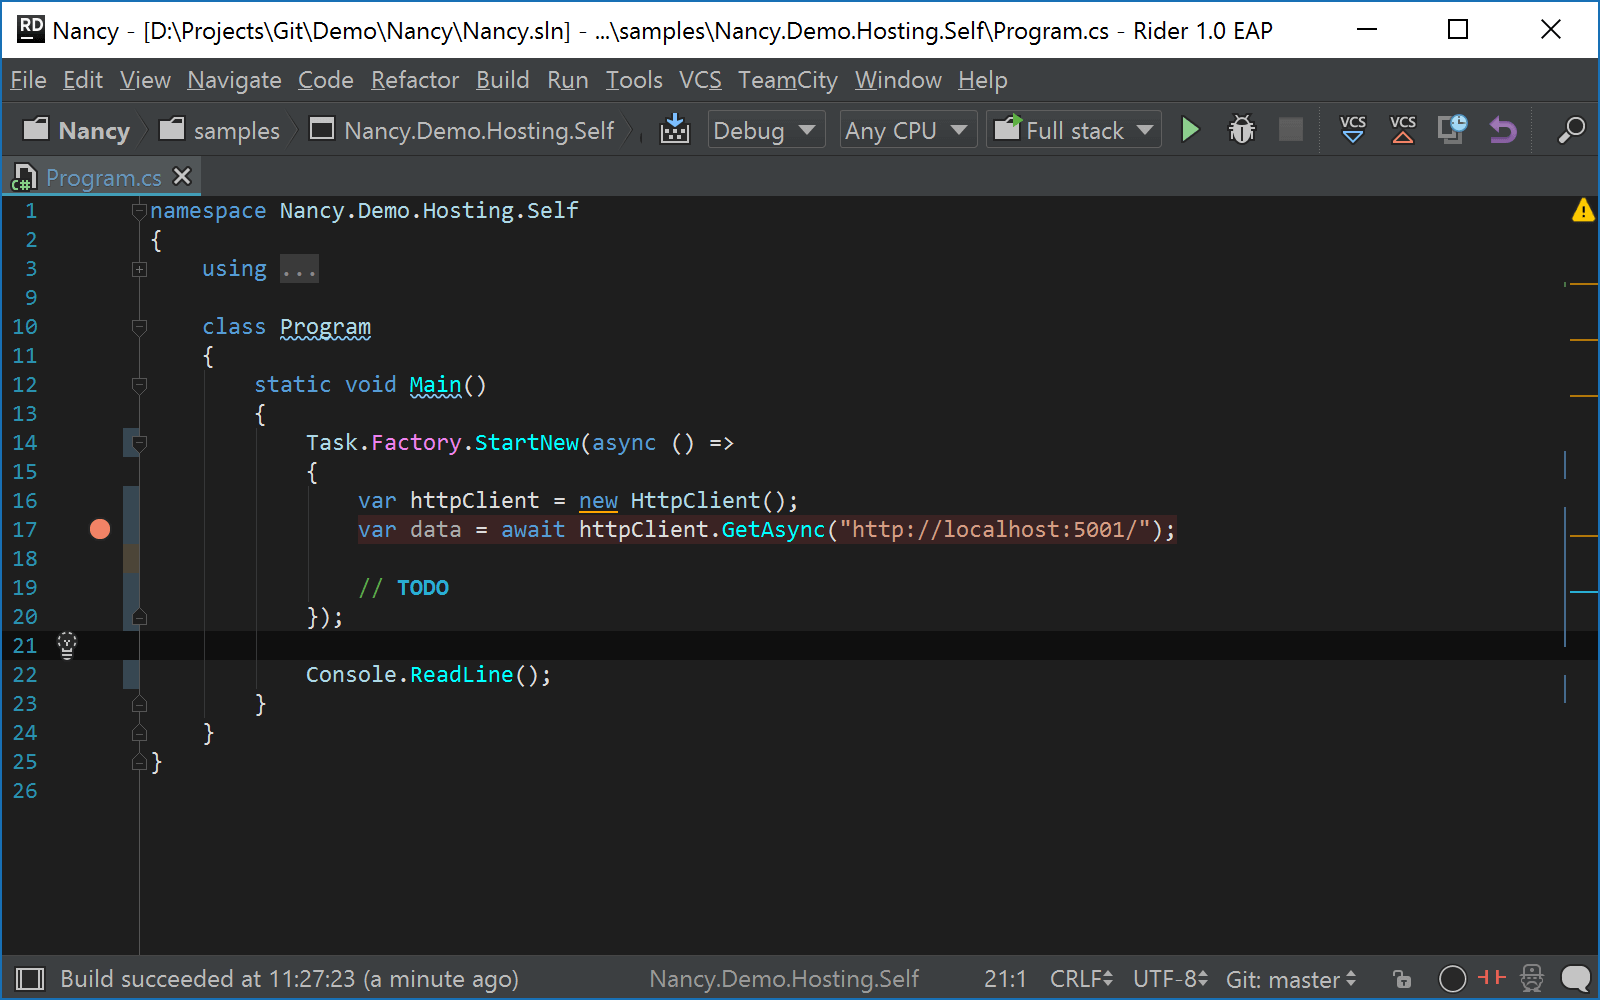
Until now, Rider only allowed attaching the debugger to one of these projects. With Rider EAP 22, we’re adding support to attach the debugger to all projects from the compound run/debug configuration – essentially letting us debug multiple projects simultaneously!
For example we can place a breakpoint in our front-end, then step into the back-end in one go:
Settings for code inspections
Code inspection settings (File | Settings or Ctrl+Alt+S, under Editor) have been split into two pages:
- Inspection Settings lets us enable/disable code analysis as a whole and comes with several toggles to configure highlighting, solution-wide analysis and value analysis.
- Inspection Severity contains all different code inspections where we can enable/disable certain inspections and set their severity.
Productivity guide, favorites, and more
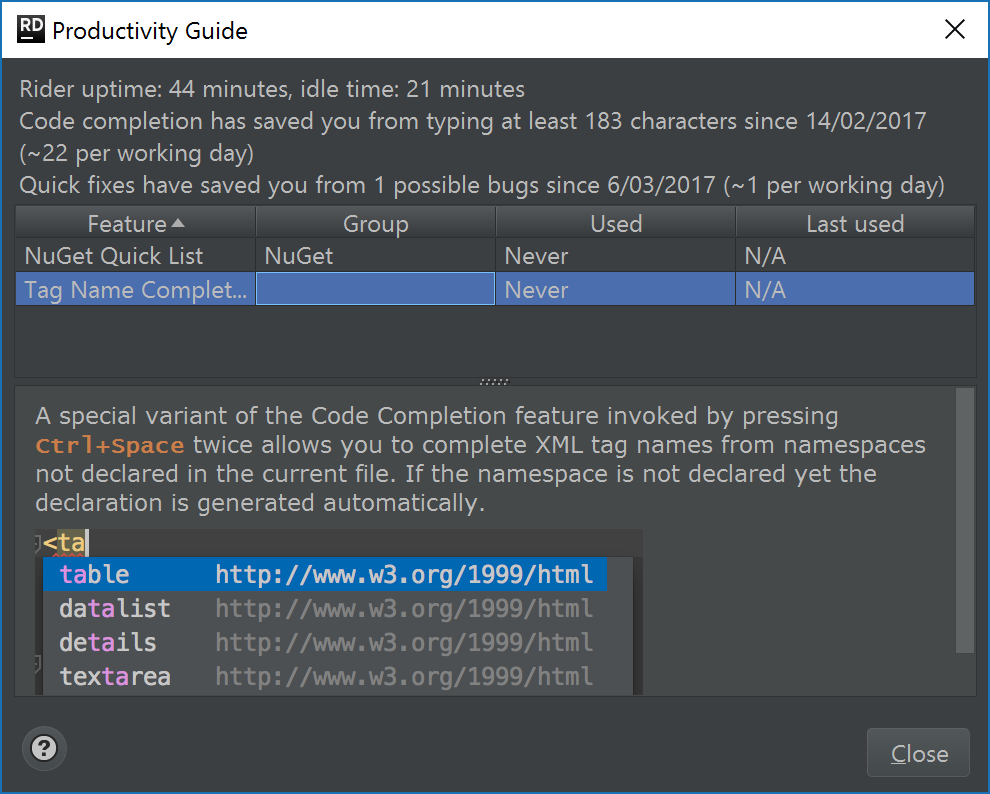
How do we know which features we’re using the most? Does Rider’s automation really save us time during development? One way to find out is the productivity guide. Under Help | Productivity Guide, Rider shows usage statistics for its various features. Next to just showing stats, it also displays additional information about the feature (such as what it does and a keyboard shortcut):
Next to making keyboard shortcuts visible for tool windows (tip: use Alt+# – the number is displayed in the UI), we’ve added a new tool window: Favorites. It shows us a list of favorite project items, bookmarks and breakpoints. From this window, we can quickly navigate to things that are of interest. Bookmarks can be toggled using Ctrl+K, K. Breakpoints using F9.
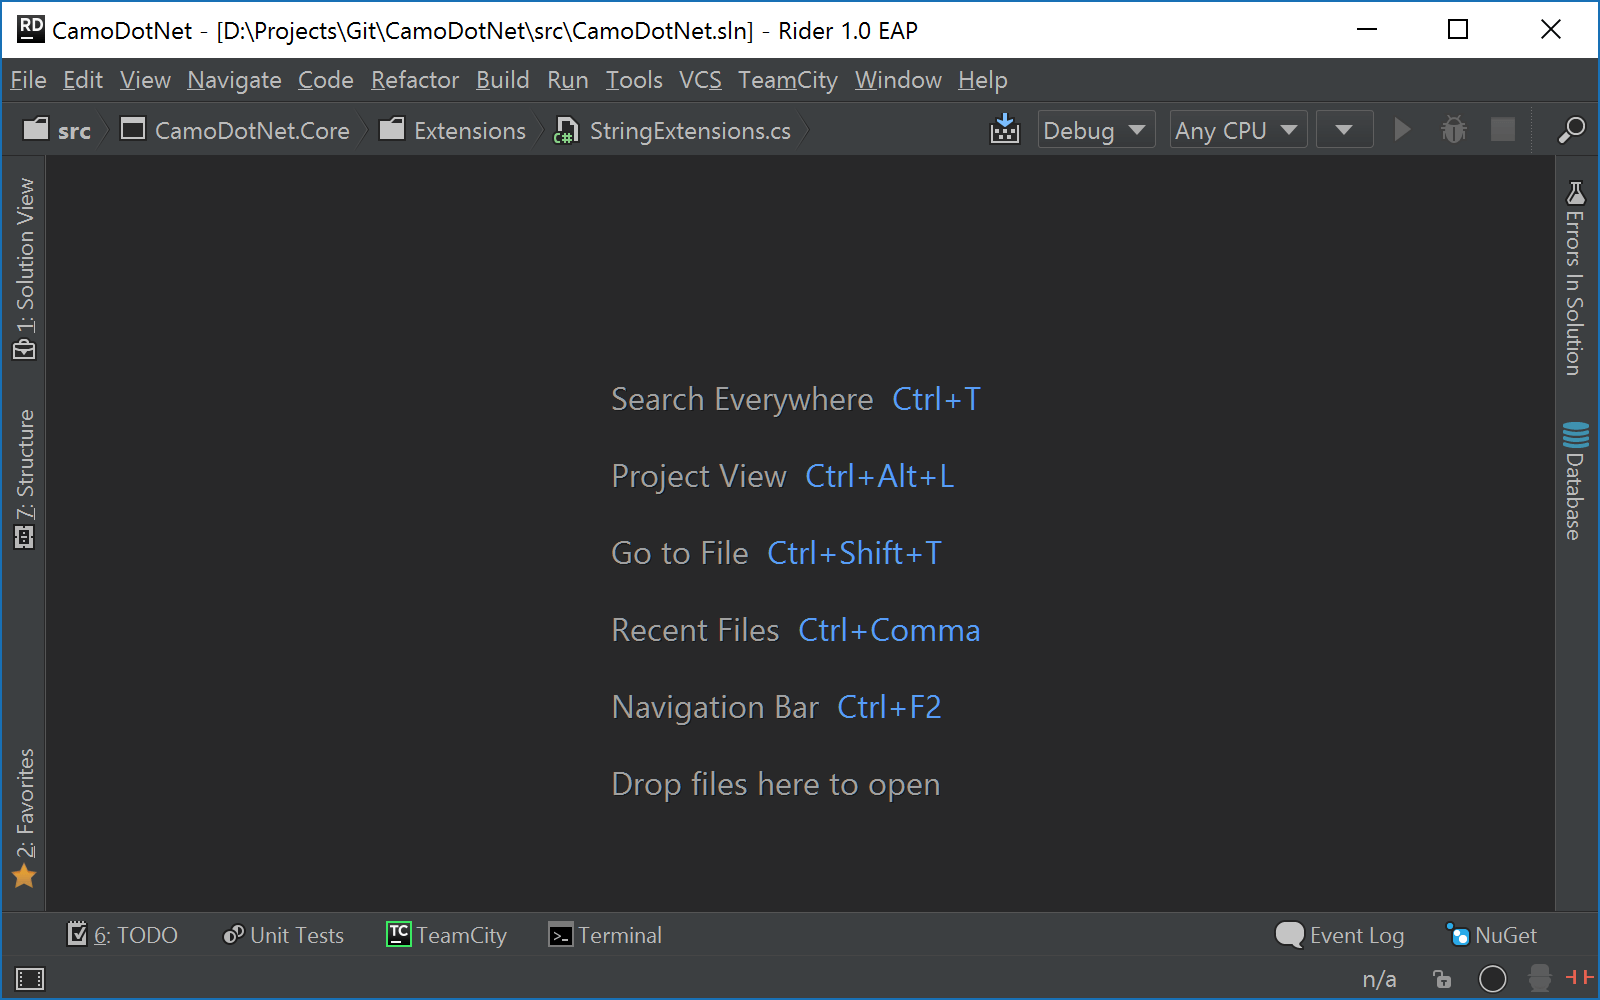
Other things we’ve improved are undo and redo for refactorings and project model modifications: large-scale refactorings like moving a class to a different project can now easily be undone (or redone).
Various bugfixes also went into Rider’s build system. We’ve also fixed a few UI glitches in the build tool window.
Download the lastest Rider EAP now! We welcome your feedback through the comments below!

