

.NET Tools
Essential productivity kit for .NET and game developers
Lambda expression breakpoints and debugger watches in Rider

 Rider comes with a powerful debugger for .NET (and JavaScript) which can be attached to a new or existing process. It lets us place breakpoints to pause the application and inspect variables, the current call stack and so on. In Rider 2017.2, we’ve added several features to make debugging with lambda’s more enjoyable.
Note: make sure to check out our series about Rider’s debugger!
Lambda expression breakpoints
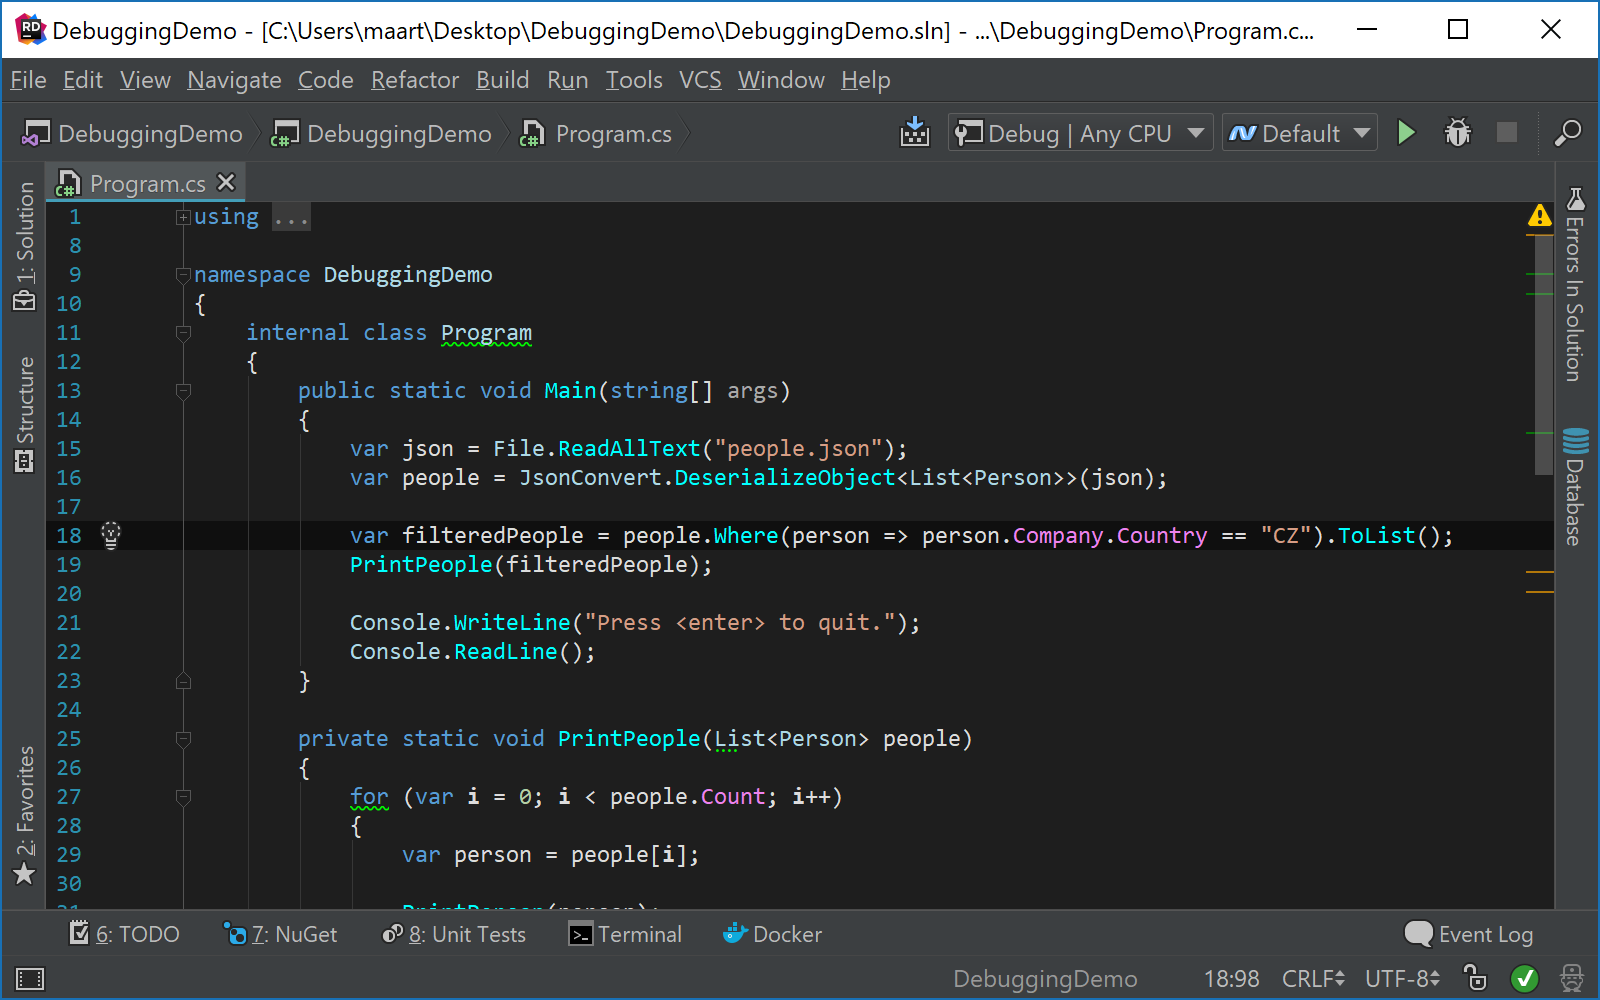
When placing a breakpoint on a line with multiple statements, for example where one is a lambda expression, Rider will ask us whether we want to pause program execution on the entire statement, or just on the lambda:
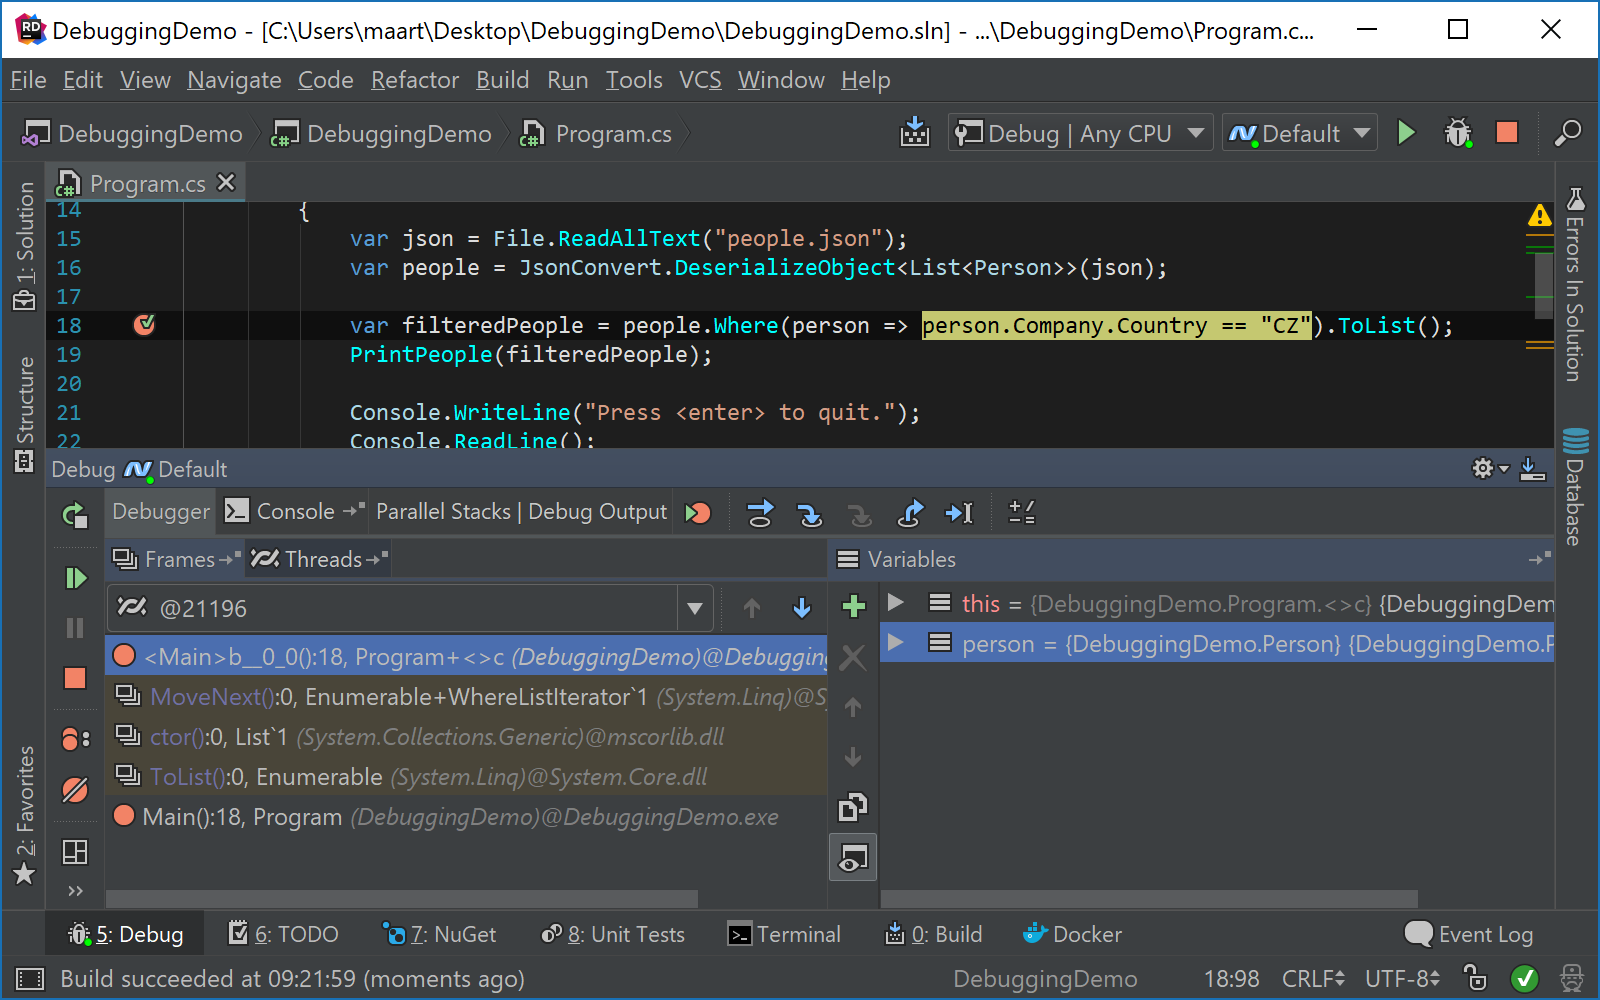
When we then start the debugger, Rider will break on every execution of the lambda (tip: for large collections you may want to look into dependent breakpoints). This allows us to inspect variables within the lambda’s context:
Lambda expressions in debugger watches
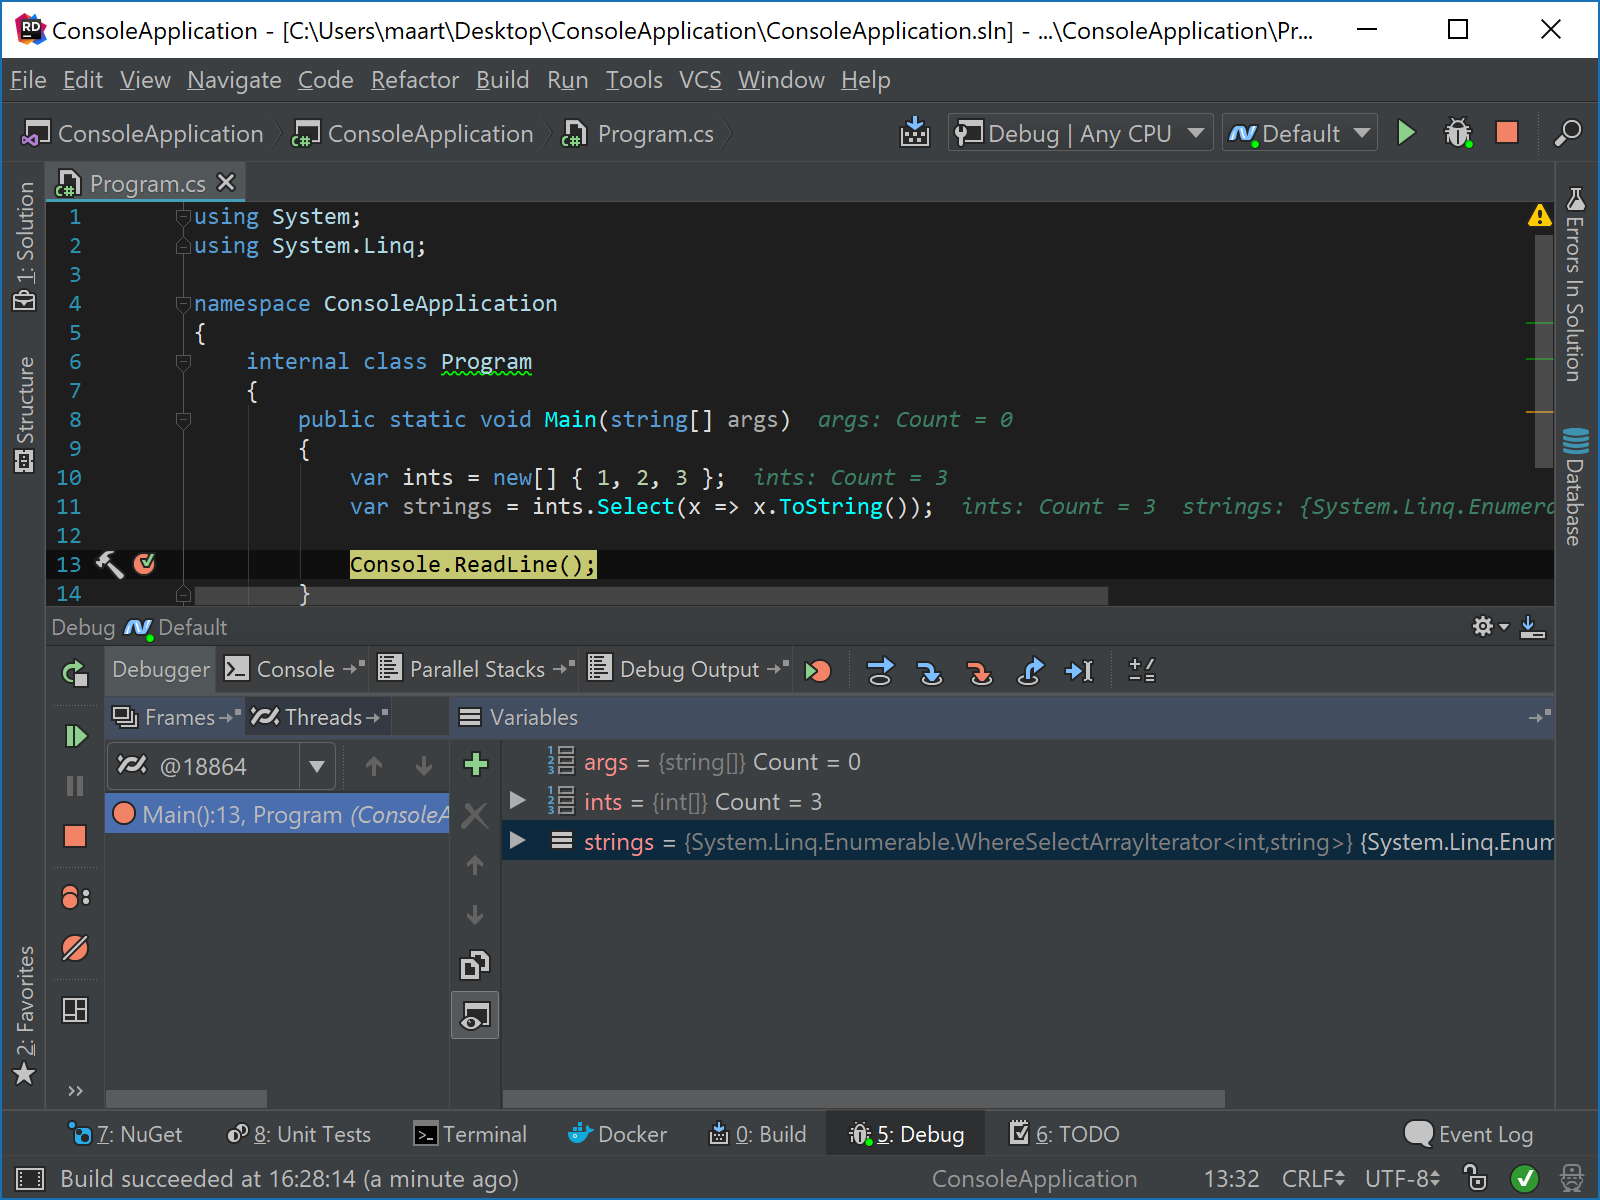
Rider’s debugger now provides support for lambda expressions when adding Watches (Alt+Insert).
Depending on the underlying type, this may execute a database query or enumerate an IEnumerable. Once the debugger evaluates and executes the expression, it visualizes the results:
Download Rider and give it a try! We’d love to hear your feedback.


