

.NET Tools
Essential productivity kit for .NET and game developers
ReSharper 2017.3 brings the debugger into the editor

While debugging, we often have to work with lots of information. We have the autos, locals and watches tool window to look at, code in our editor, … This overdose of information and switching between looking at code and at tool windows often messes with the mental context of the debugging session in our brains.
No more! With ReSharper 2017.3 EAP, we are proud to bring one of Rider’s features into Visual Studio: local variables, current line expressions and function returns are now displayed inside the editor! On top of that, we’re adding searchable DataTips!
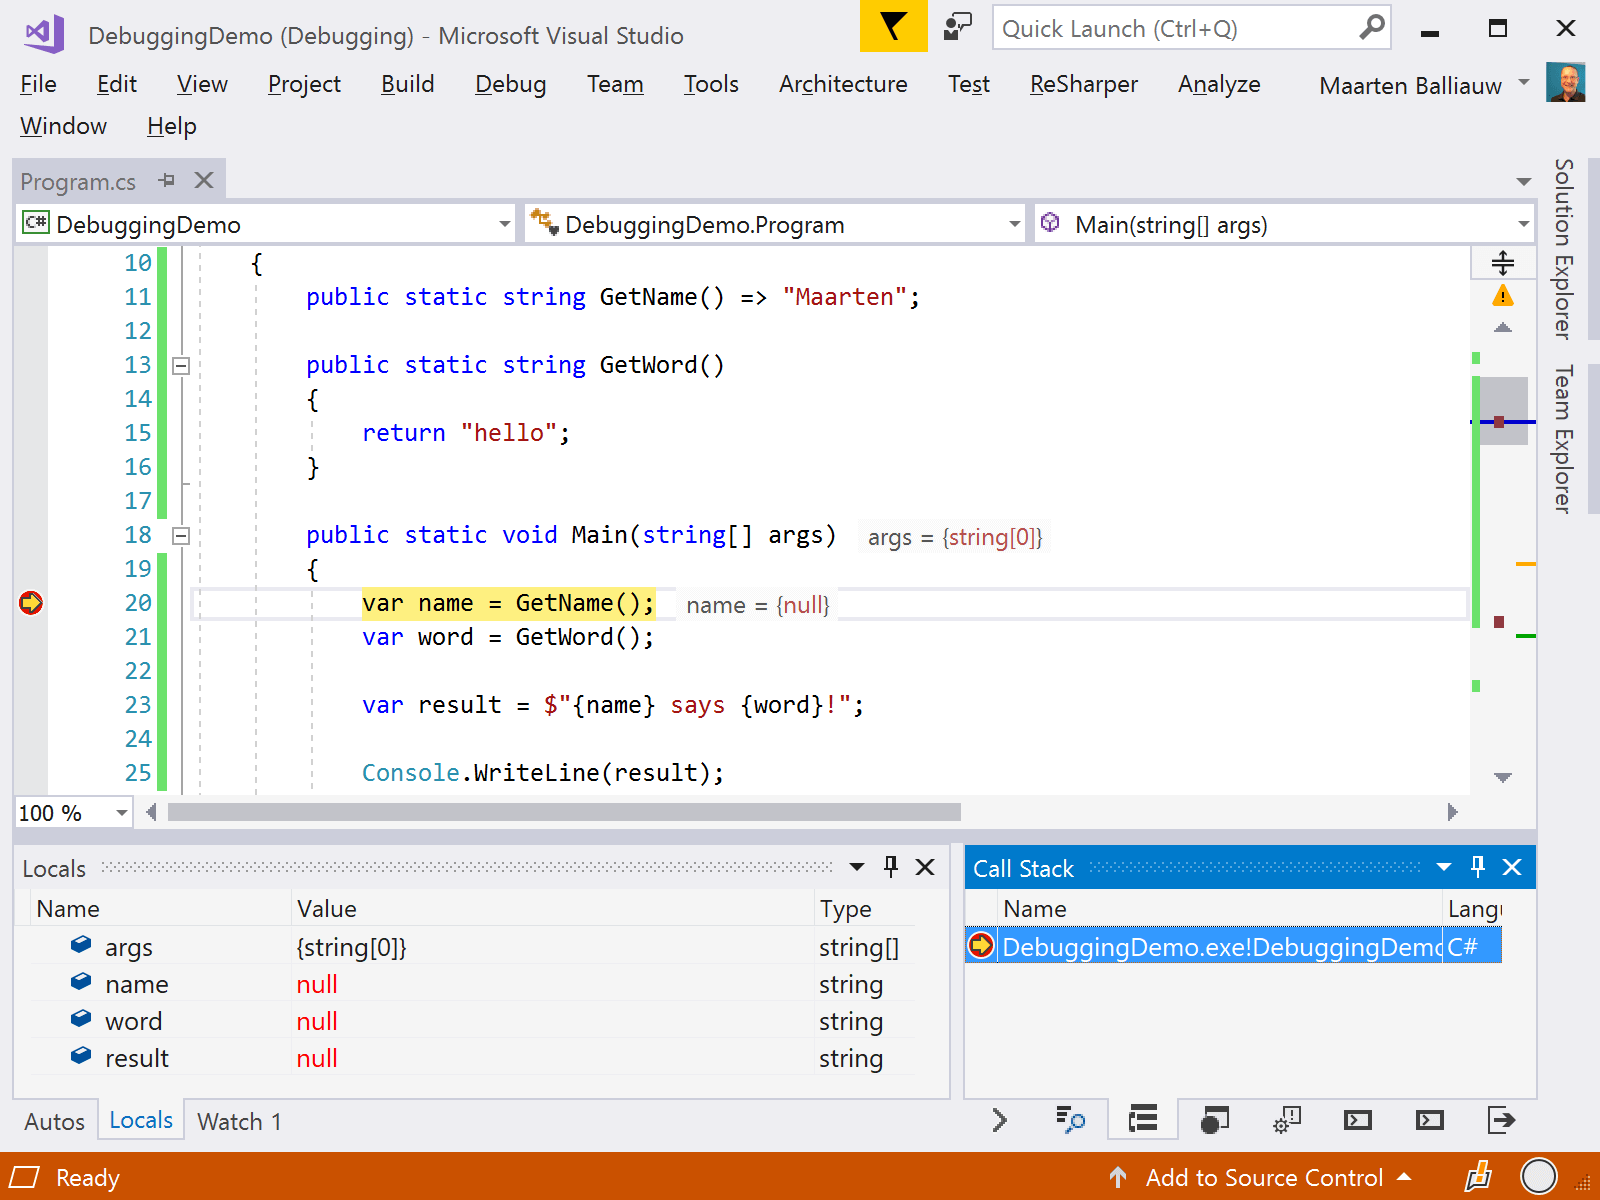
Instead of having to switch between looking at variables in a tool window, we can now see the content of local variables, current line expressions and function return values inline in the editor.
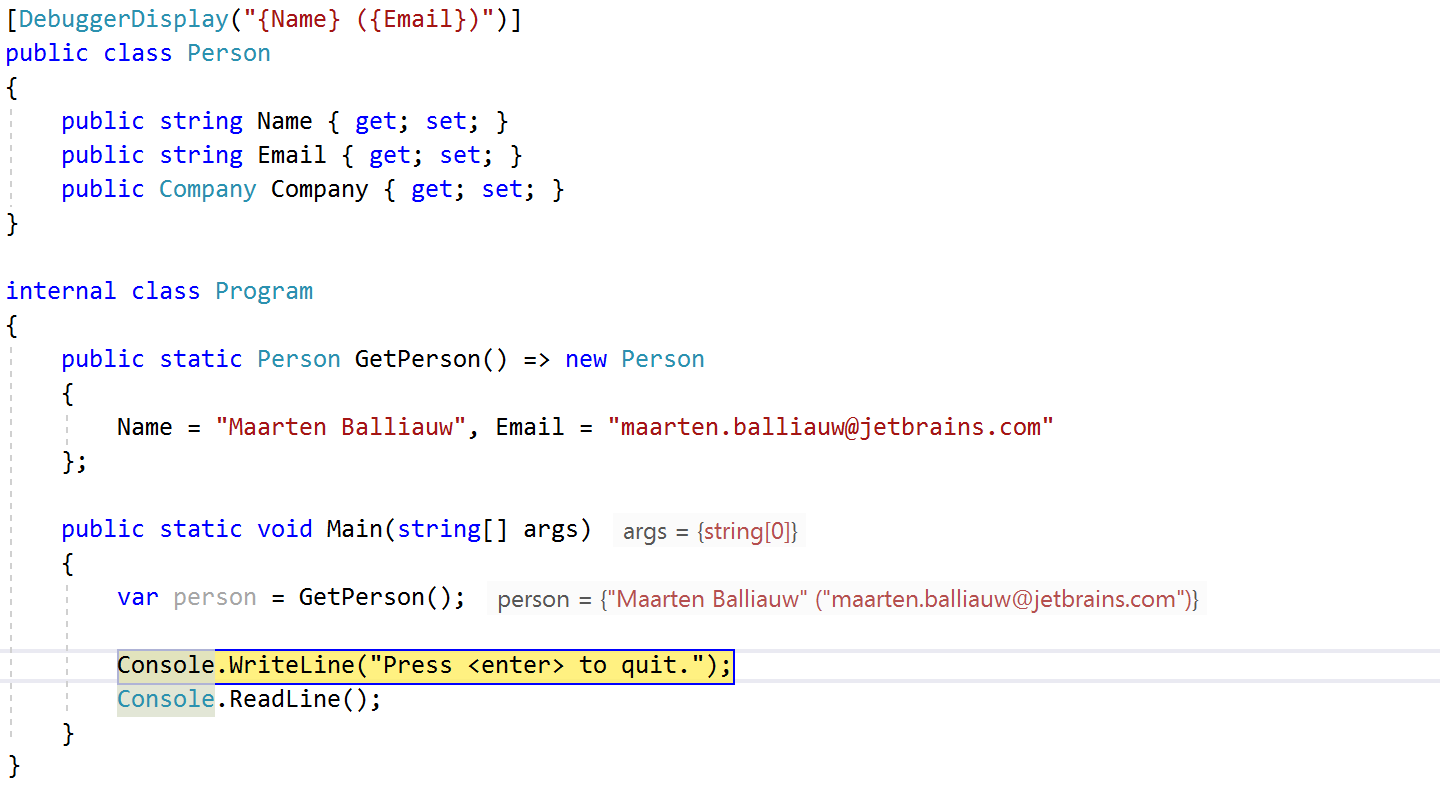
ReSharper visualizes values based on the information it has available. When a class is annotated with the DebuggerDisplayAttribute attribute, ReSharper will use it instead. So for example if we add a DebuggerDisplay attribute to a Person class, we can have ReSharper visualize our type based on some of its properties:
Keep in mind that Rider‘s debugger provides very similar features – check out our series about Rider’s debugger to learn more!
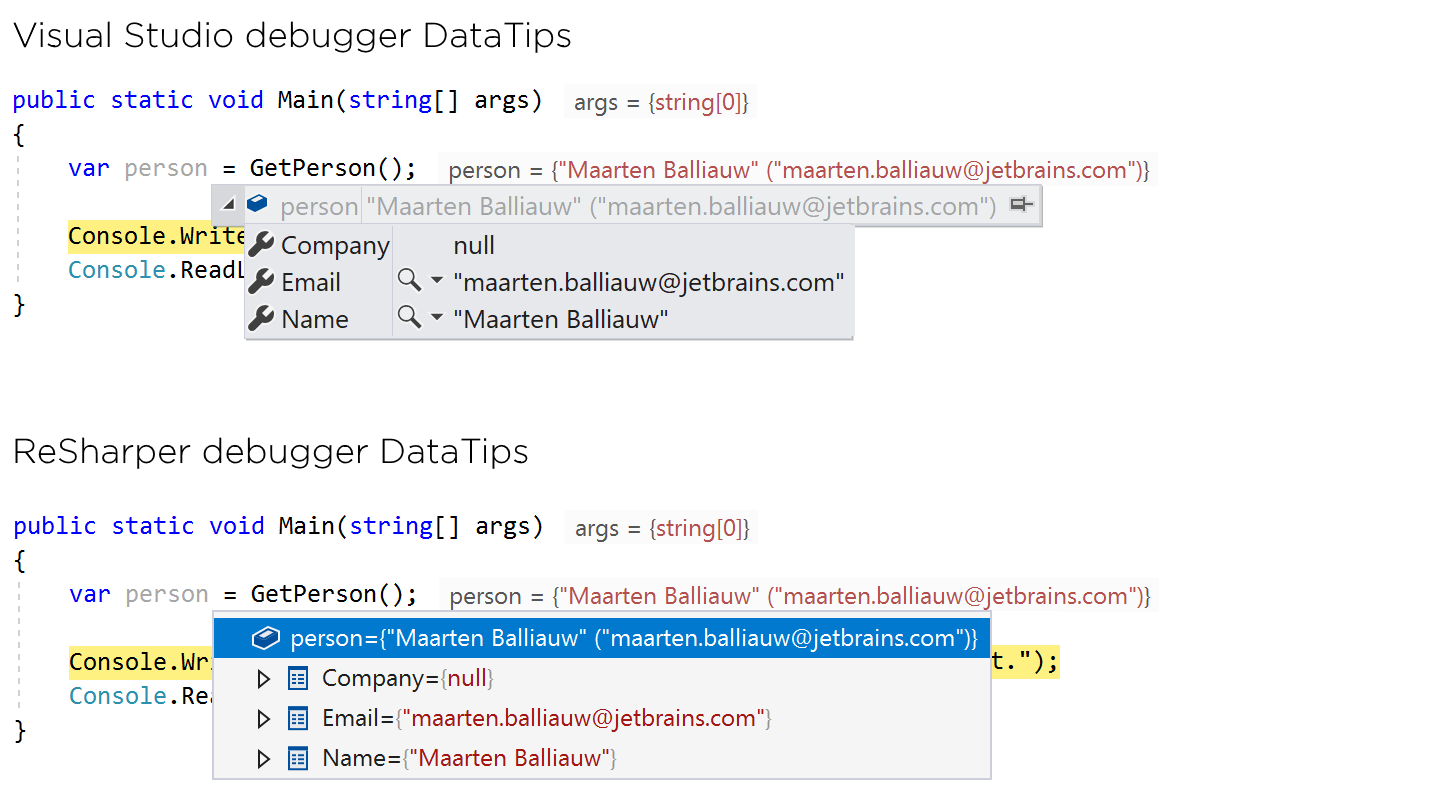
Using ReSharper DataTips
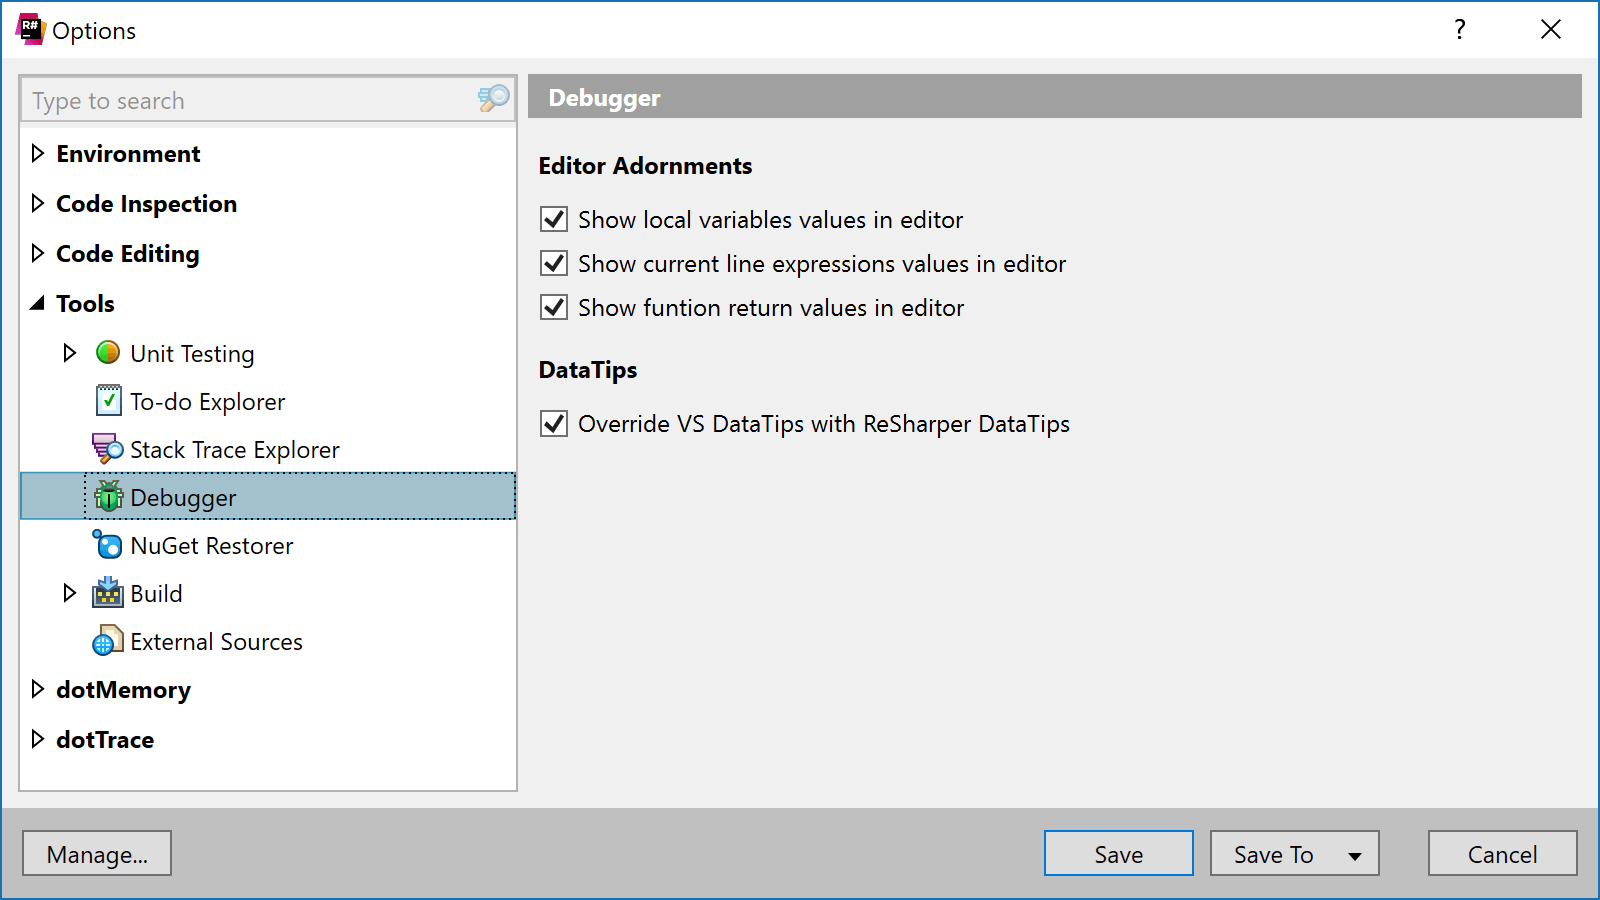
ReSharper comes with its own debugger DataTips as well. We can access them by clicking the inline value display, or by replacing the Visual Studio DataTips from the ReSharper settings under Tools | Debugger:
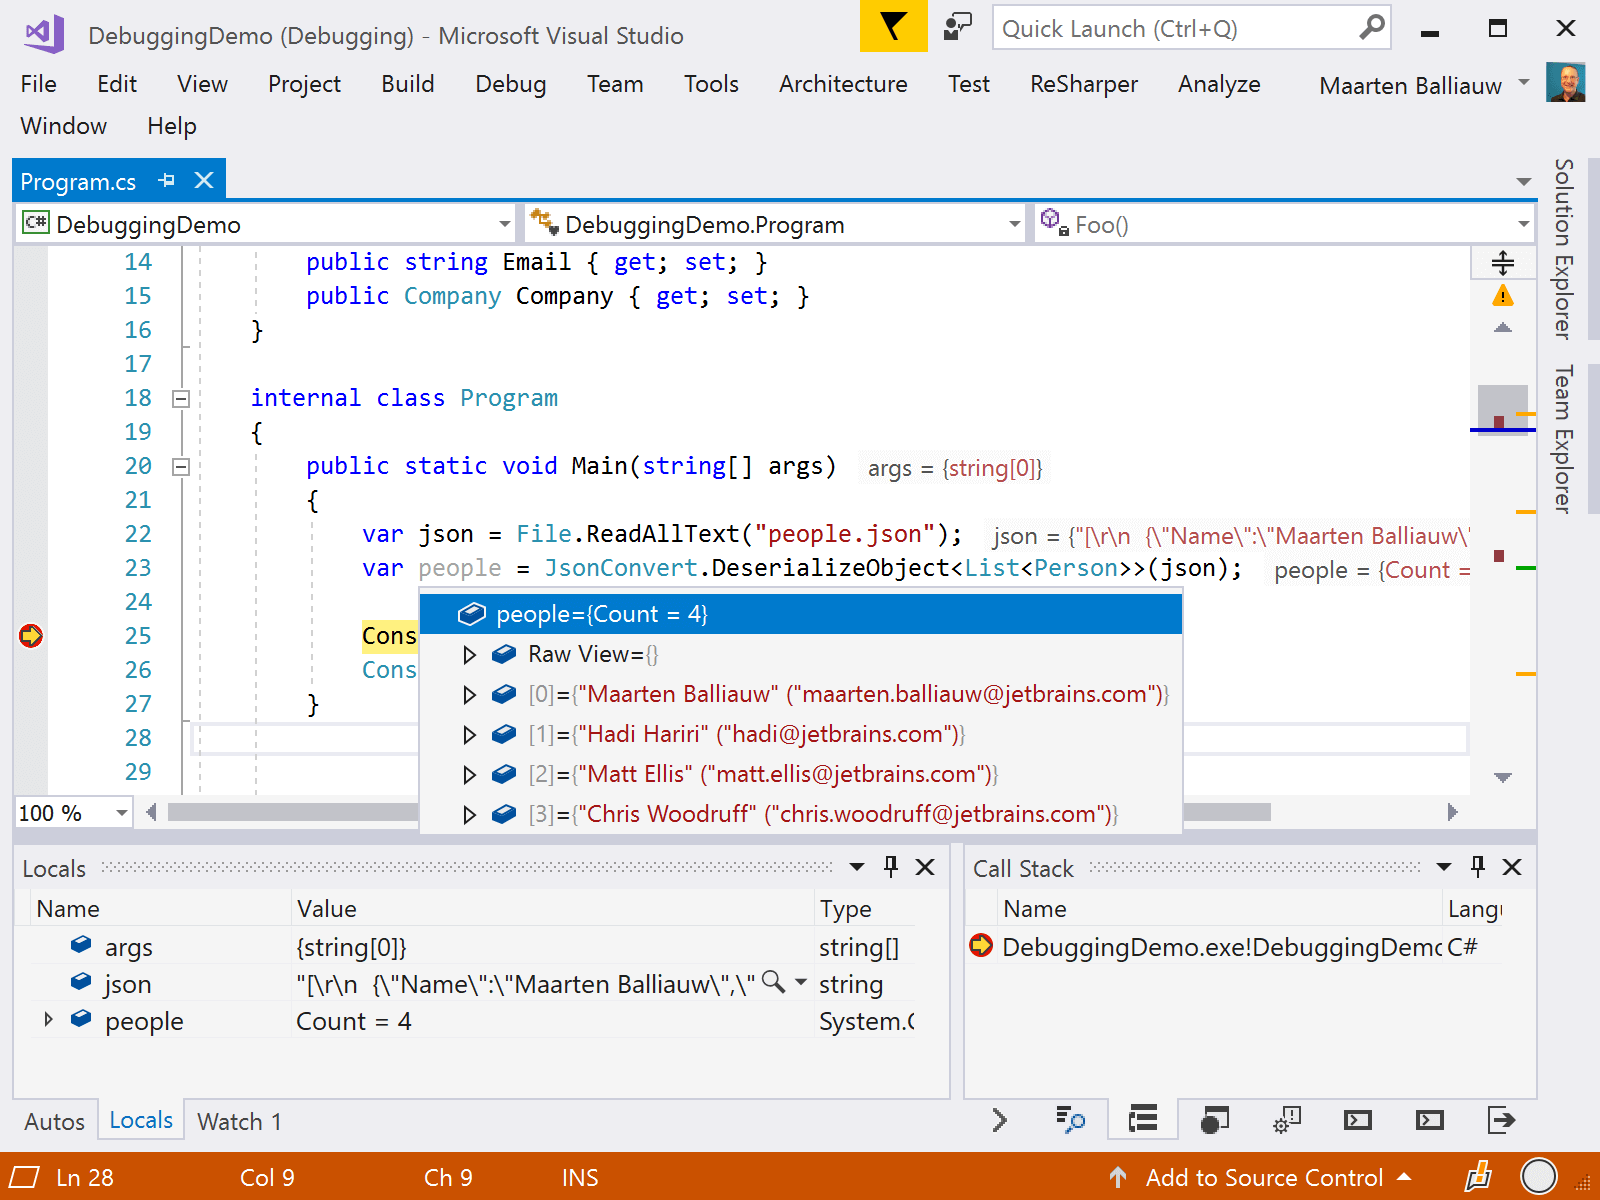
The ReSharper DataTips make it easier to search for a specific value. For example if we load the list of people from a file and want to check a given person is in there, we can expand the collection and then start typing to search through. Note that searching is only possible in expanded nodes.
Configuring ReSharper debugger tools
These new debugger tools come with several configuration options. From the ReSharper settings under Tools | Debugger, we can toggle the different elements that can be shown in the editor:
In case you prefer not to display local variables, current line expressions and function return values inline in the editor, the entire feature can be toggled under General | Product & Features, then Debugger Integration.
Download ReSharper 2017.3 EAP and give it a try! We’d love to hear your feedback on the new ReSharper debugger tools!

Subscribe to a monthly digest curated from the .NET Tools blog:


