

.NET Tools
Essential productivity kit for .NET and game developers
Async call stack and more debugger improvements in Rider 2017.3

A number of debugger improvements were made in recent Rider 2017.3 EAP builds. It’s now possible to drag-and-drop the execution point, several debugger actions are now part of Alt+Enter, Rider displays function return values in locals view, and for async calls we now expand the async call stack. And there’s also Smart Step-Into which we blogged about earlier.
Next to new features, there are the obvious bug fixes as well. There’s better support for NUnit and some mocking frameworks where Rider would not show proper type information (fixed “#Undecoded type” when debugging). The Rider debugger is now faster to attach to applications that make a lot of allocations.
Time for an overview of what is new for Rider’s debugger!
Drag-and-drop debugger execution point
Debugging typically involves stepping through code, and understanding the logic that we as developers thought we implemented. It’s a very focused activity, and sometimes we have to be able to move the execution pointer to an earlier or later location in our code to retry or skip certain logic without having to restart the application.
With this EAP build we’re adding support for dragging-and-dropping the execution pointer!
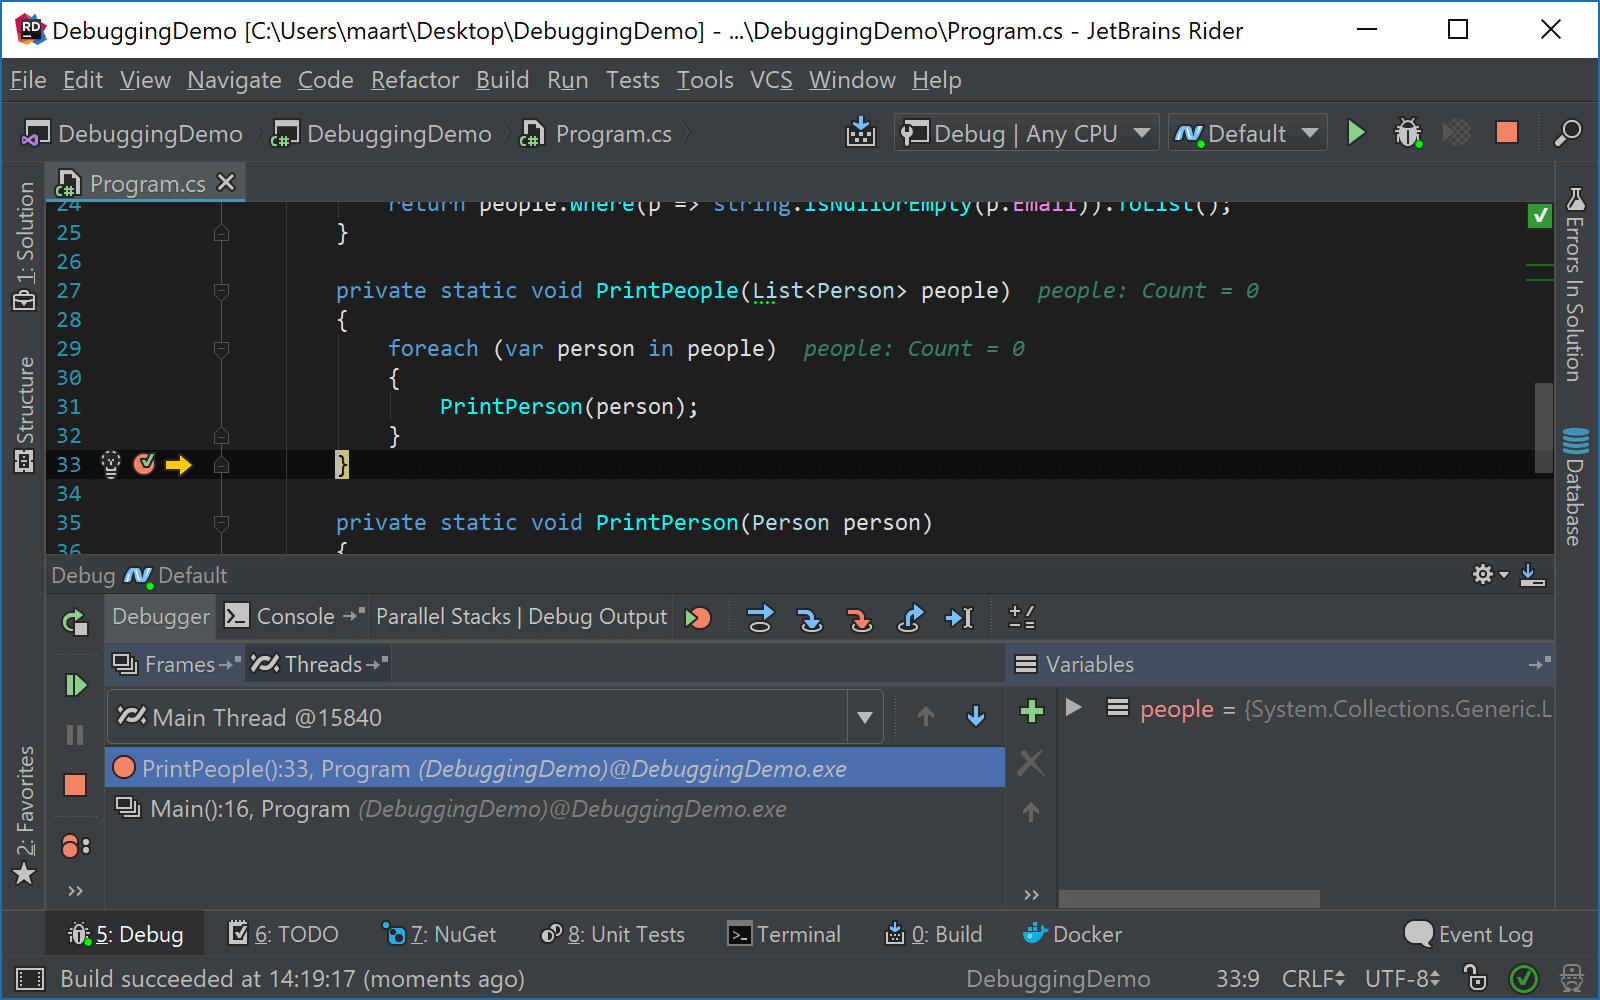
The execution pointer is now represented as an arrow in the left-hand gutter, and we can now use the mouse to change the location of the execution pointer. Of course we can still make use of the Set next statement (Ctrl+Shift+F10) action, or use Alt+Enter.
Controlling the debugger with Alt+Enter
A common joke here at JetBrains is that you can do anything with Alt+Enter. Turns out that’s only a half-joke*: we can now control the debugger with it!
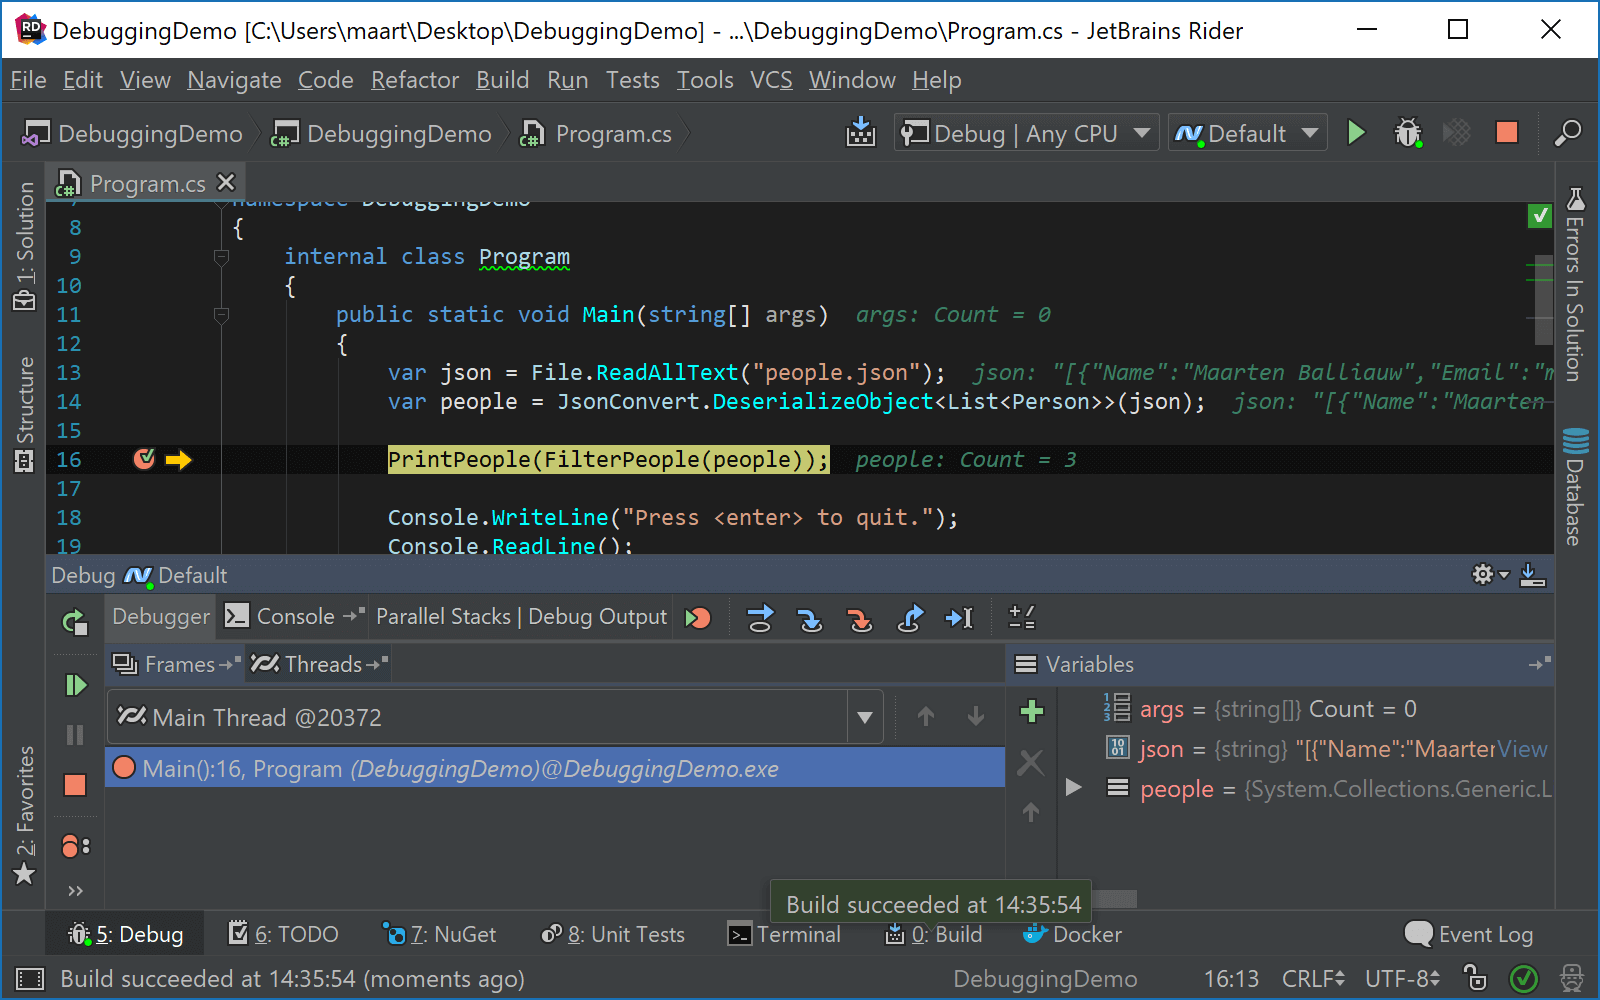
While debugging, we can perform the most common debugger actions from the Alt+Enter menu, for example Run to cursor, Set next statement or remove breakpoints.
(* That half-joke is really a non-joke: if we press Alt+Enter in the editor, we can just start typing and find any action that can be performed in the IDE – give it a try)
Function return values in locals window
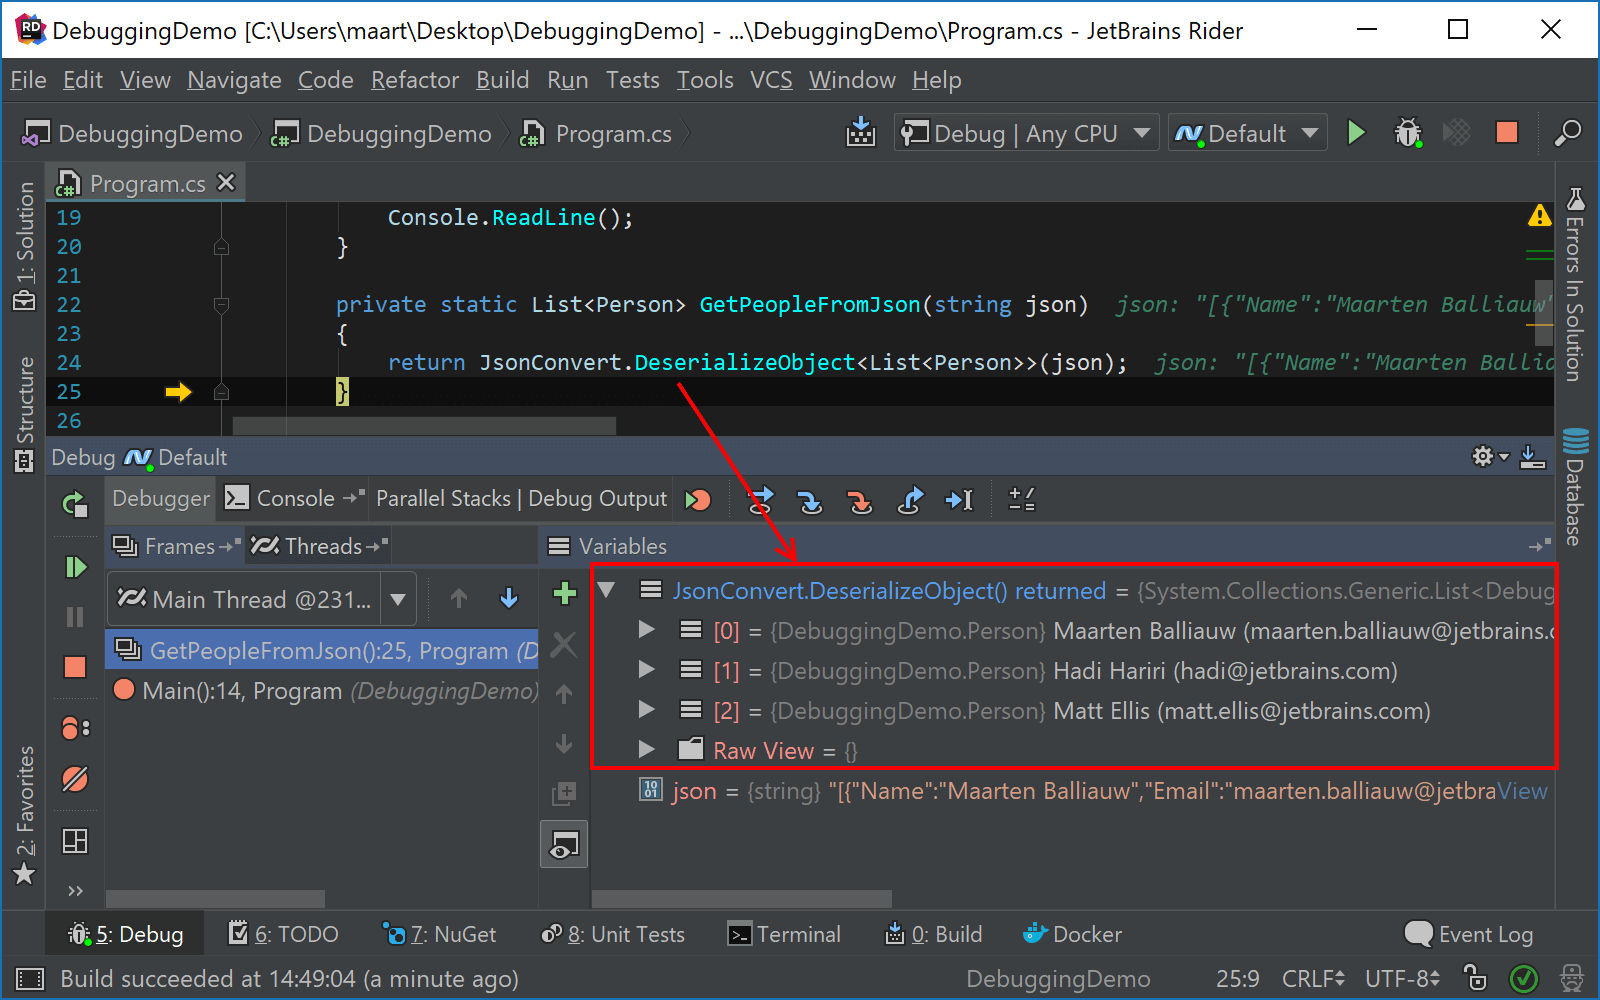
Many have asked for this one: Rider now displays function return values in the locals window. When stepping through code, Rider will display the return value of any function we called. This is useful when the result of a method call is not stored in a local variable, for example when just returning another function’s return value or when using method chaining.
Async call stack (async causality chain tracking)
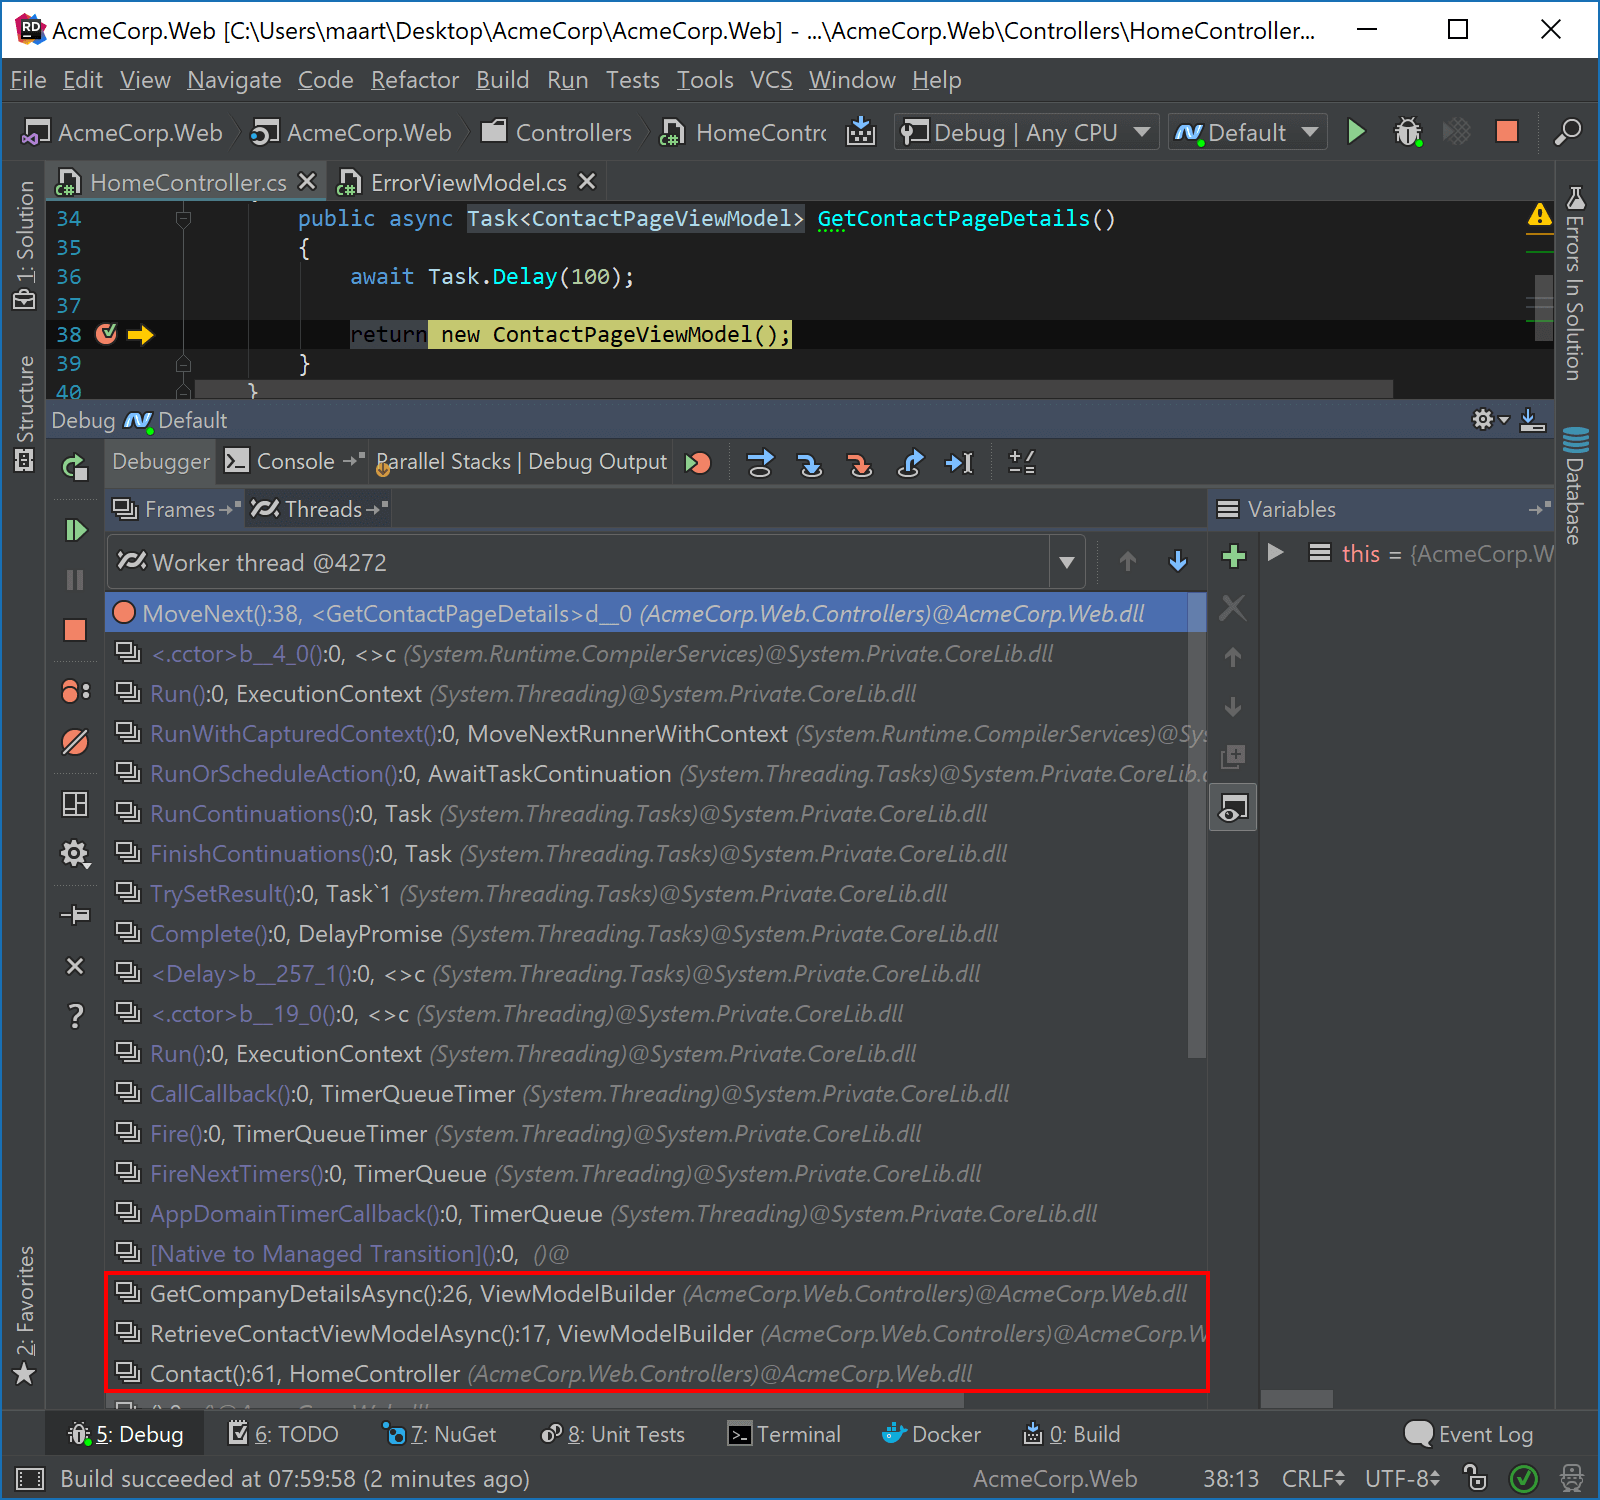
When debugging code with async method chains, earlier versions of Rider would display [Native to Managed Transition] in the debugger’s call stack when debugging an async method chain.
For normal methods, as well as with async/await and tasks, it’s pretty easy to display a full call stack if our code runs on the same stack as the caller. Things get more complicated when we are using “real” await and tasks (e.g. awaiting I/O or a Task.Delay()). In these cases, we don’t really have a call tree, but a call chain where one task executes only after another finishes. The async/await machinery will lose all data about async callers in this case.
Rider 2017.3 will help answer the one question we have while debugging – “How did I get at the current execution point?”– by restoring and displaying the full async causality chain.
Give the latest Rider 2017.3 EAP build a try and let us know what you think!

Subscribe to a monthly digest curated from the .NET Tools blog:


