

.NET Tools
Essential productivity kit for .NET and game developers
What’s new in dotTrace 2017.3

The latest major release brought many important changes to the entire family of ReSharper Ultimate tools. In this post, let’s take a close look at what has changed in dotTrace 2017.3.
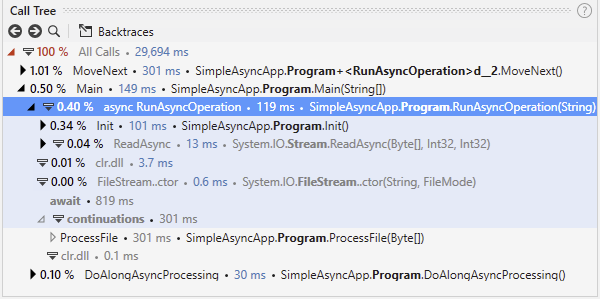
Support for async/await
The most important update in dotTrace 2017.3 is its support for asynchronous code. The details can be found in a separate article, so here we’ll only give an overview of the key idea.
You can now quickly find all “parts” of an asynchronous call in one place. dotTrace marks all async call nodes in the Call Tree and groups the corresponding await time and continuation code under those nodes.
Now let’s see what other important updates dotTrace 2017.3 offers.
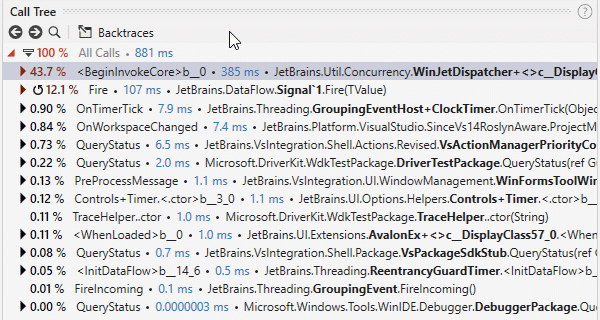
Forecasting performance in Timeline Viewer
If you’re a long-term dotTrace user, you probably know that the “classic” dotTrace Performance Viewer lets you remove particular functions from the snapshot. This helps answer the question, “What if there were no such function?”, or “Is it worth optimizing this function?”.
The exact same feature is now available in the Timeline Viewer. Right-click the function in the Call Tree and choose either Exclude This Call Path (to exclude this particular function call) or Exclude Method (to exclude all calls to that function) from the context menu.
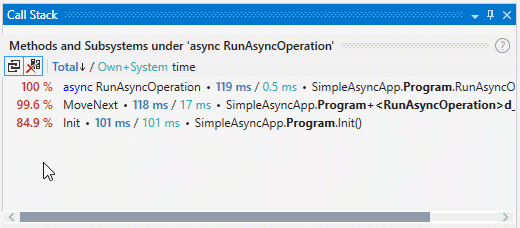
Backtraces in Methods and Subsystems (Timeline Viewer)
Backtraces is an awesome feature that allows you to track the origin of a particular call. In this mode, the call tree is inverted so that you see all of the parent calls.
Before 2017.3, the only option to view backtraces was to use the Call Tree. This was not very convenient if you examined the list of top methods in Methods and Subsystems and wanted to get more details about a method: no one likes to switch contexts. Now, you can view backtraces right in Methods and Subsystems. Simply hover the mouse over the method you’re interested in and click the arrow symbol on the left.
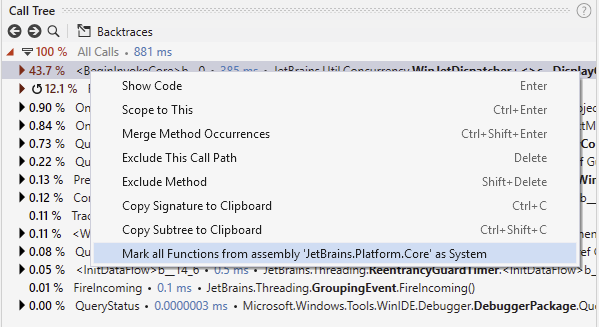
Marking user assemblies as system assemblies
Sometimes, you want dotTrace to treat particular user modules/assemblies as system assemblies. This may be helpful, for example, if the user modules/assemblies provide some core functionality and are not supposed to be optimized.
In dotTrace 2017.3, you have the option to mark a user assembly as a system one. After you do this, two things will happen. First, the execution time (shown in Methods and Subsystems) of methods belonging to this assembly will be calculated as if it was a system assembly. Second, all calls (of methods belonging to this assembly) will be folded in the Call Tree as if they were system calls, i.e. a group of calls will be collapsed into a single node so as not to distract you.
To mark a user assembly as a system assembly, simply right-click a method that belongs to the assembly you want to mark as a system one, and then select Mark all Functions from Assembly ‘MyAssembly’ as System (where ‘MyAssembly’ is the name of the assembly you want to mark as a system one).
As usual, the features described above are supplemented by lots of minor improvements and bug-fixes in dotTrace 2017.3. We invite you to download the latest ReSharper Ultimate and try the new features in action. Let us know how you like them!


