

.NET Tools
Essential productivity kit for .NET and game developers
Live Edit and Spy-JS in Rider 2017.3

In the previous post of our series exploring WebStorm functionality in Rider, we looked at improvements in our Angular and Vue.js support, as well as added support for --watch in Jest and Mocha test runners. In this post, we want to introduce you to two great tools for JavaScript and web development: LiveEdit and Spy-JS.
This post is part of a series:
- General web development updates in Rider 2017.3
- Web framework updates in Rider 2017.3 – Angular, Vue.js, …
- Live Edit and Spy-JS in Rider 2017.3
- Web developer tools in Rider 2017.3: HTTP client and SVG editing
Live Edit
When debugging a web application in Rider, the Run/Debug configuration has an option to launch the browser and enable Live Edit. This will launch the web browser and navigate to a the URL of the application being debugged.
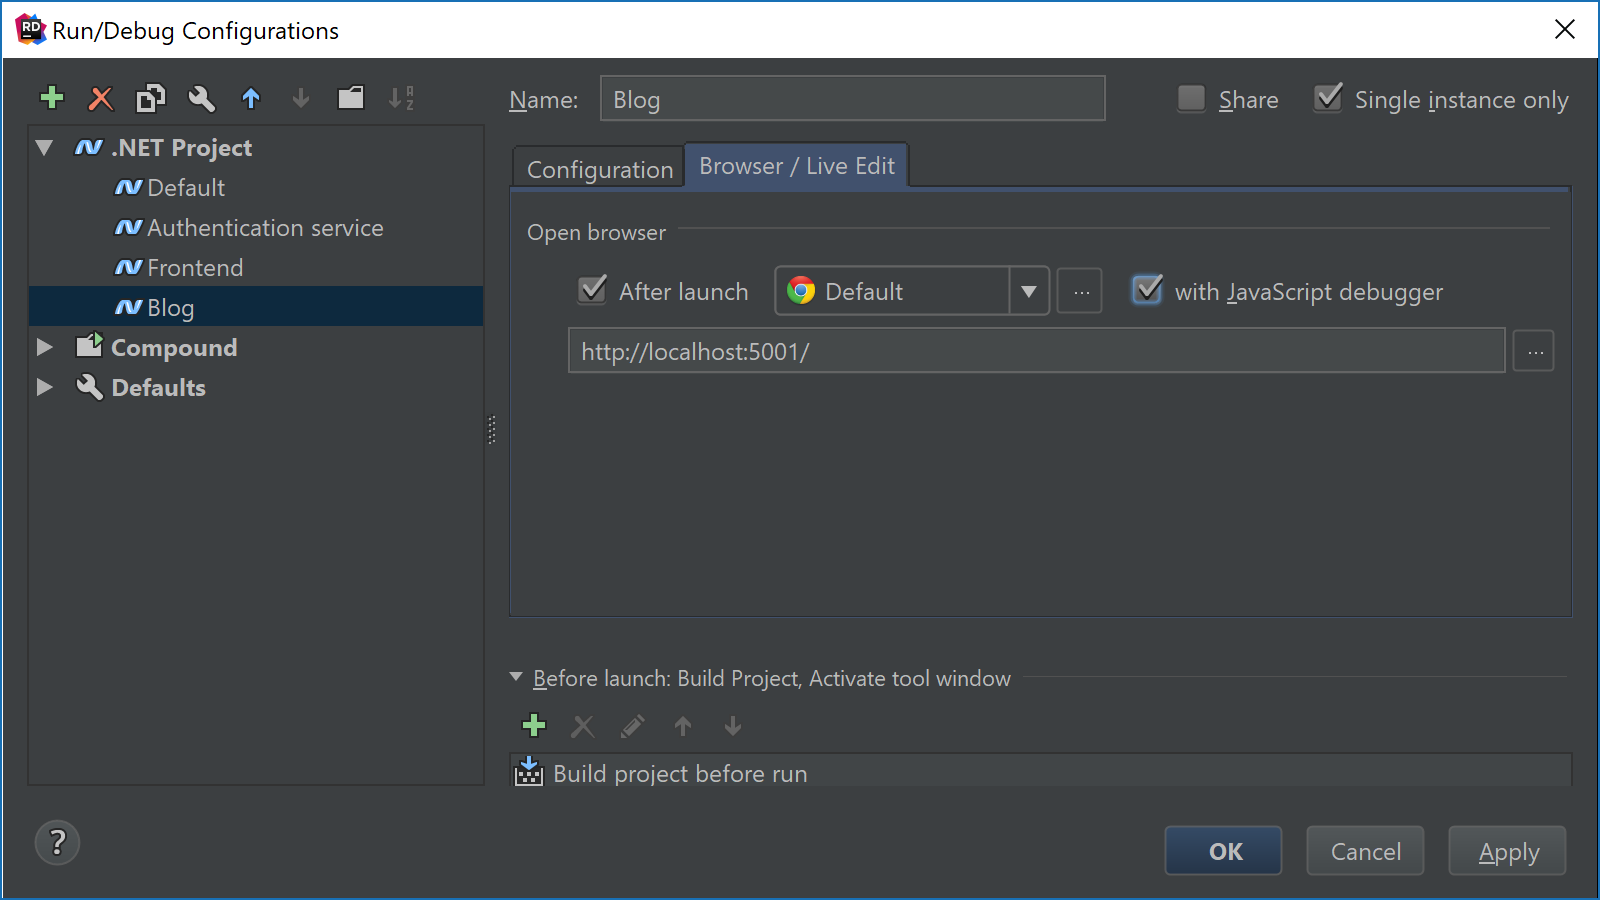
When starting our debugging session, Rider will open the browser and become the JavaScript debugger!
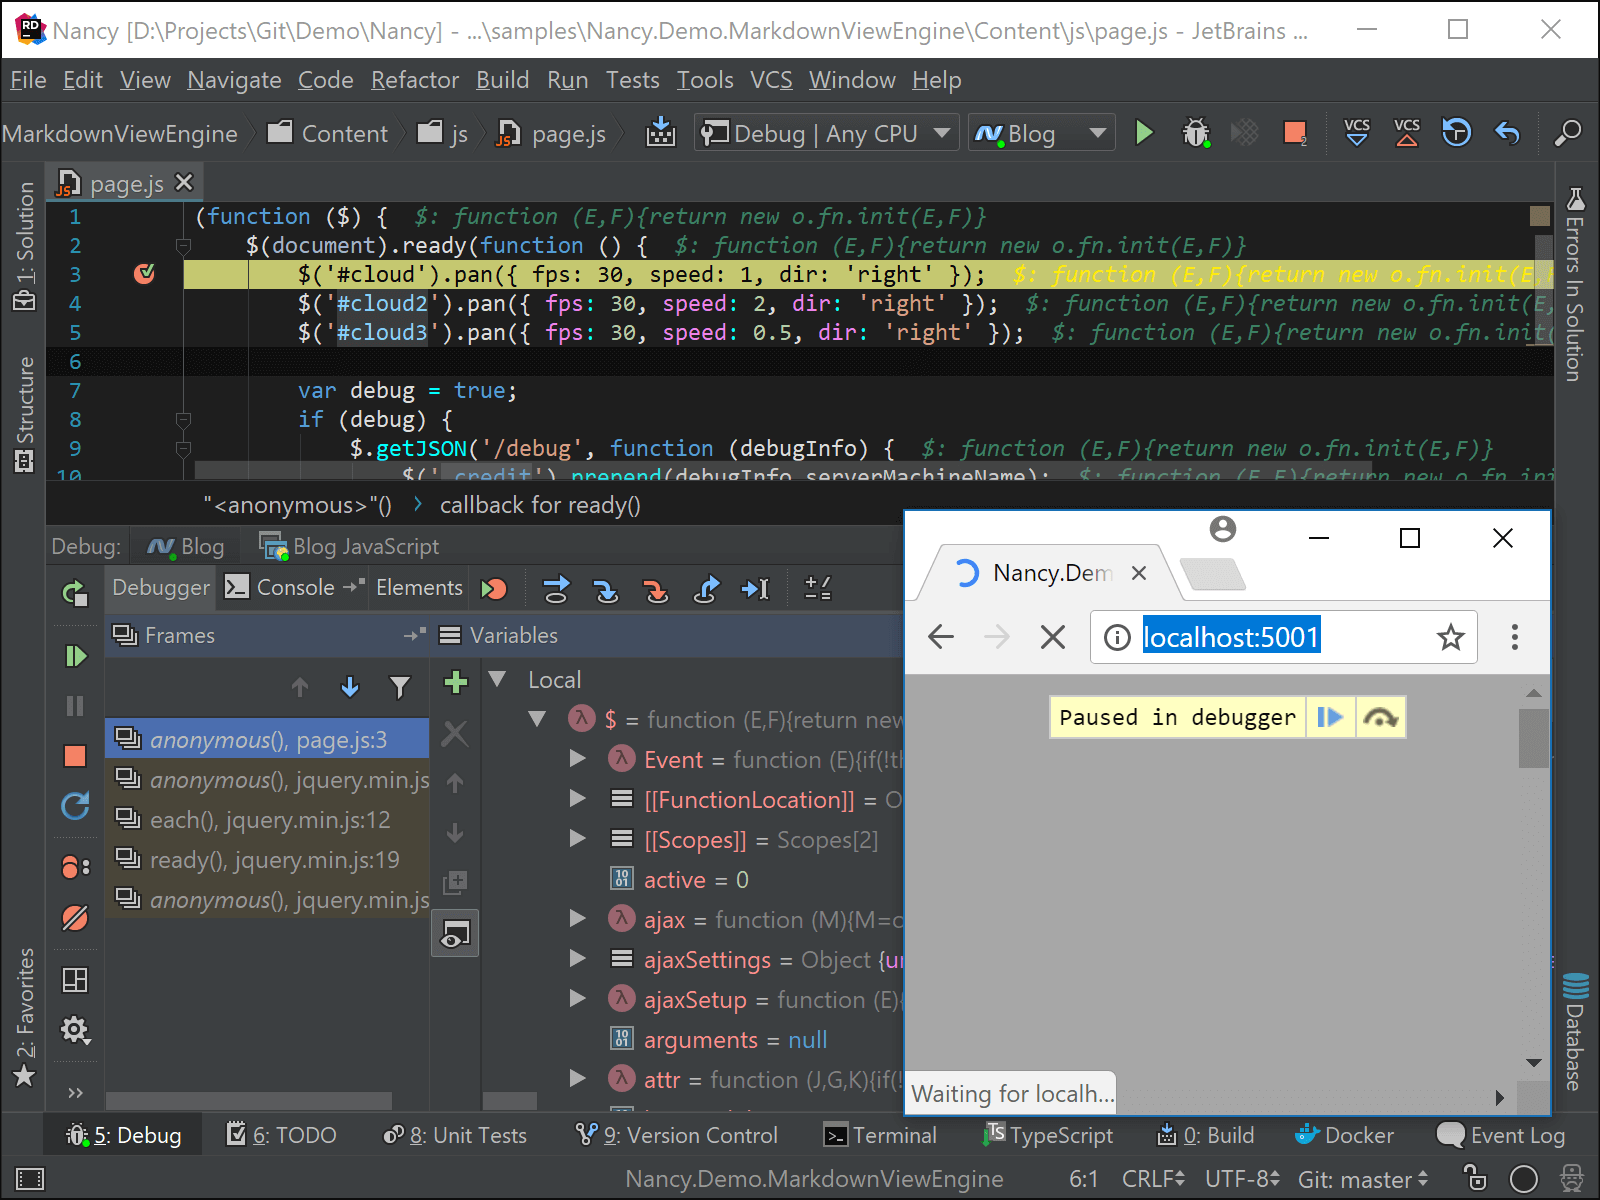
Do check our post on simultaneous debugging of JavaScript and .NET code with Rider as well: LiveEdit makes it possible to debug our .NET application simultaneously with the JavaScript running in the browser.
Not only debugging: After installing the JetBrains IDE Support extension into Chrome, Rider lets us edit any HTML, JavaScript and CSS files and will preview changes live, in the browser!
From the settings under Build, Execution, Deployment | Debugger | Live Edit, we can specify some additional options like how soon JavaScript code should be reloaded etc.
Note that these features only work for HTML, JavaScript, TypeScript and CSS files. Live editing HTML or debugging JavaScript code that is embedded in Razor files is not yet supported.
Spy-JS
Spy-js is a tool that lets us debug/trace/profile JavaScript running on different platforms/browsers/devices. Or in other words: it allows debugging, tracing and profiling for any JavaScript-based language (such as TypeScript, CoffeeScript, …) whether it is running in the browser or using node.
To run Spy-js, we will need node installed, after which we can create a Run/Debug configuration that targets either a remote URL or an application running on our local machine.
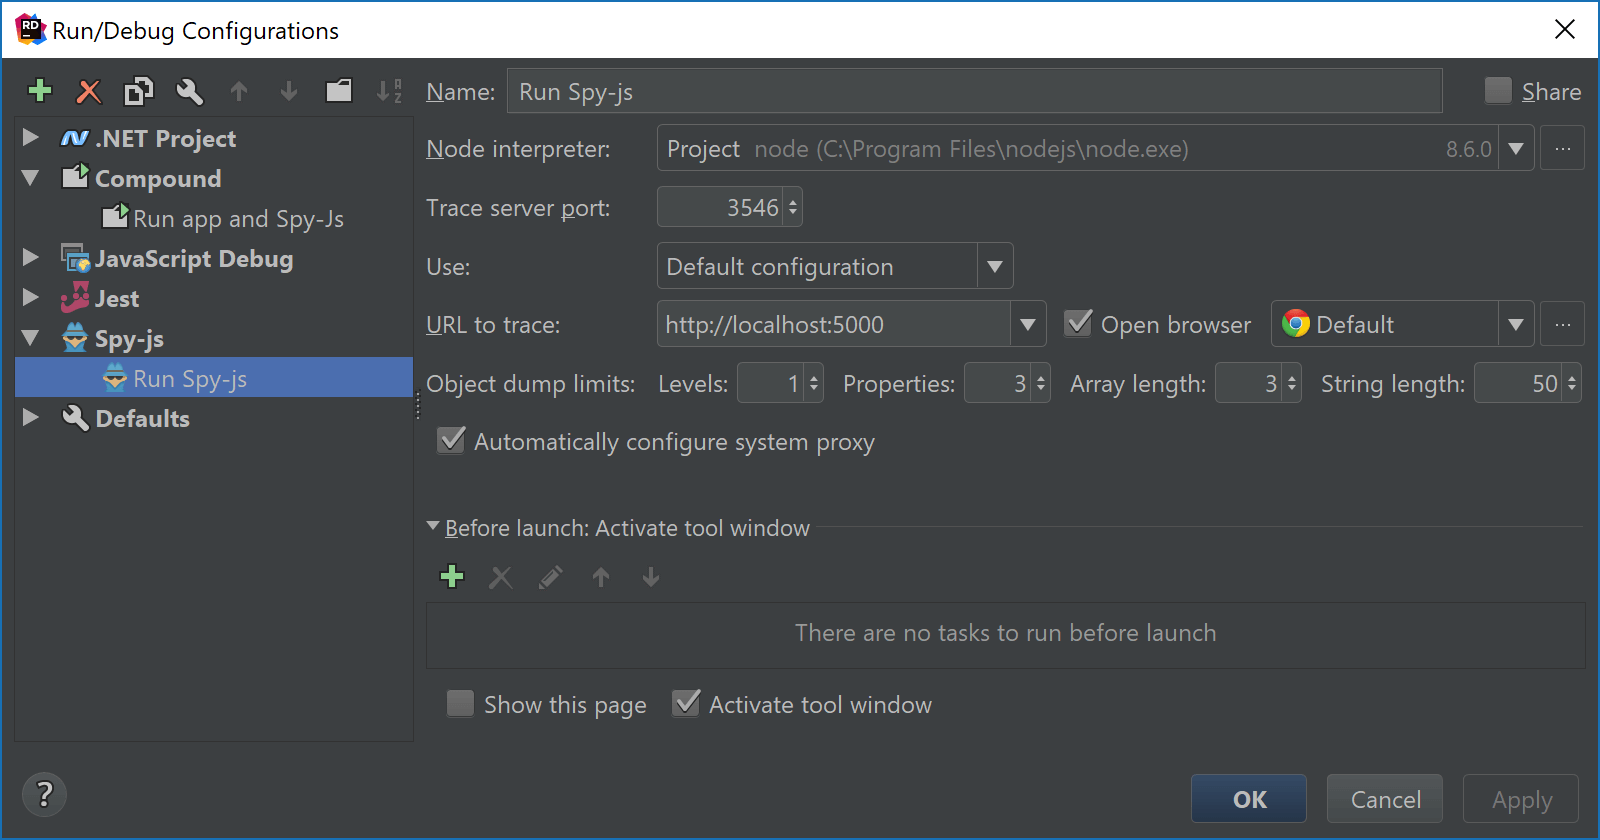
(Pro-tip: create a Compound Run/Debug configuration which starts both your web application as well as Spy-js)
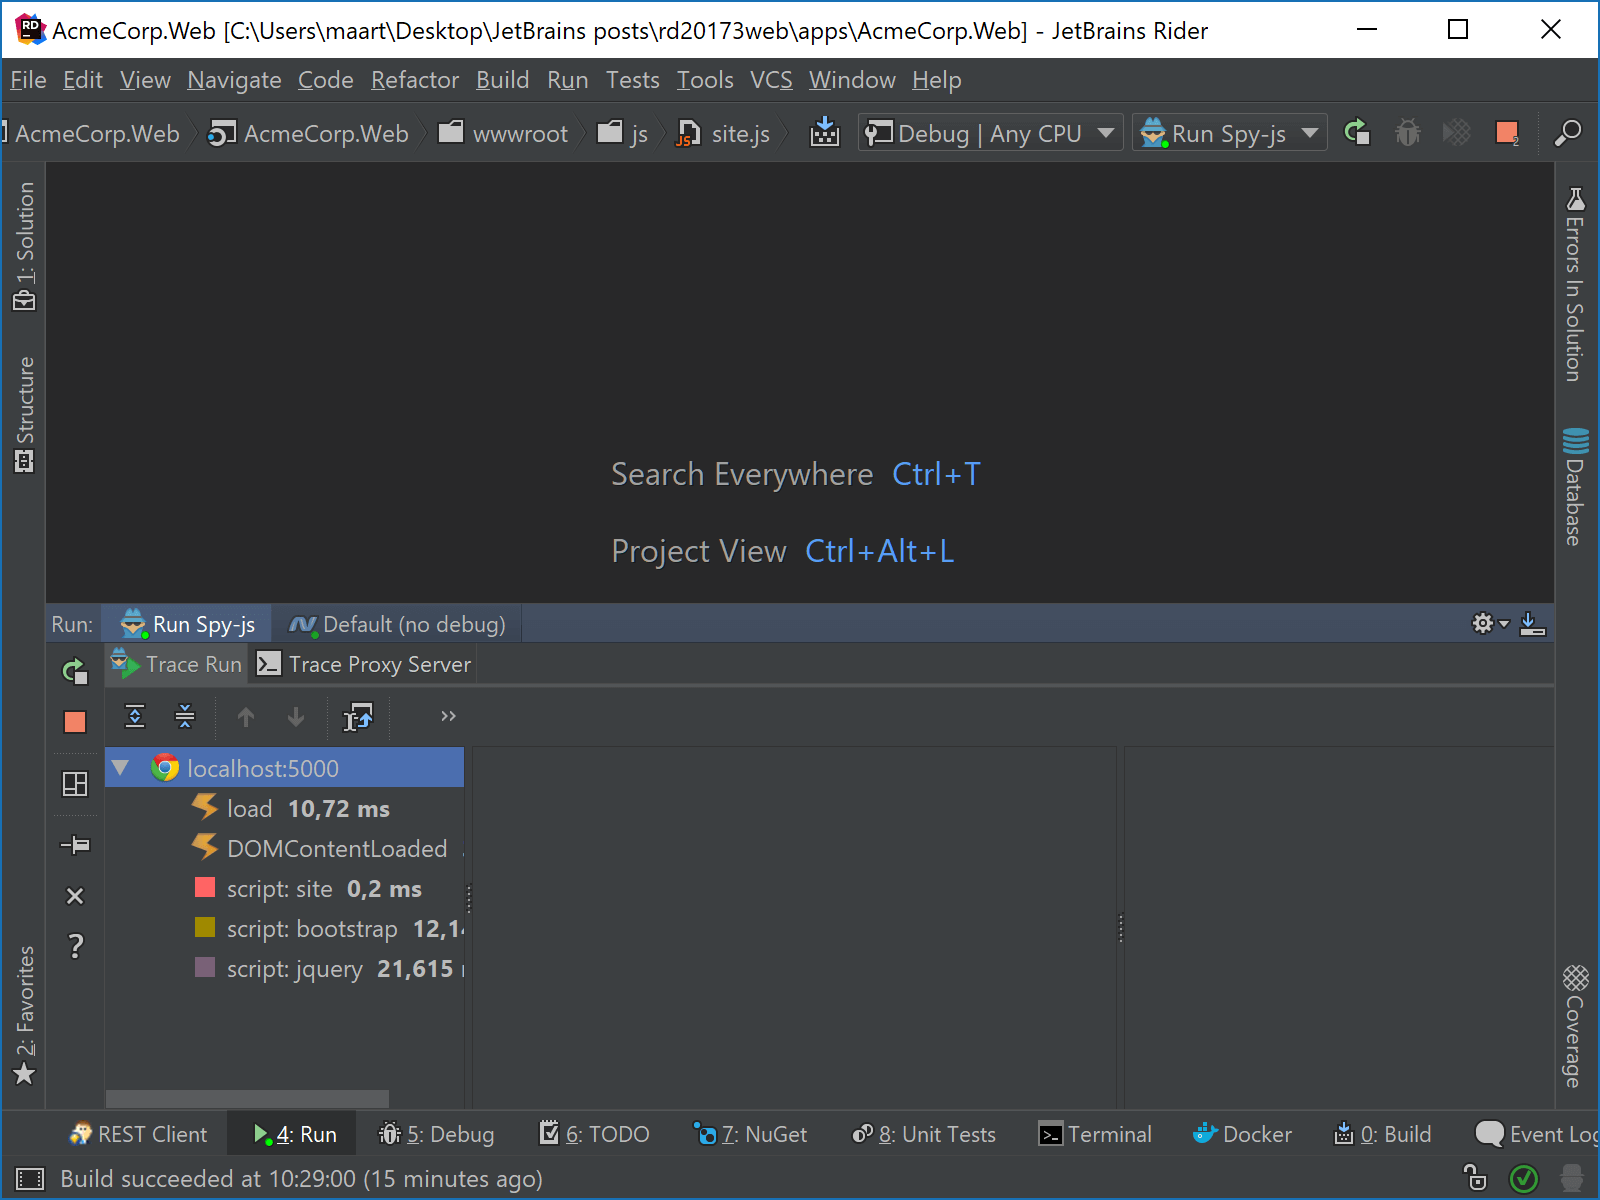
When we launch our application, Spy-js runs a proxy server (which by default is being auto-configured as your system proxy server). In its tool window, we can see three panes:
- Events (left) – Displaying page events coming through as they occur on the page. Captured events include not only DOM Events, but essentially any JavaScript code execution roots.
- Event Stack (center) – Displays the stack tree for an event selected on the left. It also includes execution timings for function calls. And if the execution time shows in bue, it means that specific call is responsible for more than 50% of the execution time of the expanded stack level.
- Variables (right) – Any captured variables at the time of execution. Which makes Spy-js a tool for retro-active debugging, too! What was the value of this parameter when this specific function call was made?
We can also double-click events in the stack to open up the editor (Rider will respect minified code and try to use source maps). We can see execution times in there as well, and see which parts of the code were executed as part of the function.
Do check the web help for more information on Spy-js, as well as an older blog post of mine that explains Spy-js in more detail.
What else is there?
In this series, we looked at two great web developer tools in Rider 2017.3: LiveEdit and Spy-JS. In our next post, we’ll cover two more tools: a new editor-based HTTP client and a preview panel for SVG editing.
Download Rider 2017.3 and give it a go! We’d love to hear your feedback!


