.NET Tools
Essential productivity kit for .NET and game developers
How does my app allocate to LOH? Find out with dotMemory 2018.2!
If you’re a long-term dotMemory user, you may have noticed the absence of big new features in dotMemory ever since we added support for memory dumps in 2017.2. Rest assured this is not because we’ve lost interest in memory profiling. The opposite is true: our team has been investing even more effort in this area, but most of the current changes are happening under the profiler’s hood.
One such changes is the way dotMemory collects and processes data in real time. This may lead to many new features in the future, but as of now, it has led to a couple of neat improvements. Both of them are related to the real-time memory usage diagram (the timeline) that you see during profiling.
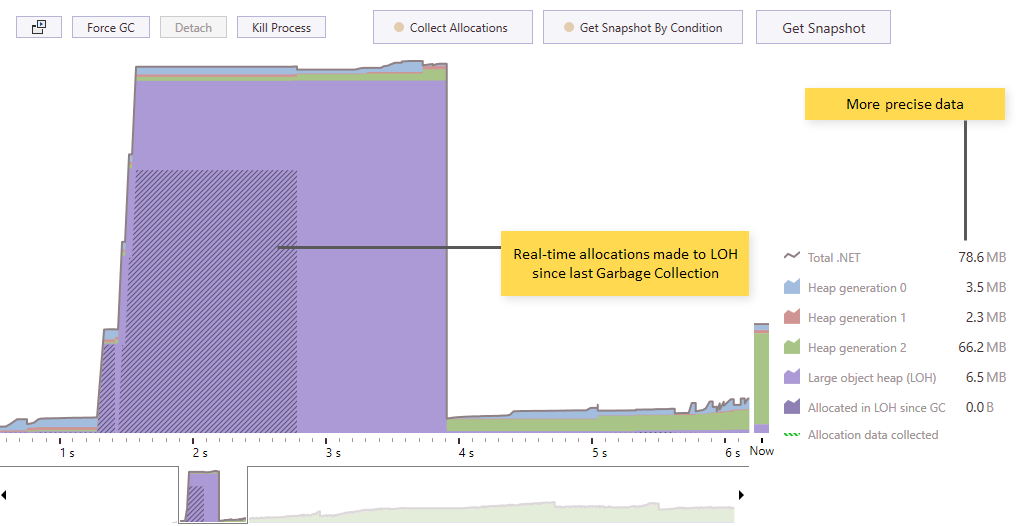
More precise data and support for all app types
First of all, we’ve stopped using Windows performance counters as a data provider and switched to Microsoft Profiling API. As a result, the timeline data are now more precise and do not differ from the data you see in a snapshot. But what is more important, the timeline is now available for all types of apps including .NET Core, ASP.NET Core, IIS-hosted web apps, Windows services, etc.
The “Allocated in LOH” chart
The second improvement is a new chart entitled Allocated in LOH since GC. It probably deserves a more detailed explanation.
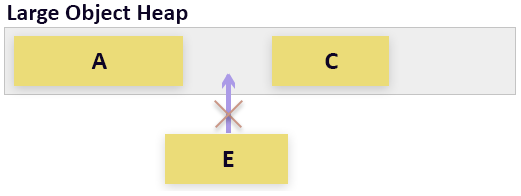
A brief reminder on what LOH is and why is it important: Large Object Heap (or LOH for short) is a separate segment of the managed heap used to store large objects. When an object is larger than 85 KB, CLR doesn’t allocate it to the Gen 0 Heap, but to the LOH instead.
For the sake of performance, LOH is never compacted (though you can force the garbage collector to compact LOH in .NET Framework 4.5.1 and later). As a result, LOH becomes fragmented over time. Another problem is that CLR collects unused objects from LOH only during full garbage collections. Thus, LOH objects can take space even if they are no longer used. All this leads to your app having a larger memory footprint (on x86 systems this may even result in OOM exceptions).

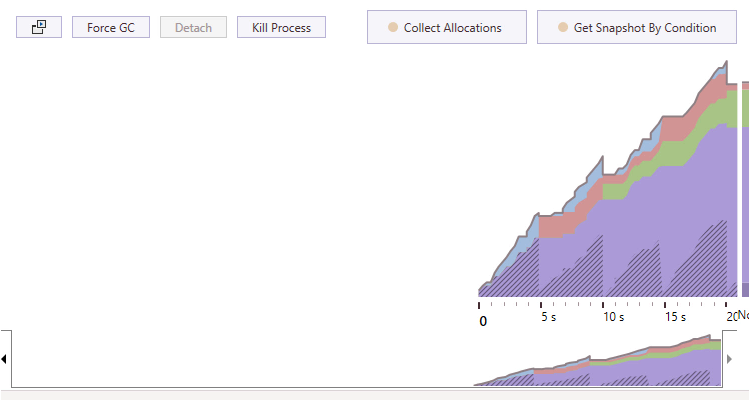
So, how does the improved timeline help you control LOH? In 2018.2, it shows you not only the size of LOH, but all allocations to LOH instantly as they happen. This helps understand when LOH allocations happen (on application startup, during some work, etc.) and how intense they are (e.g. you can have some significant LOH memory traffic that doesn’t change the LOH size).

On the GIF above, you see the Allocated in LOH chart (oblique hatching above the LOH size graph) of a simple application that constantly allocates large objects. Note that the chart shows you the size of objects that have been allocated in LOH since the last Garbage Collection. That’s why, after each GC, the graph restarts from zero.
Before you download the latest ReSharper Ultimate EAP and try the feature for yourself, we have one more small reminder about premature optimization. If you don’t see any evident problems with memory consumption, there’s nothing bad about your app allocating memory in LOH. In most cases, you can use the new Allocated in LOH chart simply to get a better understanding of how your app works.


