

.NET Tools
Essential productivity kit for .NET and game developers
Performance profiling .NET code in Rider with integrated dotTrace

Important! This post is about an old version of Rider. The profiling workflow is different since Rider 2018.3. Learn more
Rider 2018.2 was the first release to host one of our .NET tools, dotCover, together with its unit test coverage features. As we mentioned back then, this was just the beginning. Today, it’s performance profiling’s turn to be taken on board. We are proud of our first Rider release with an integrated performance profiler: JetBrains dotTrace is now part of the latest Rider 2018.3 EAP build!
In this introductory post, let’s take a look at the profiler’s capabilities, supported systems and frameworks, and licensing.
What operating systems and frameworks are supported?
As of EAP 03, we support the following operating systems and frameworks:
Operating systems:
- Windows: get and analyze performance snapshots
- Linux: not yet (planned)
- macOS: not yet (planned)
Frameworks:
- .NET Framework
- .NET Core
- Mono: not yet (planned)
- Mono (Unity): not yet (planned)
All of the above is relevant only for EAP 03. It’s likely (but not yet 100% certain) that you will see support for Linux, macOS, Mono, and Mono for Unity (a bit less likely) in future EAP releases and in the final 2018.3.
How will it be licensed?
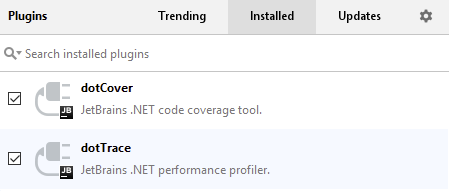
For now, we’re keeping the same policy for dotTrace as for the integrated dotCover tool. Using the profiler requires a license for either Rider + ReSharper Ultimate or the All Products Pack. Once you have it, the bundled dotTrace plugin is installed by default. Note that all EAP builds also have it.
How to profile (what features are already in Rider)
As usual, we prefer to go step by step. In this first step, we’re giving you all the basic functionality: getting performance snapshots, analyzing the call tree, and hot spots. Let’s take a closer look!
Configuring a profiling session
Profiling sessions must be configured via Rider run configurations:
- In the toolbar, select Edit Configurations… from the list of run configurations.
- In the opened Run/Debug Configurations window, select the Profiling Options tab.
- Specify the profiling type and other profiling options.
That’s it – you are ready to start profiling!
Starting a session and getting snapshots
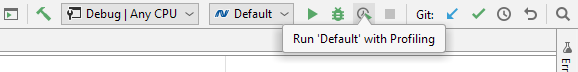
- To start profiling a run configuration, either select Run | Run ‘config_name’ with Profiling in the main menu or click the corresponding button on the toolbar.
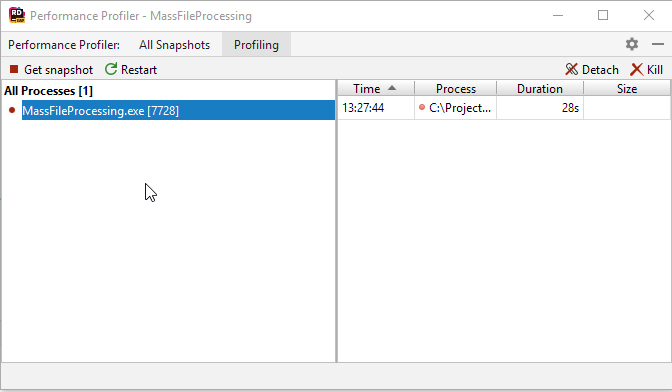
- Once the profiling starts, you will see the Performance Profiler tool window displayed on the Profiling tab, with the profiling controller inside. Reproduce the performance issue you’re looking to investigate, or get enough data on how your app works. Then, click Get Snapshot. The collected snapshot will be added to the list on the right. To start collecting data again, click Start Profiling.
- After you collect one or more snapshots, you may finish the profiling session. Normally, you do it either by closing the profiled application or by detaching the profiler via the Detach button. (Whereas Kill forcibly terminates the app and the session, so use it only in an emergency.)
Analyzing the snapshot
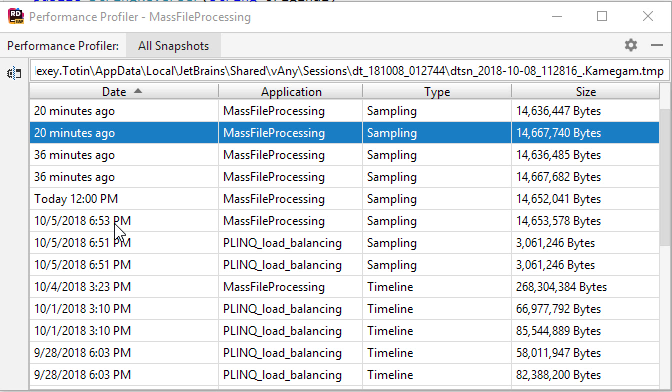
- On the All Snapshots tab of the Performance Profiler tool window, select the snapshot you want to analyze.
- Analyze the collected data using one of the available views:
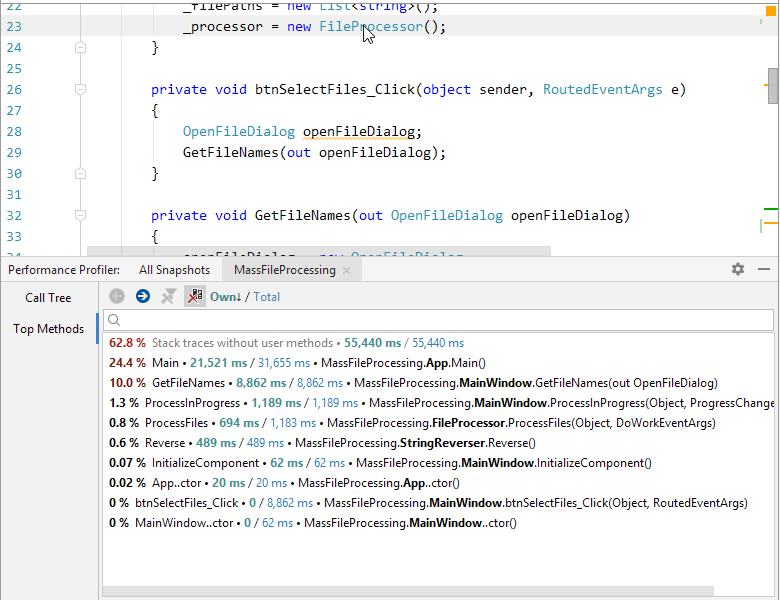
- Call Tree: a “classic” call tree that shows you all method calls in all threads. Each top-level node represents a top-level function which was executed by a certain thread. Use this view to quickly get down to actual application activity.
- Top Methods: the best place to start from when analyzing application performance. It is a plain list of methods with the highest execution time. Note that you can reduce the system functions “noise” by excluding them from the list using the
 toggle. When the toggle is enabled, each method’s execution time is calculated as a sum of the method’s own time and the time of all child system methods (down to the next user method in the stack).
IMPORTANT: dotTrace in Rider is able to take Timeline snapshots, but the integrated viewer will open them as regular (Sampling) snapshots. To get all of the benefits of Timeline profiling analysis (UI freezes, garbage collection, I/O operations, memory allocation, etc.), you should open the Timeline snapshots in the standalone version of dotTrace.
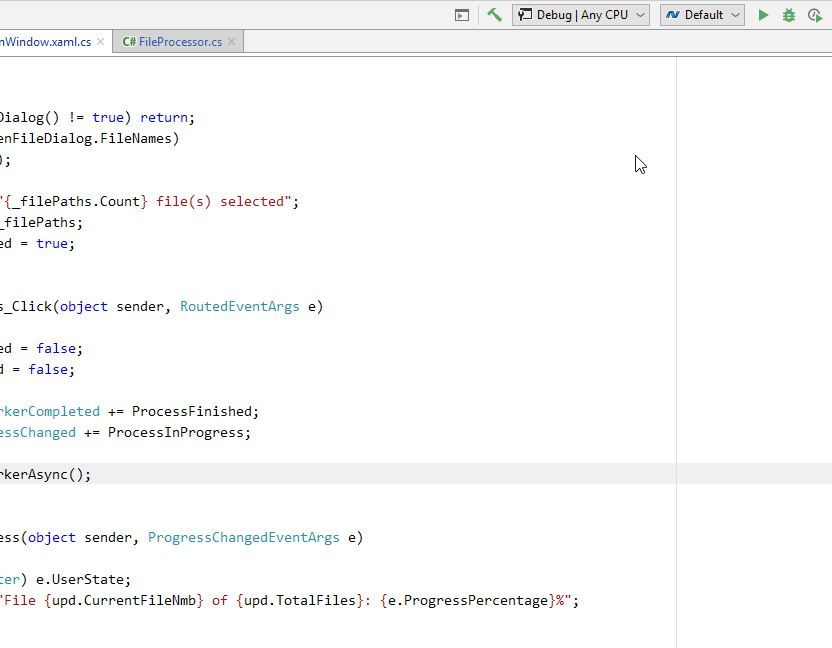
- Once the suspicious method is found, double-click it or press Enter. Rider will navigate you right to the method’s source code.
It’s also worth mentioning that the scope of Rider’s Search Everywhere feature (Ctrl+T in the Visual Studio layout) now includes the opened snapshot as well:
Download the latest Rider 2018.3 EAP and check out its profiling capabilities for yourself. And of course, we would be glad to hear what you think of it in the comments below!


