

.NET Tools
Essential productivity kit for .NET and game developers
Blank tool windows – ReSharper, Visual Studio 2019, .NET Framework 4.8 and Per-Monitor DPI Awareness

Late last month, .NET Framework 4.8 was released. It comes with several enhancements to support Per-Monitor V2 DPI Awareness (PMv2) and Mixed-Mode DPI hosting in both Windows Forms and Windows Presentation Foundation (WPF).
PMv2 makes it possible for controls to change their DPI dynamically. For example, when we move a window to a monitor with a different scale factor and DPI configuration, or when connecting to a remote desktop (RDP) session from a display with another DPI, we’ll see smooth and crisp rendering.
When using at least the Windows 10 April 2018 Update together with the latest version of .NET Framework 4.8, we can use Per-Monitor Awareness (PMA), which enables PMv2 and Mixed-Mode DPI, in Visual Studio 2019 to ensure our code and tool windows render properly on multi-monitor setups.
Unfortunately, sometimes tool windows do not render correctly when its Per-Monitor Awareness (PMA) setting is enabled – including ReSharper’s tool windows.
What is the workaround?
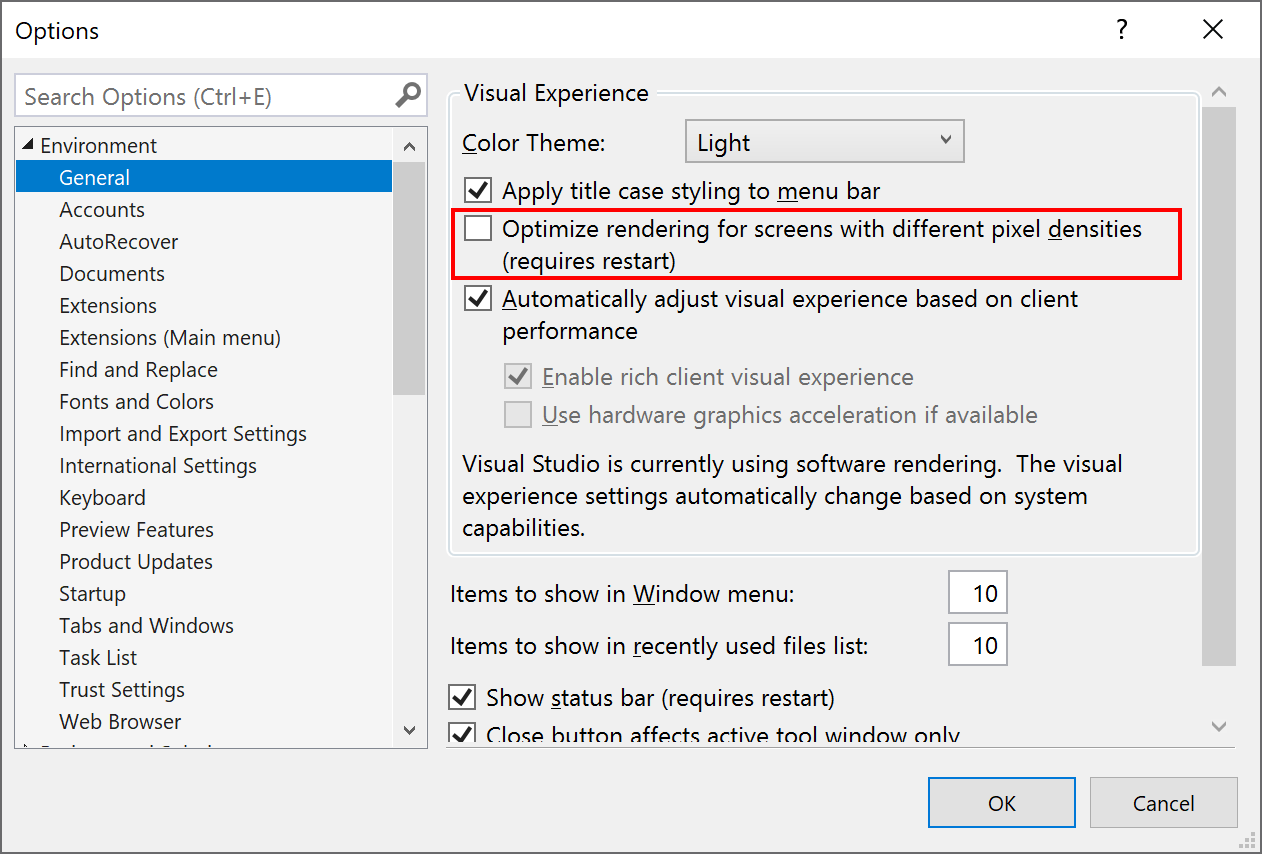
If you are experiencing sporadic blank ReSharper tool windows (e.g. the test runner tool window or find usages) or are seeing blank tool windows for other Visual Studio extensions, make sure to disable Per-Monitor Awareness (PMA) by unchecking Optimize rendering for screens with different pixel densities via Tools | Options, then Environment | General.
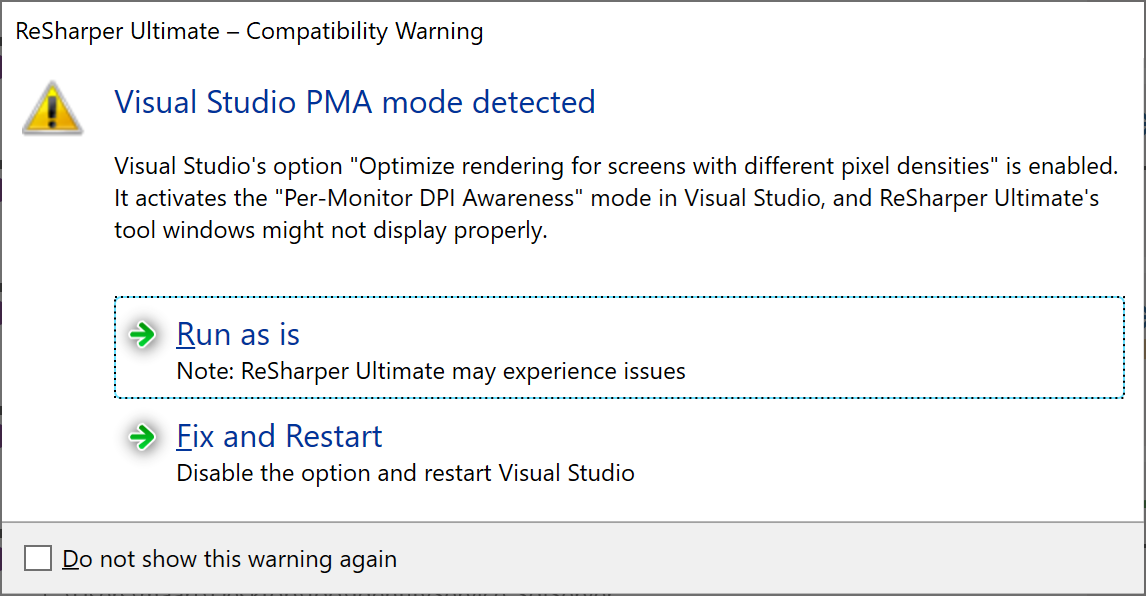
This workaround will also be suggested by ReSharper when Visual Studio 2019 and .NET Framework 4.8 is installed, and PMA is enabled:
Is this going to be fixed?
Yes! We realize this is a workaround, and are working on a fix so that PMA can be enabled again. Follow this issue to stay informed on the status of the upcoming fix.
What is the underlying issue?
Good question! Many tool windows in Visual Studio are implemented as Windows Forms controls or WPF controls, and hosted in the IDE’s window and process. Before Visual Studio 2019, .NET Framework 4.8 and the corresponding changes in Windows 10, the IDE would be system DPI aware. This means that typically, Visual Studio (and all of its windows and controls) would render with the DPI settings of the primary connected monitor at the moment it was started, often resulting in blurry rendering.
With PMv2, each top-level window can have its own DPI and will render smoothly, via the concept of the DPI-awareness context and the SetThreadDpiAwarenessContext API.
This DPI awareness context can be:
- DPI unaware – the window does not scale for DPI changes and is always assumed to have a scale factor of 100% (96 DPI). Rendering could look blurry.
- System DPI aware – the window does not scale for DPI changes and queries for the DPI once and uses that value for the lifetime of the process. Rendering could look blurry.
- Per-monitor DPI aware (PM and PMv2) – the window checks for the DPI when it is created, and adjusts the scale factor whenever the DPI changes afterwards. Rendering will happen in true pixels and looks smooth.
When enabling Per-Monitor Awareness (PMA) in Visual Studio, this last context is applied. It also sets the DPI_HOSTING_BEHAVIOR to DPI_HOSTING_BEHAVIOR_MIXED, via the SetThreadDpiHostingBehavior API. This setting allows pieces of UI from different Visual Studio extensions to have a different DPI awareness context, with different responses to DPI changes. Some controls will follow the dynamic DPI and render crisp, some will be DPI unaware or system DPI aware and render blurry.
The general idea here is that Visual Studio extensions that are not PMA-ready (and do not support dynamic DPI) render like before. Blurry, in some cases, but visible and usable.
So far, so good! Unfortunately, it’s impossible to have a child control with DPI_AWARENESS_CONTEXT_PER_MONITOR_AWARE_V2 hosted in a parent control that has DPI_AWARENESS_CONTEXT_SYSTEM_AWARE. In this case, nothing will be rendered. In other words, a child control cannot be more DPI-aware than its parent or it will render blank.
This should not be an issue, right? Well, it is in ReSharper’s case. ReSharper creates most of its controls in a deferred manner, creating our UI in an asynchronous way without having to block the UI for long.
Remember the DPI awareness context is per thread? And that it can be changed at any time? This means that ReSharper may start building its UI in an asynchronous manner in one mode (for example PMv2), and Visual Studio may set the mode to system DPI awareness context when it creates the tool window frame. Now, what happens if ReSharper tries to host that PMv2 control in the now system DPI tool window frame? Exactly: this is not allowed, and will render blank.
Is this unique to ReSharper and Visual Studio? No. Any tool window (whether included in Visual Studio 2019 or provided by a third-party extension like ReSharper) may sporadically render blank if it uses the same technique.
There are several approaches for us to avoid blank tool windows from happening. One approach would be to ensure all of our controls are always created in the system DPI awareness context. However, this means we would also see blurry tool windows across ReSharper. Not ideal…
Another approach is to declare our extension as PMv2 ready. This will prevent Visual Studio 2019 from switching into the system DPI awareness context when creating tool window frames for us, so they don’t render blank. However, this means all of our controls have to properly support dynamic DPI changes, which is what we intend to ship with the next ReSharper bugfix release.
Want to stay informed? Subscribe to this issue to keep track of the status of our upcoming fix. Install the Toolbox app to receive updates to ReSharper.


