.NET Tools
Essential productivity kit for .NET and game developers
Debugger additions for Rider 2019.2: Pin to Top, Floating Actions, and Redesigned Stack Frames
When analyzing and fixing bugs, debugging is essential. Rider already ships with a lot of helpful debugging features, like smart-step-into, tooltip evaluation or thread-specific breakpoints. In version 2019.2, we improved performance for stack calculation and stepping a lot. Also, we’ve fixed reported issues for ref/out value evaluation and cast evaluation. However, besides those internal changes, we’re excited to show you some of the new UI related additions that can help to debug our codebases more efficiently:
- Pin to top to show info we’re interested in first
- Floating actions to easily jump to a specific statement
- Redesigned threads and stack frames
Let’s start with how we look at our data.
Pin to top
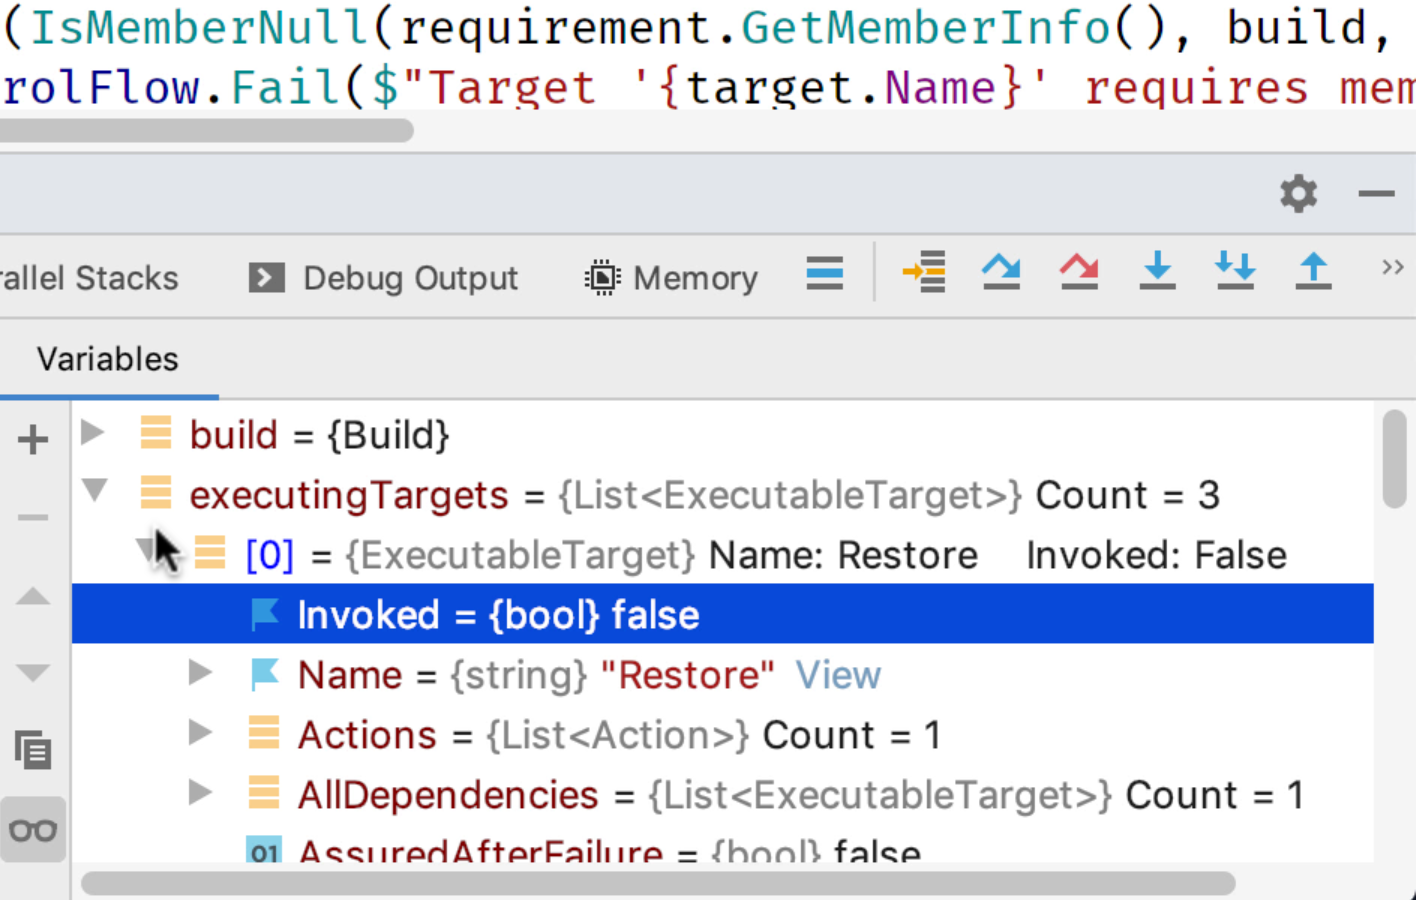
Some might already be familiar with how the presentation of an object can be controlled by overwriting the ToString method or adding a DebuggerDisplayAttribute. However, sometimes this can become a bit cumbersome, especially when we’re only looking at those objects once in a while. So why design your code to be debug-friendly when you have a debug-friendly IDE? The Pin to top action comes in handy, most of all with collections of objects:

We can think of it as an on-the-fly adaptation of the presentation, which is also persisted over multiple debug sessions signalled by a little flag icon. The flagged information is pinned to top. It’s also worth mentioning that after expanding large lists for types that have pinned data, we can just start typing to find an object with the search term we’re looking for.
Floating actions
Rider really makes it easy to work keyboard-centric. That’s why all the debug actions have a default shortcut assigned. However, debugging is one of those techniques that can force even the hard-boiled developers to actually use the mouse. For instance, to inspect object structures, change the thread view or navigate around parallel stacks.
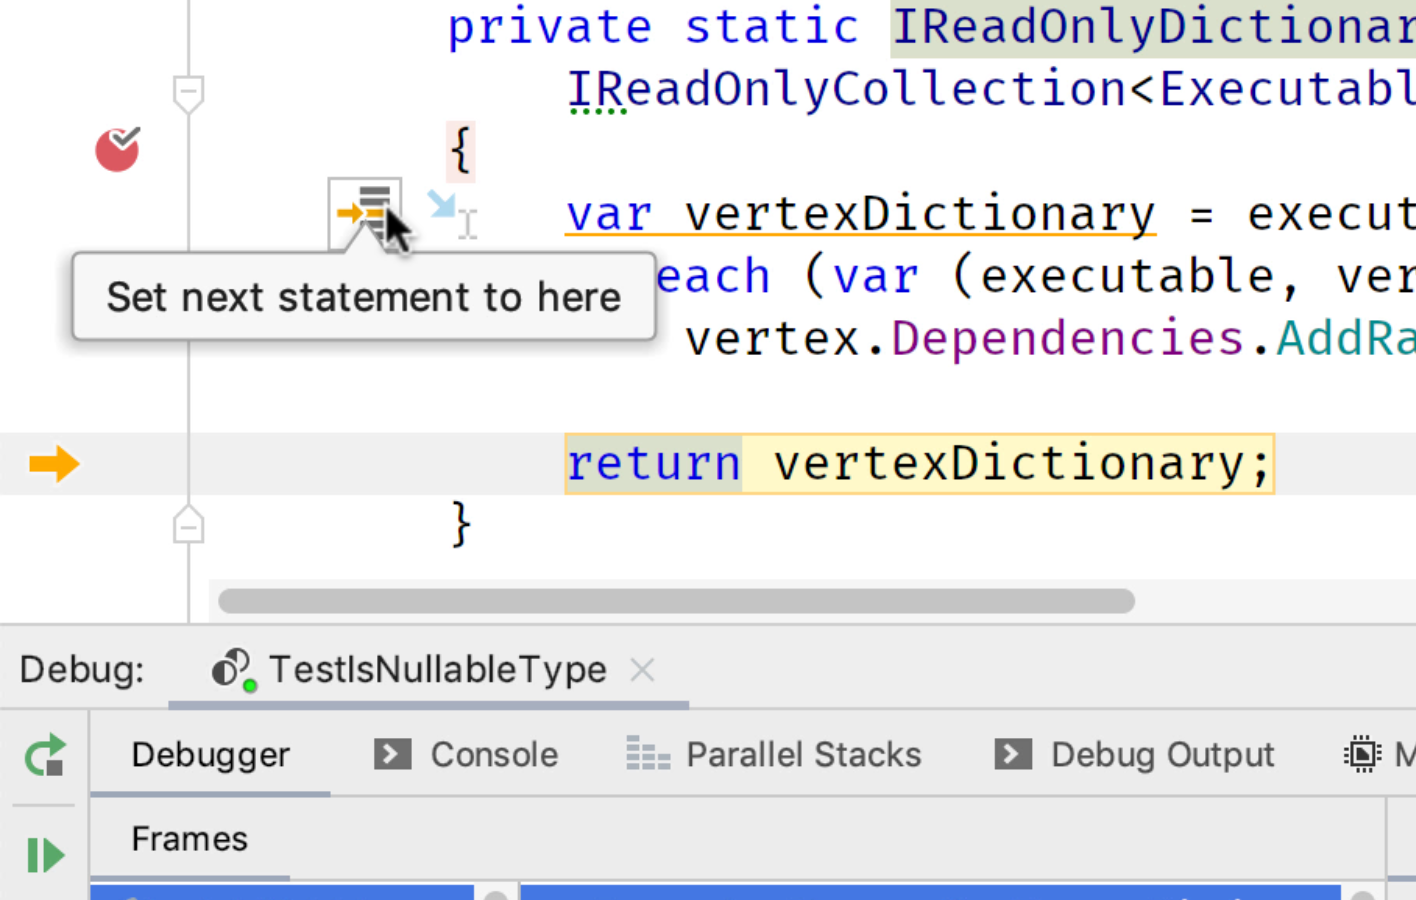
Two of the more common actions – Jump to statement and Set next statement – are now available as floating actions right from inside the editor region, right beside statements:

In conjunction with the smart-step-into action, this makes it really convenient to narrow down what our code is actually doing.
Redesigned threads and stack frames
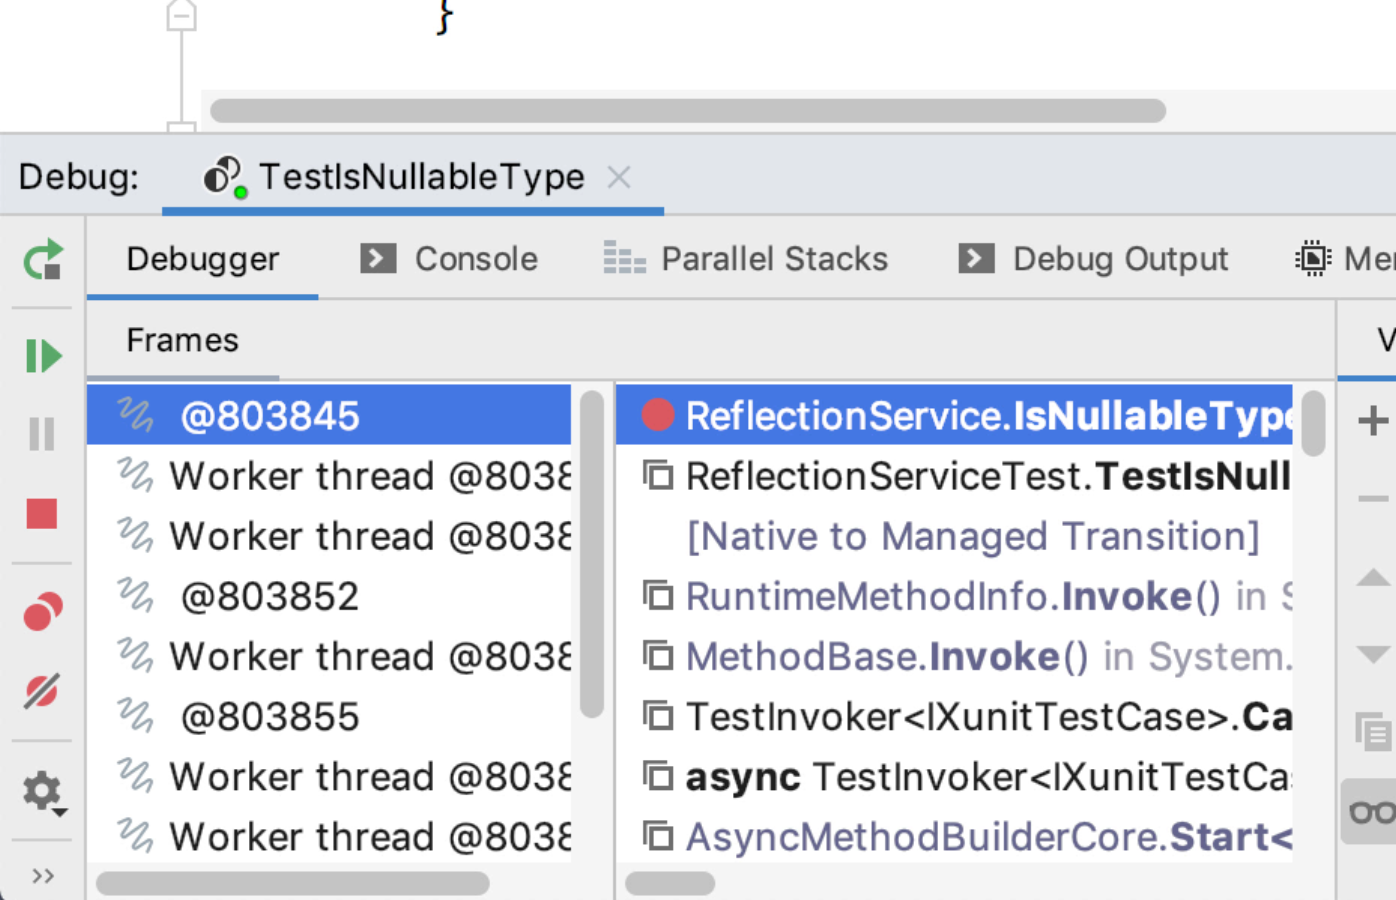
Another improvement is the redesigned view for threads and stack frames (disabled by default). If you are a developer working with multi-threaded applications, you might be interested to opt-in to this by enabling the debugger.new.frames.view option in the registry. This will allow us to choose a thread on the left, then select frames from the middle, and browse related variables on the right:

We’re looking forward to your feedback about our recent debugger improvements. Download Rider 2019.2 now, and give it a try!


