.NET Tools
Essential productivity kit for .NET and game developers
How to Debug Hangs Using the dotTrace Performance Profiler

 This is a guest blog post from Michael Shpilt. Michael has been developing software for over 20 years. He owns the popular blog michaelscodingspot.com and recently published the book Practical Debugging for .NET Developers. In his day job, he works at OzCode, a company dedicated to improving debugging in .NET.
Program hangs are some of the worst possible things you can have. They are terrible in both desktop and web applications. With desktop applications, your window freezes and the app becomes unresponsive and basically useless. This is unpleasant for technical users like us programmers, but I imagine it’s awful for regular users. In a web application, when a hang occurs, your request remains stuck without ever returning. When more similar requests get stuck, the application eventually slows down to a crawl. Requests might start to fail altogether until the web server restarts and this evil cycle starts all over again.
I hope you won’t ever have to experience hangs, especially in production, but chances are that you will. And in the event that you do, you’ll need to know how to deal with them. In this article, we’ll see one of the best methodologies for debugging hangs. We’ll see how to use a performance profiler like dotTrace to find the root cause of the hang and fix it. There are many advantages to this, but first, let’s talk about the traditional way to debug hangs.
Debugging hangs the traditional way
The usual recommended way to debug hangs involves using dump files or attaching to a hung process with a debugger. When in production, you don’t usually have the debugger installed, so you capture a dump instead, copy it to a development machine, and debug it there. It’s recommended to capture two or three consecutive dump files, a few seconds apart, and compare them. Just by looking at the threads and the call stacks, you’ll be able to figure out which threads are stuck. The threads that stay with the same call stack are probably the hung threads.
It’s very likely though that more than one thread is hung and you’re in a deadlock situation. That’s a case of two or more threads being stuck because they’re waiting for each other. Sounds strange, but it can happen more easily than you might think. That’s why, whenever you’re looking at hang dumps, keep an eye out for methods that indicate a deadlock. Those are usually methods that end in .WaitOne(), .Wait(), Monitor.Enter(), or WaitAll().
Deadlocks are not the only reason for hangs, of course. The cause might be an infinite calculation, a very long I/O operation, or something else entirely.
By the way, if you’re dealing with a desktop application, always look in the UI thread. If the window is frozen, then invariably the UI thread is frozen.
When the Traditional Ways Fail
When debugging a scenario, it’s best to know more than one way to extract information. In some cases, some techniques are impossible to use, or they might not reveal all the information. As it happens, using dump files can be very tricky in some cases. Consider the following code:
private void A()
{
    Thread.Sleep(100);
    Dispatcher.CurrentDispatcher.BeginInvoke((Action)(() => B()));
}

private void B()
{
    Thread.Sleep(100);
    Dispatcher.CurrentDispatcher.BeginInvoke((Action)(() => A()));
}
This snippet is taken from a WPF application, and it causes a sort of infinite calculation. The methods A and B call each other indefinitely.
When using BeginInvoke, the call stack restarts from the Dispatcher thread (the UI thread). That means it omits the methods that were called beforehand. So when this infinite calculation starts, you’ll see dump files where the call stacks show either method A() or method B() intermittently. This makes it very hard to understand the nature of the problem because the call stacks won’t show the same method as stuck. Here, dotTrace comes to the rescue.
Using a performance profiler to debug hangs
When using a performance profiler, you can record a short snapshot during the hang. The snapshot will show how much execution time was spent in each method. This means dotTrace can show the hung methods without looking at call stacks, dealing with dump files, and doing any sort of guesswork.
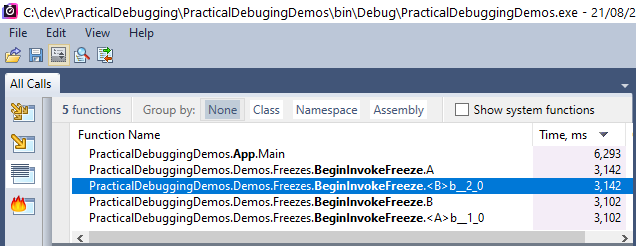
dotTrace’s "Plain list" view shows all the methods that were called during the recording. As you can see, summing the duration of both call stacks, 3142ms + 3102ms, amounts to almost the entire recording time of 6293ms. Note that the methods <B>b__2_0 and <A>b__1_0 represent lambda functions.
There were a few times at my own job when I was able to figure out a hang by using dotTrace. Here’s a snapshot of a hang I encountered when working on the OzCode extension:
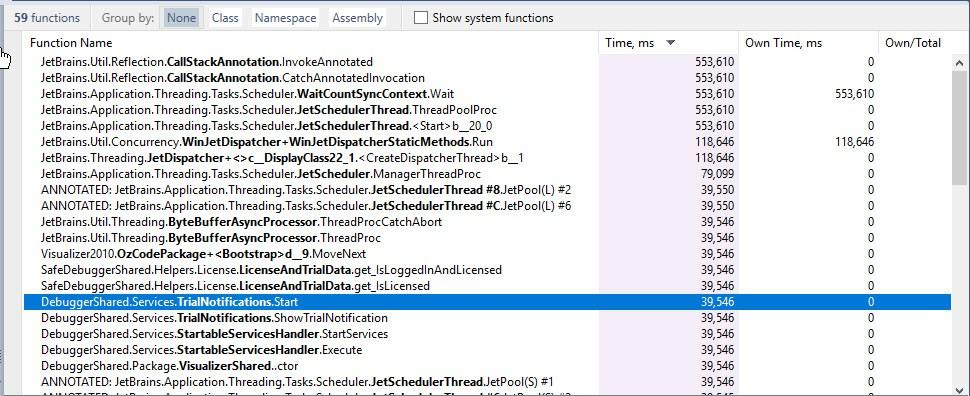
I was able to see with dotTrace that some of the methods took 40 seconds—the entire recording time. Those are the methods that are in the call stack of the stuck threads. I happen to know that in this case, TrialNotification.Start() is in a deadlock. Once I discovered which method was in the hang’s call stack, I was able to use dotTrace to show the call stack tree and to find the exact methods that caused the deadlock.
You might notice that other methods are a multiplication of that time, which means they were in the call stack of multiple threads that were running during the recording. For example, the method JetScheduler.ManagerThreadProc, which lasted about 80 seconds, was in the call stack of two threads during the recording.
Pitfalls of debugging hangs with dotTrace
A performance profiler will display the execution time of all methods executed in the recording. If a method was executed in two threads in parallel, it will count as twice the time. This is well seen in the previous screenshot with the method JetScheduler.ManagerThreadProc, and it means that you cannot fully trust a single method’s execution time. For example, if a recording of a hang lasted 10 seconds and a method’s execution time was also 10 seconds, it is possible that this method wasn’t hung. It might have just been executed in multiple threads.
This issue is even more meaningful in web servers where each request executes in a different thread. It’s very possible that you have similar requests during the recording, all of which call the same methods and execute in parallel.
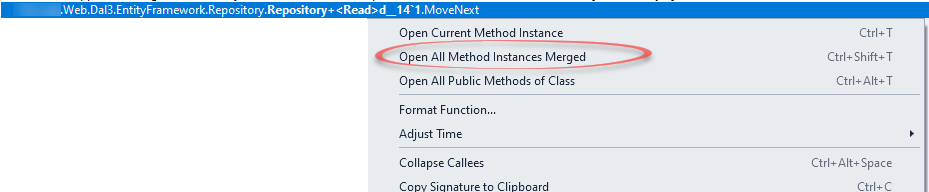
There is a simple way to figure out whether this is the case, however. When going over a list of methods in dotTrace, select the suspect method and open it in a new instance. This will narrow the recording just to the call stacks that include the selected method.
Now if you move to the "Back Traces" view, you’ll be able to see where this method was called from. The important thing to look at is the number of threads calling it. For example, in the following case, the method Read is called from three different threads: #29, #32, and #12.
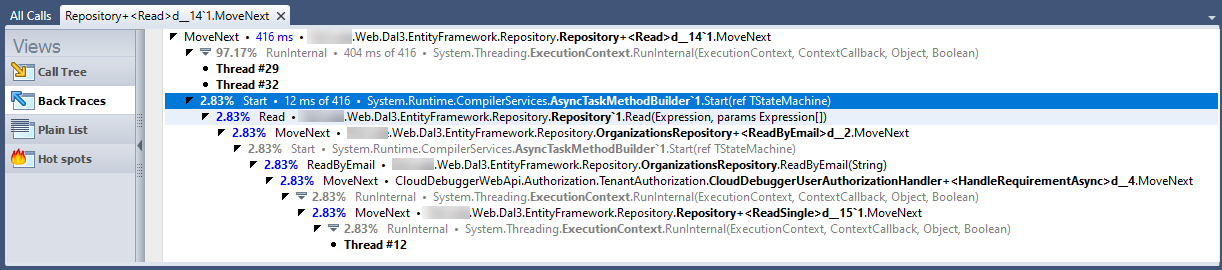
So, if a method took the entire recording time, and it was called in a single thread, then it must be one of the hung threads.
Debugging hangs in production
Hangs are usually an issue you’ll have to deal with in production. Installing an application like dotTrace on your application server might not be something you want. Here are some alternatives:
-
dotTrace has a lightweight console tool that’s able to capture snapshots. After capturing a snapshot, copy it to a development machine, open it with dotTrace and investigate. The following command will attach the profiler, record a snapshot, and detach after 5 minutes.
ConsoleProfiler.exe attach 1234 --save-to=snapshot.dtp --timeout=5mThis option recently became available for Linux machines as well.
- You can do remote profiling with dotTrace. This requires you to install an agent on the production machine as described in the documentation.
- If you’re running on Linux, you can install Rider with the dotTrace plugin. The JetBrains .NET Guide has a tutorial that covers performance and memory profiling options in Rider.
Conclusion
I hope I was able to show you that performance profilers like dotTrace provide one of the most powerful ways to debug hang situations. This particular method has helped me on several occasions. Debugging effectively very much depends on your knowledge of tools and methodologies. Knowing the right tool and how to use it allows you to extract the most information. And getting the correct information means you’ll quickly be able to find the root cause of the issue and fix the problem.
To see more expert ways to debug in .NET, check out my new book: Practical Debugging for .NET Developers, where I show how to debug production code, memory issues, performance problems, hangs, crashes, and more.