.NET Tools
Essential productivity kit for .NET and game developers
.NET Tools
Releases

The v2021.2 Releases for dotCover, dotMemory, dotTrace, and dotPeek Are Here!
Good news, everyone!
We are happy to announce the release of the 2021.2 versions of dotCover, dotMemory, dotTrace, and dotPeek.
Before diving into the feature set we’ve added in this release, there are a couple of important notes:
- Starting with the 2021.2 release of our .NET productivity tools, including dotCover, dotMemory, dotTrace, and dotPeek, we will require .NET Framework 4.7.2 or newer to be installed on your machine. Learn more here.
- We have changed the free trial period model for dotTrace and dotMemory from 5 days of actual use to 30 calendar days, which is the standard for all JetBrains individual tools.
dotMemory 2021.2
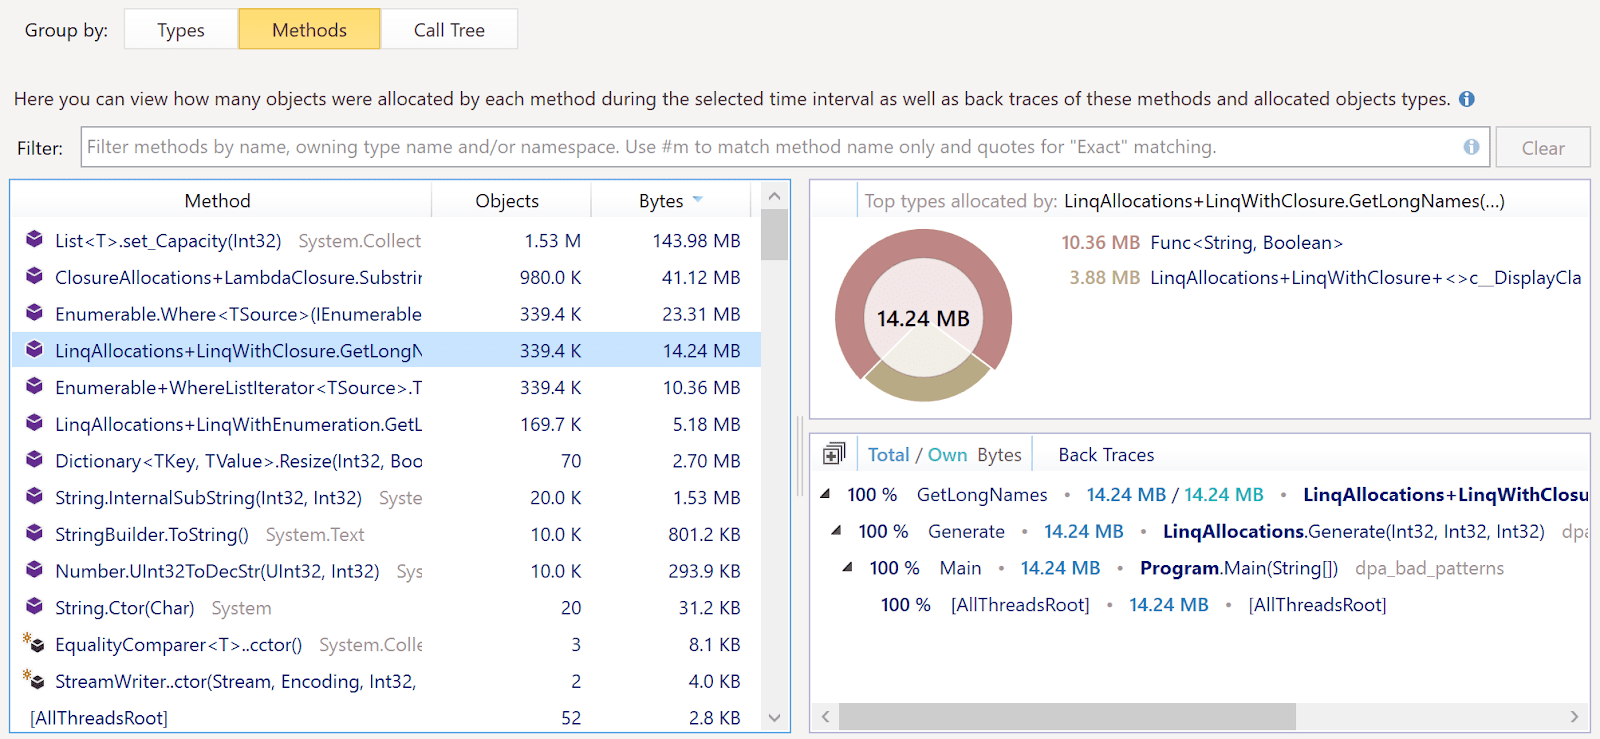
- We’ve continued to improve how you can analyze memory allocation. Two new tabs, Methods and Call Tree, have been added to the Memory Allocation view.
- The view filters search bar at the top of dotMemory views is now more flexible and easier to use.
- The Export objects action has more settings you can adjust..
- It’s now possible to use service messages to enable and disable the collection of memory allocation data in the console profiler.
dotCover 2021.2
- The dotCover console runner is able to collect coverage information for individual tests and show it in the generated reports.
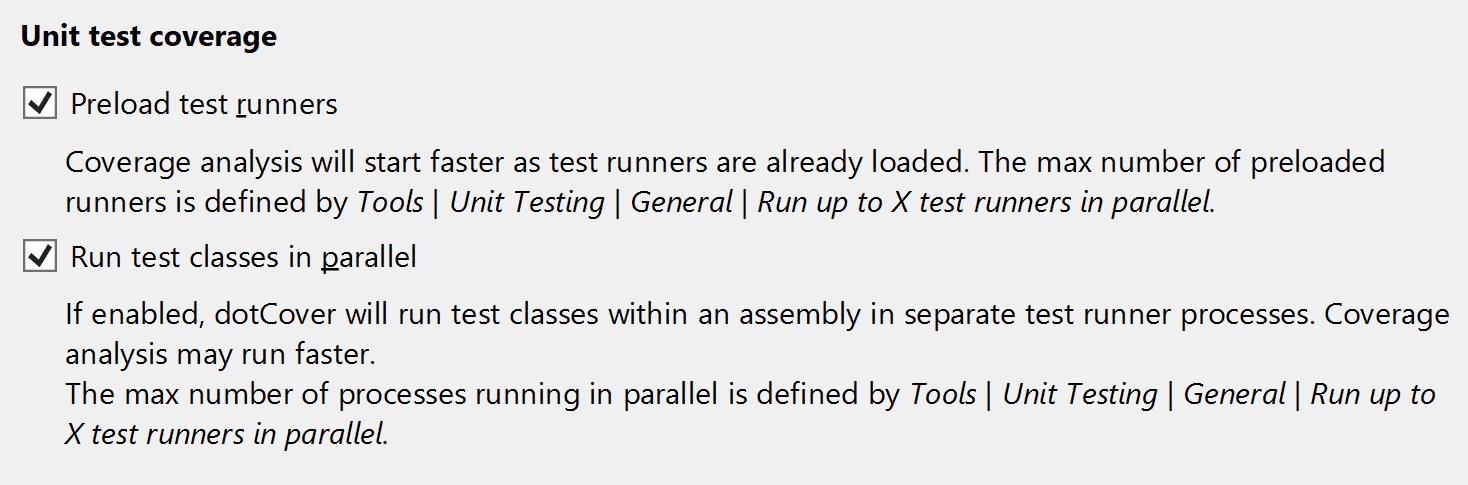
- dotCover can run coverage analysis of test classes in parallel within an assembly. In certain scenarios, this can result in faster coverage analysis.
- Unit test runners can now be preloaded for .NET Core and .NET projects.
- We’ve improved support for C# 8.0 and C# 9.0 in the coverage tree (showing default interface implementations and more).
- dotCover will offer to restart the Unity Editor when coverage filters are changed.
dotTrace 2021.2
- It’s now possible to profile native applications on Windows. When starting a profiling session, you have the option to download native source symbol files from remote servers. Native profiling is only available for the Timeline profiling type.
- You can now profile .NET Core and .NET applications on macOS and Linux using the Timeline profiling type in a command line profiler or JetBrains Rider.
dotPeek 2021.2
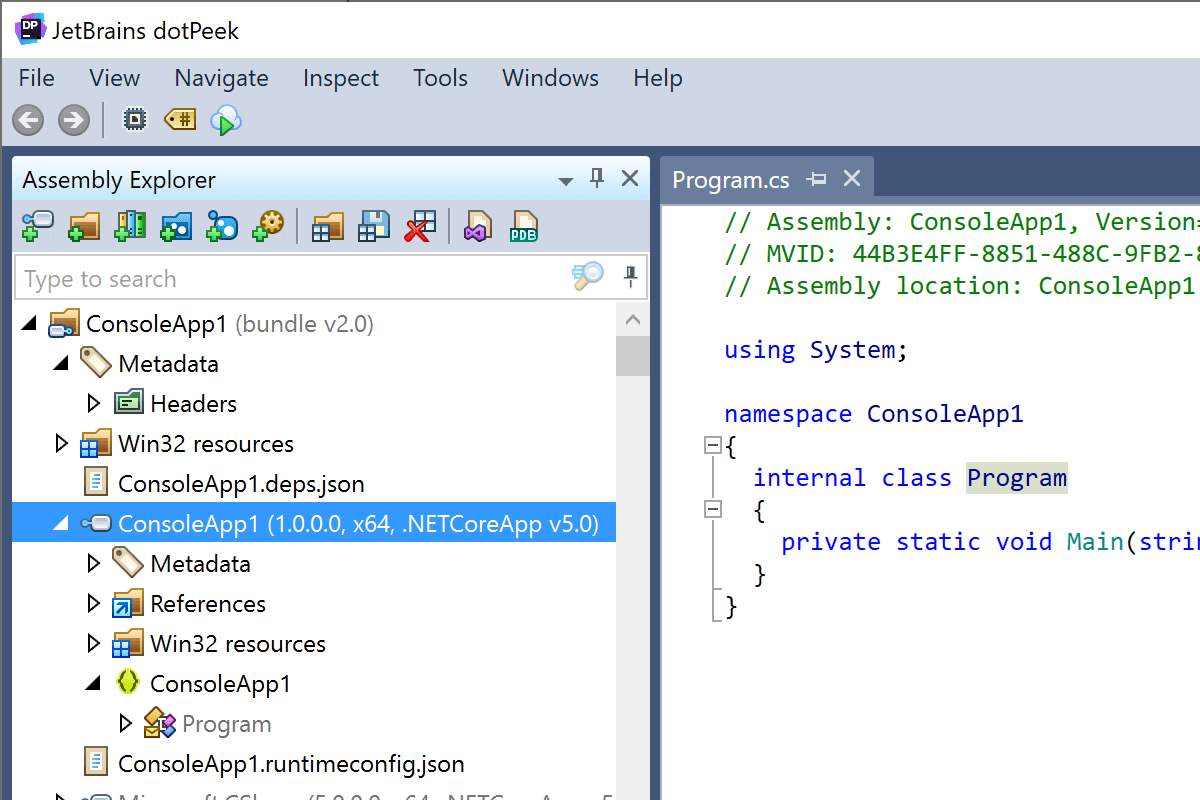
Now dotPeek can decompile single-file apps. It also lets you browse through bundled assemblies inside a single-file app, just like you are used to doing. It supports single-file formats for the .NET Core 3.1, .NET 5, and the upcoming .NET 6 SDKs.
You can install the tools from www.jetbrains.com or via the Toolbox App.
Prev post ReSharper 2021.2: Updates to C# Code Analysis, Nullable Reference Types, and Source Generators and Introducing HttpClient URI Support!Rider 2021.2: Support for ASP.NET Core Endpoints, Blazor WebAssembly Debugging, and More Next post