.NET Tools
Essential productivity kit for .NET and game developers
Profiling Native Apps in dotTrace

dotTrace has long been our go to tool for performance profiling, helping you diagnose bottlenecks and performance problems in all types of managed code. In the 2021.2 release, we now support profiling native applications in Windows.
This is an extension of the work we’ve done with Timeline profiling, which can include native and system call information. We’ve made the changes to launch and connect to native Windows applications, either from the standalone Home window, the dotTrace plugin for Visual Studio and ReSharper and also from the Rider plugin. Let’s take a look at how to get going.
dotTrace has several different types of profiling – Timeline, Sampling, Tracing and Line-by-line. They have different characteristics; line by line and tracing require the runtime to notify us for each line or function entry/exit, and this adds overhead and distorts logged execution time. Sampling has less overhead, so is faster and more accurate with execution time, but can miss small or inlined functions, and doesn’t collect call counts.
Timeline is the most general, and works in a slightly different way to the others. It collects both native and managed information, including different user and kernel events, managed and native calls, system calls, HTTP requests, SQL, and so on. It also allows processing the results in a very different way, zooming in on a specific time slice and filtering based on event type, as well as method and threads (you can read more on Timeline profiling here). Based on this, we’ve extended Timeline to allow launching and attaching to native applications as well as managed applications.
Profiling native apps
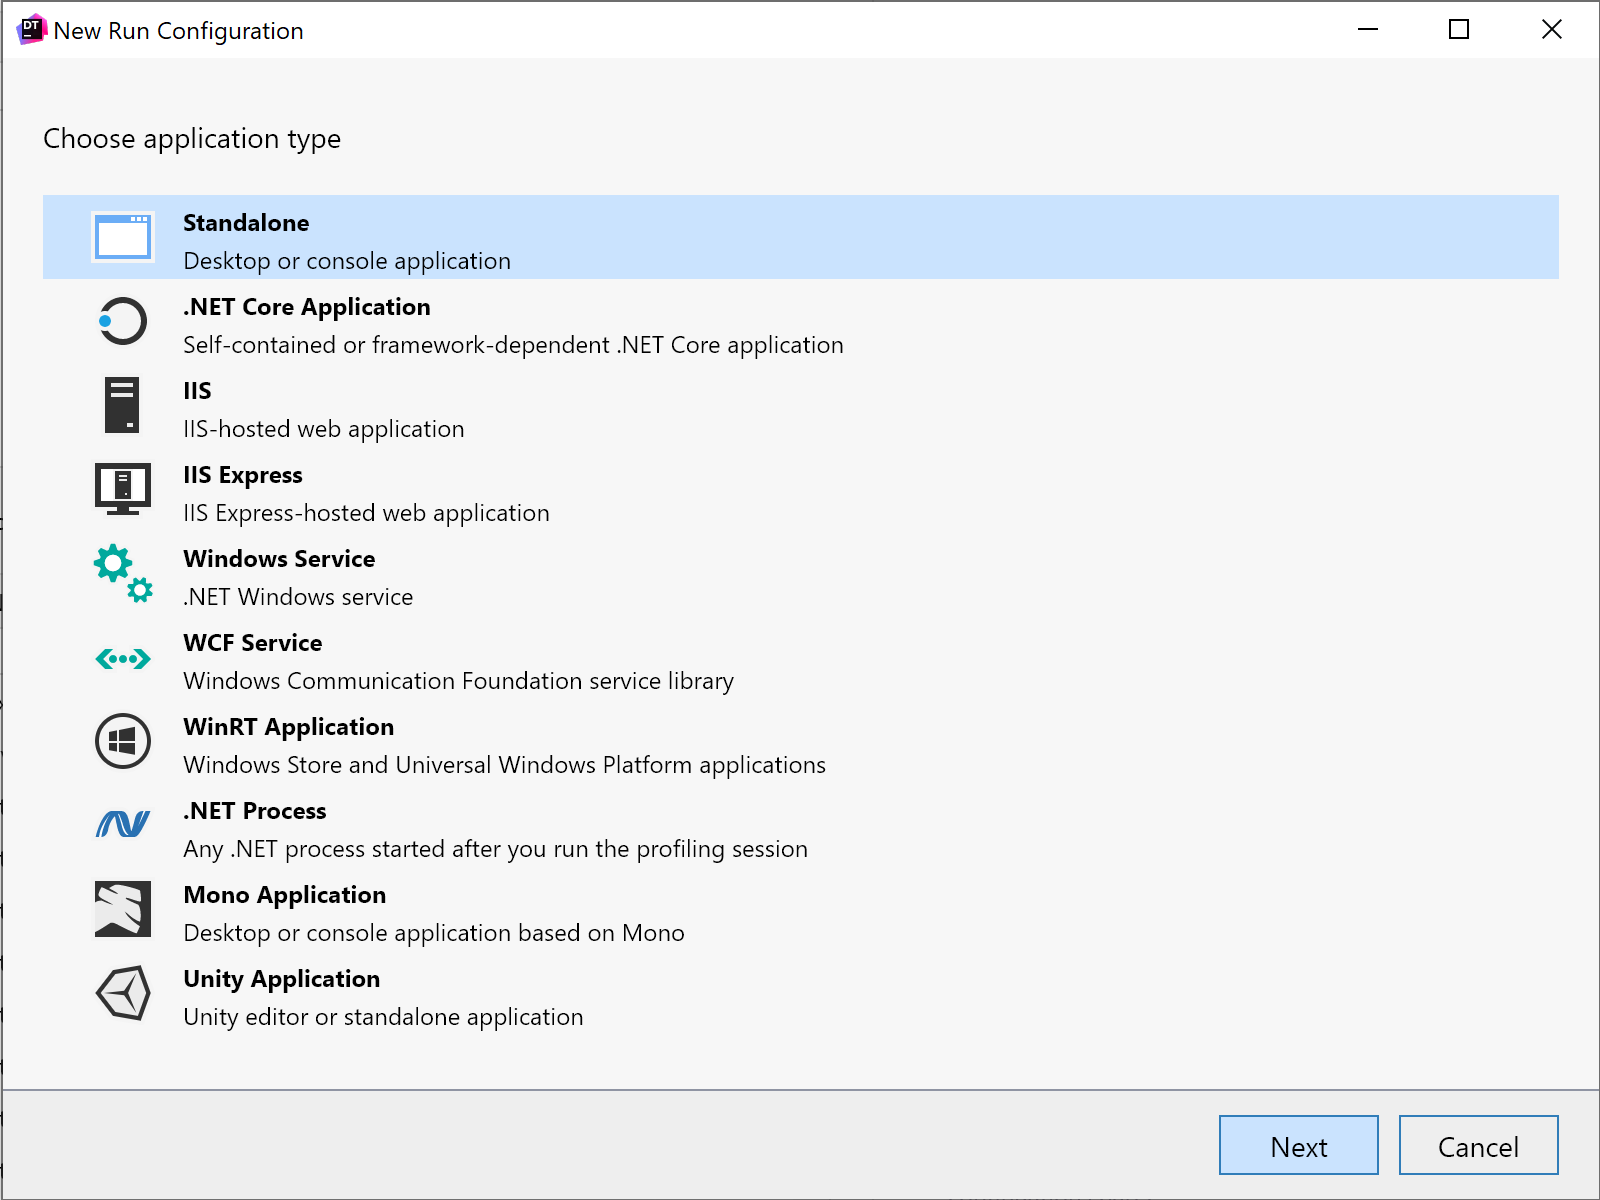
Let’s start by looking at the standalone dotTrace application. You can use the Home screen to add a new run configuration to launch a Standalone application, select Timeline (the only option that works with native apps), and hit Start.
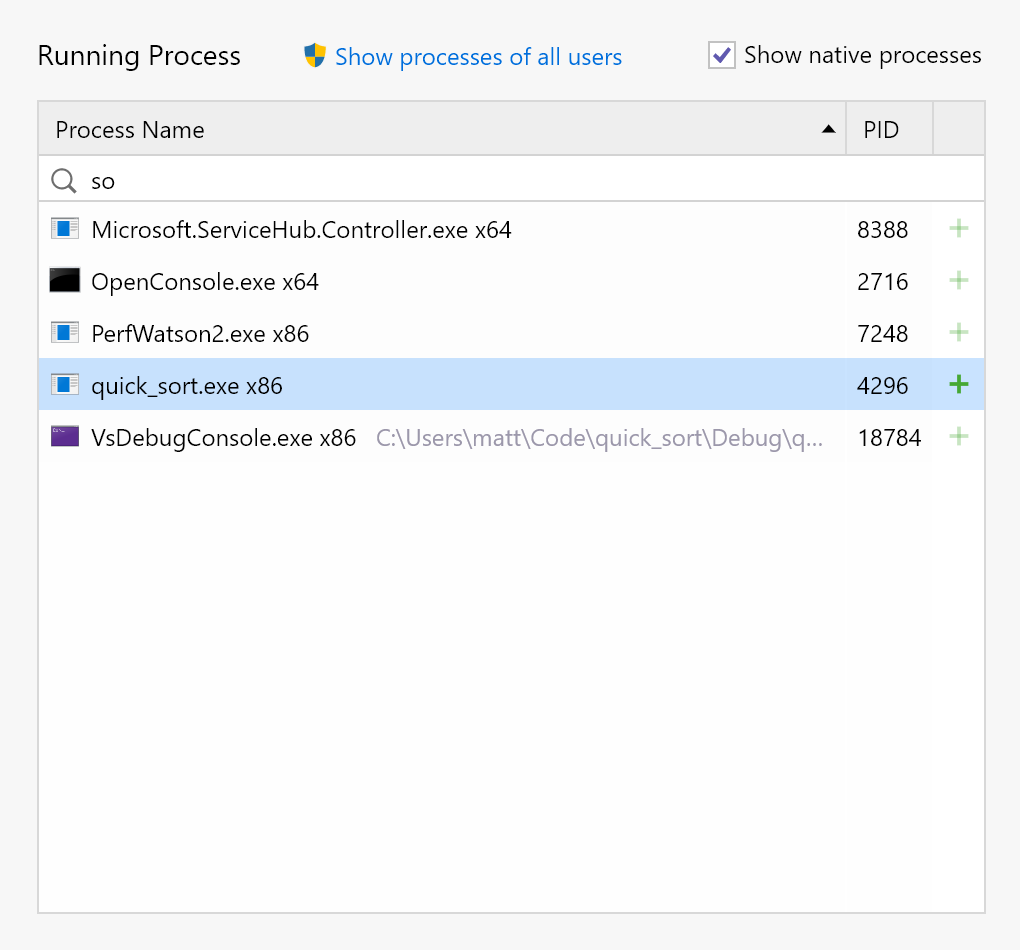
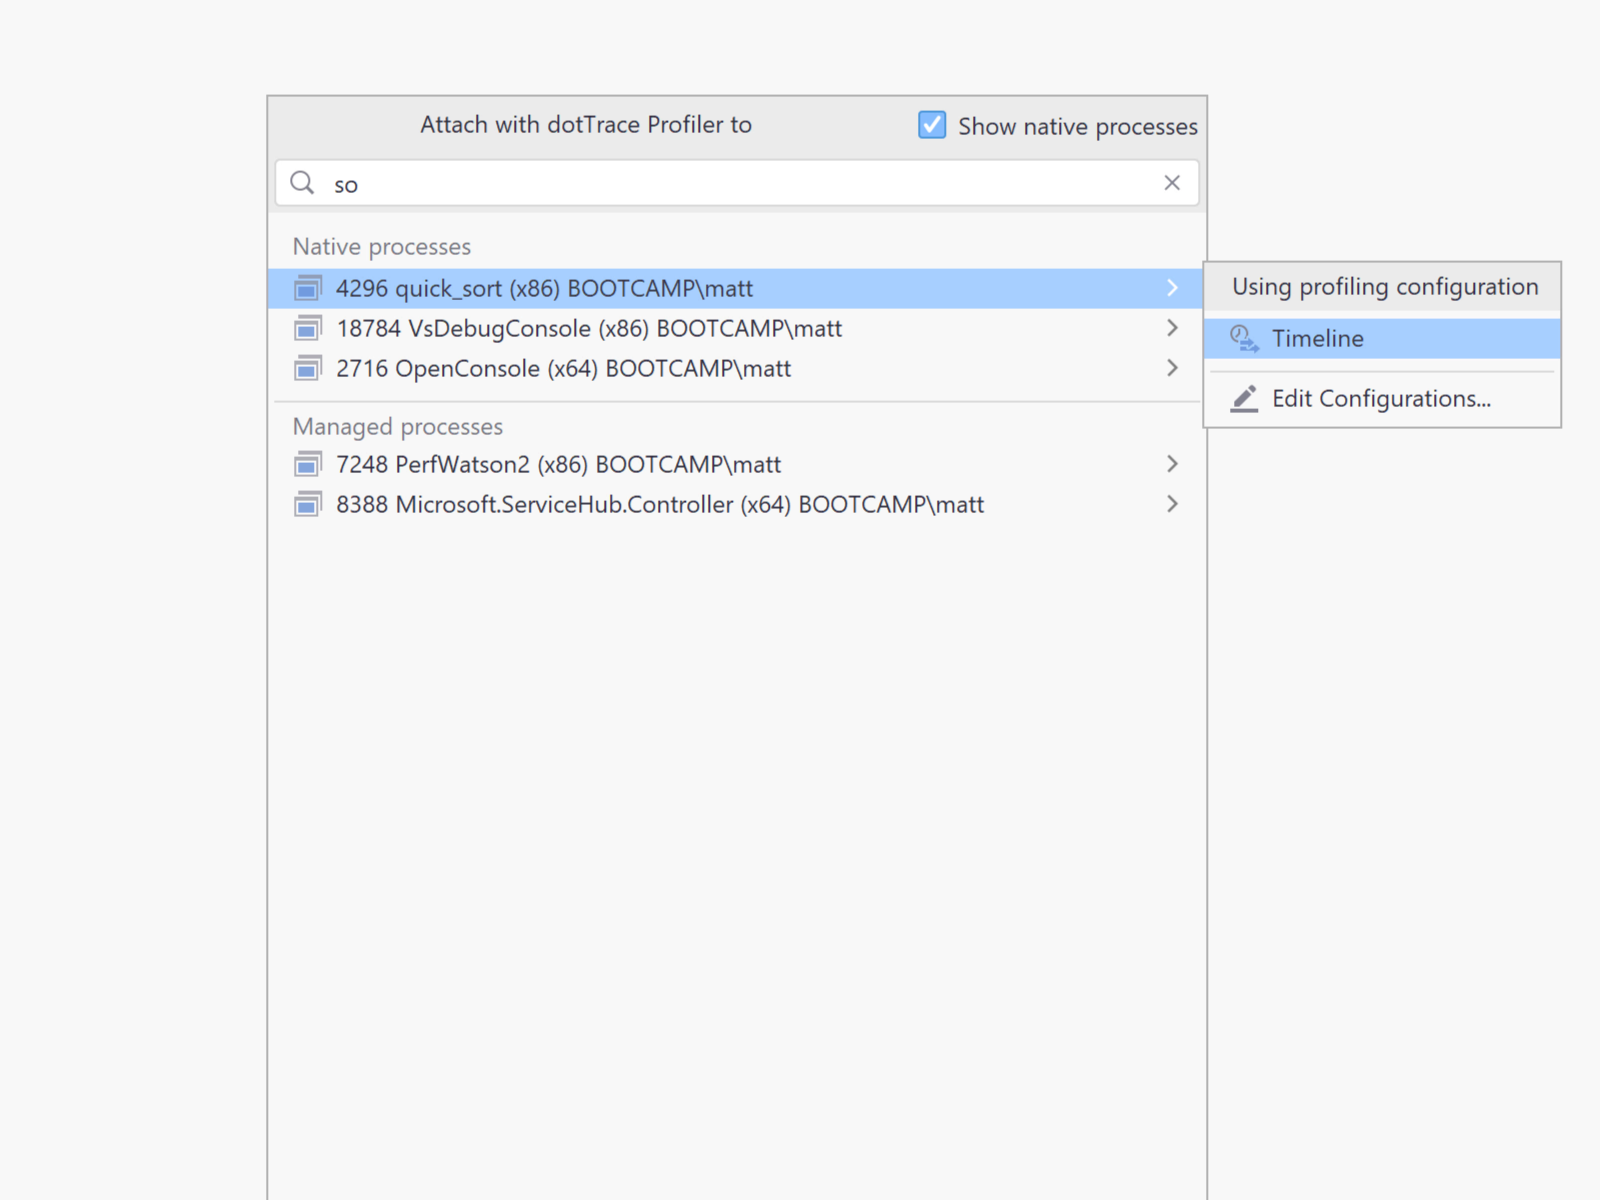
Alternatively, you can attach to a running native application, simply by selecting it from the process list. The list only shows managed processes by default, so make sure to check the “Show native processes” checkbox.
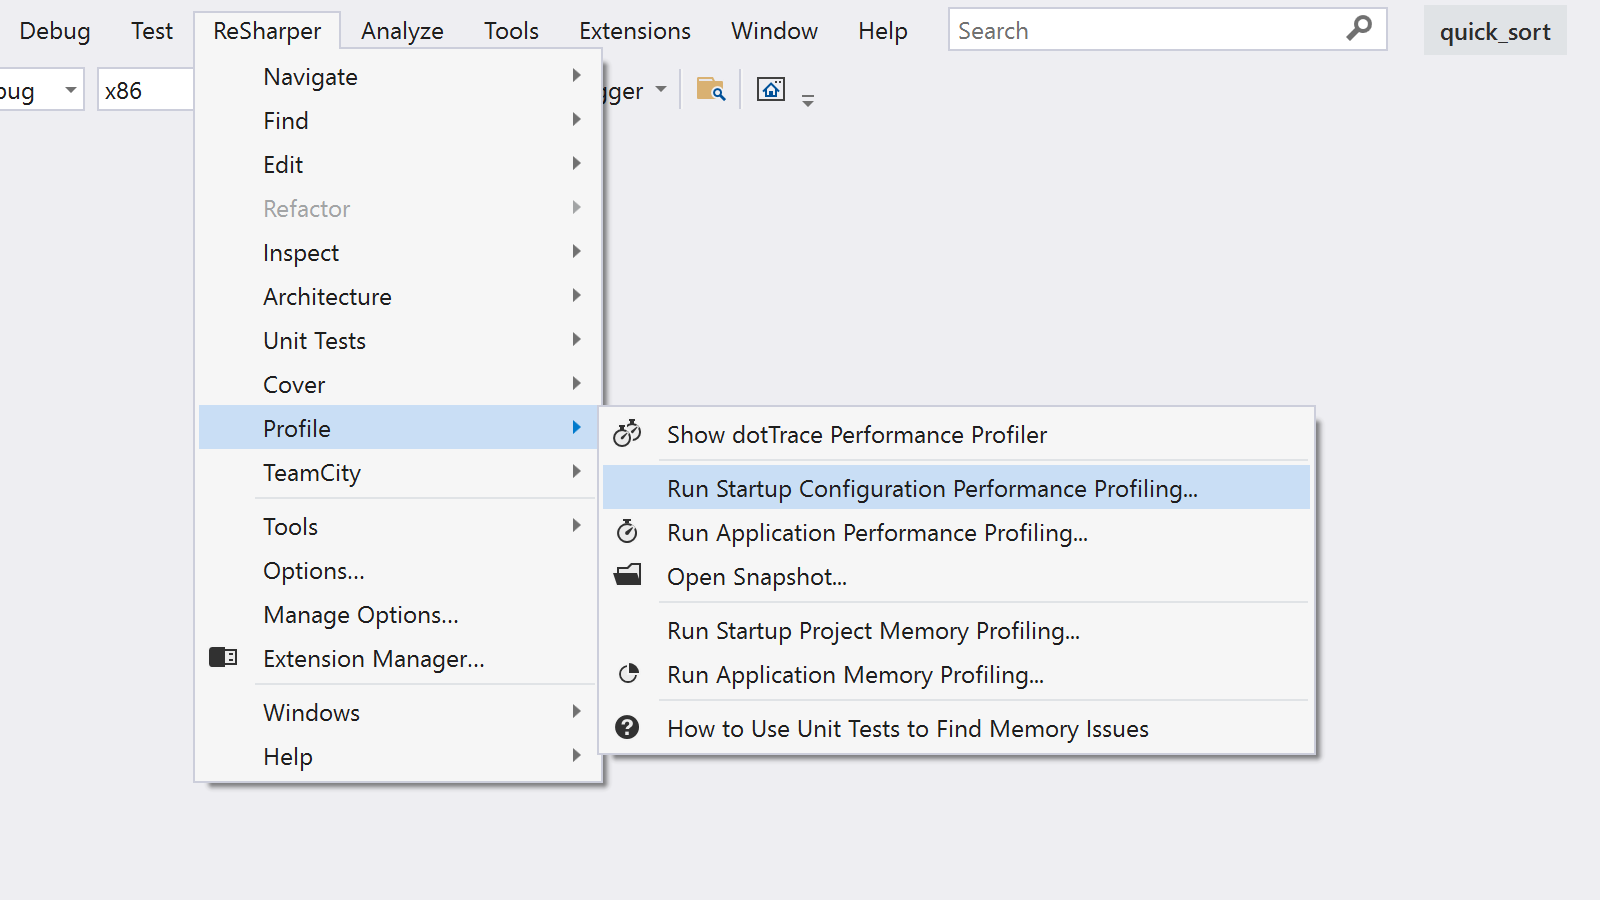
And that’s all there is to it! Well, almost. There’s some configuration that still needs to be done, but before we get to that, let’s take a quick look at profiling from Visual Studio/ReSharper and Rider. In Visual Studio, you can of course launch an arbitrary process from the Profile menu, but also, if you’re in a C/C++ project, we’ve made it easy to launch the startup run configuration in the profiler.
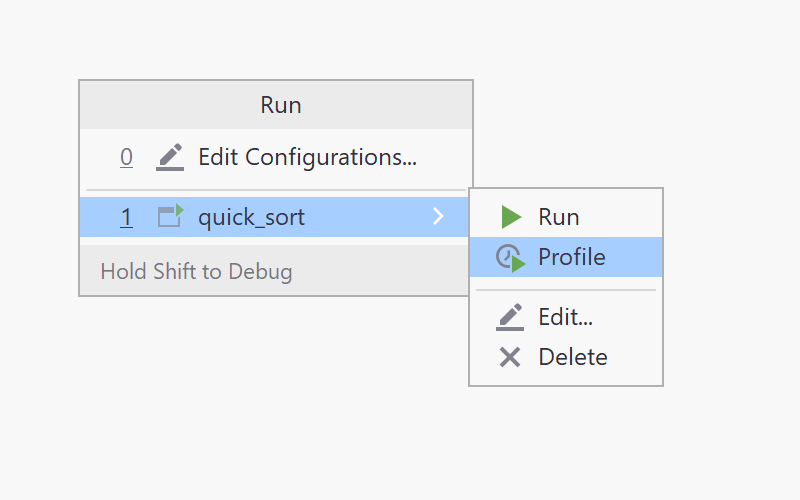
If you’re in Rider, you can now profile as well as run/debug the Native Executable run configuration type.
And Rider will let you attach the profiler to a running native process. Like the standalone Home screen, Rider will show managed processes by default, so simply click the “Show native processes” checkbox and start typing to find your application.
Loading symbols
When profiling a native application, there usually isn’t much information in the process itself about function or method names. This isn’t much of a problem for your own code – as long as you’re profiling a debug version of your application, the profiler can get symbols from the PDB files. But what about system and third party libraries?
Naturally, dotTrace has you covered here, and you can use the “Download symbol files” option to tell dotTrace to go and find the PDB files for you. By default, it will look at the source locations from the well known _NT_SYMBOL_PATH environment variable, so if you have this set up for working with other tools, dotTrace will be able to import the settings and get working.
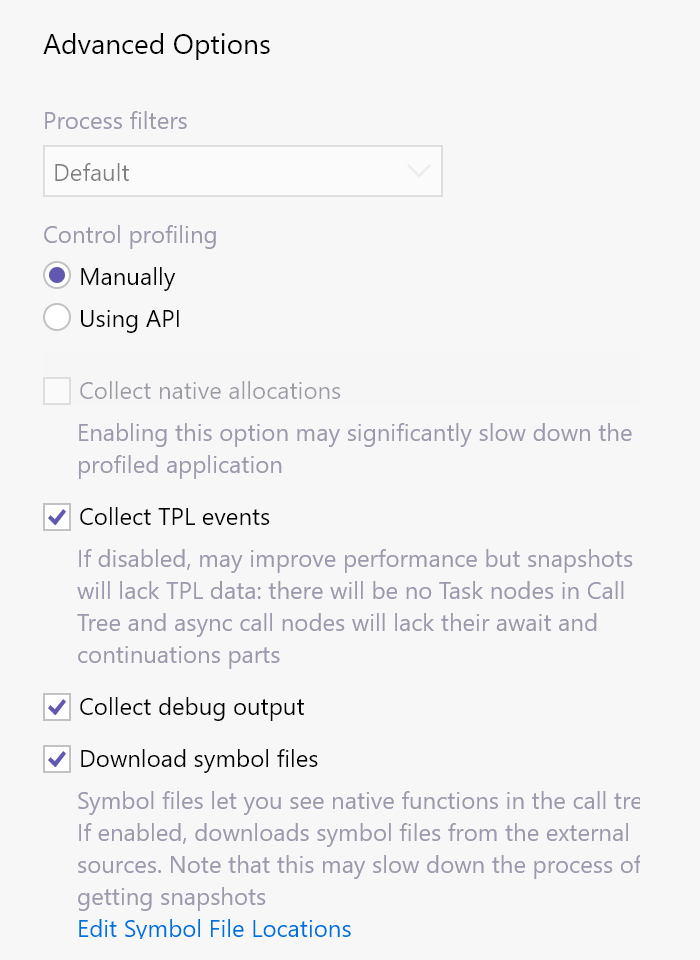
You can of course click the link and customise the settings, adding extra options – either a local path or a remote server location, with a local cache folder. If the symbols are downloaded from one of these remote locations, they will be automatically cached in the appropriate location.
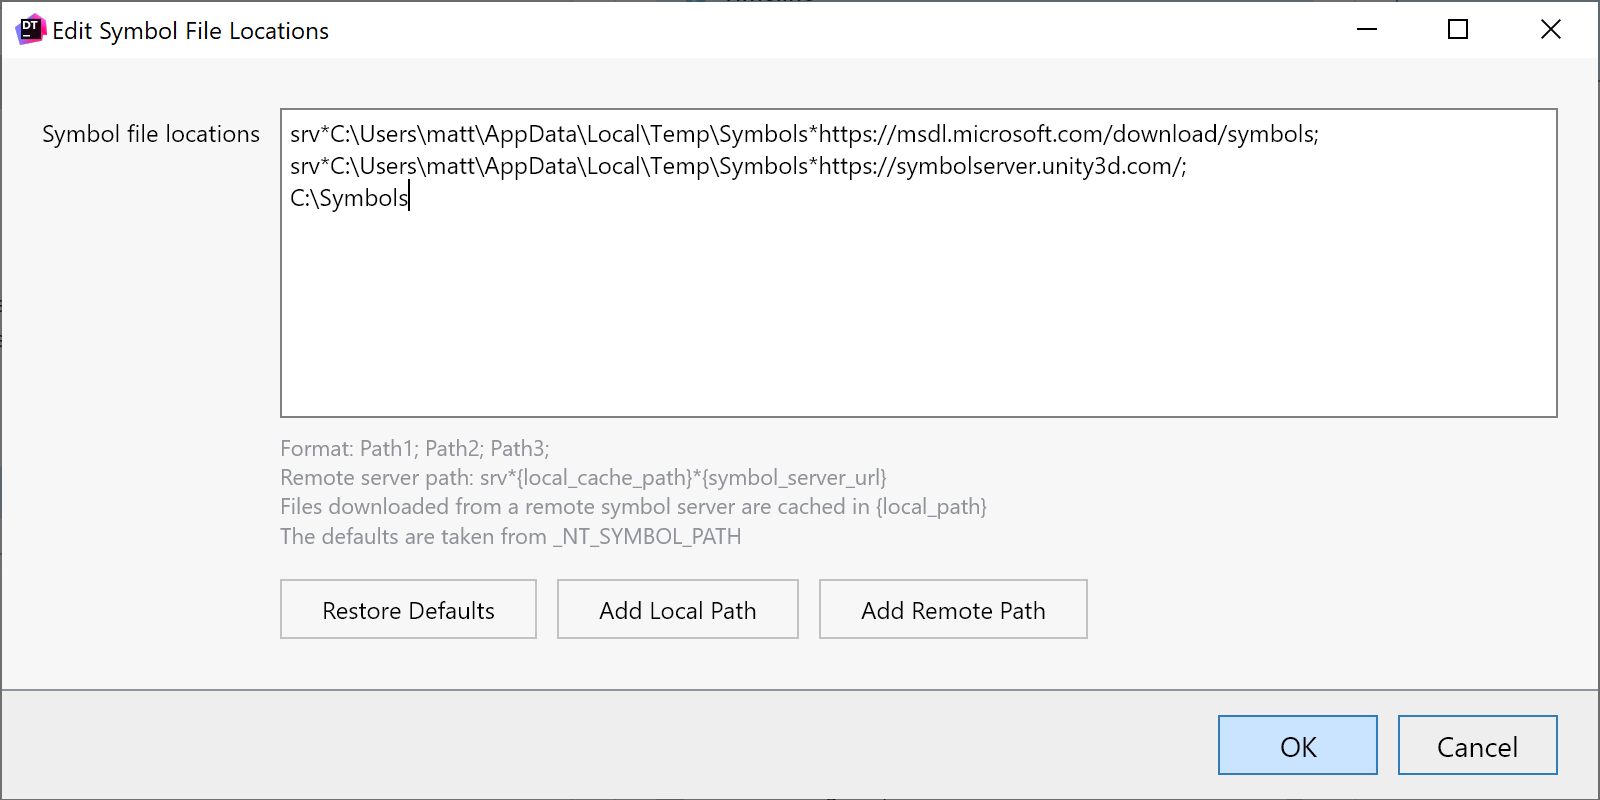
The PDB files are downloaded once the profiling session has finished, and you’ll see download progress while the results are being processed. It’s also worth noting that symbols can be downloaded for managed applications as well, including Mono and Unity.
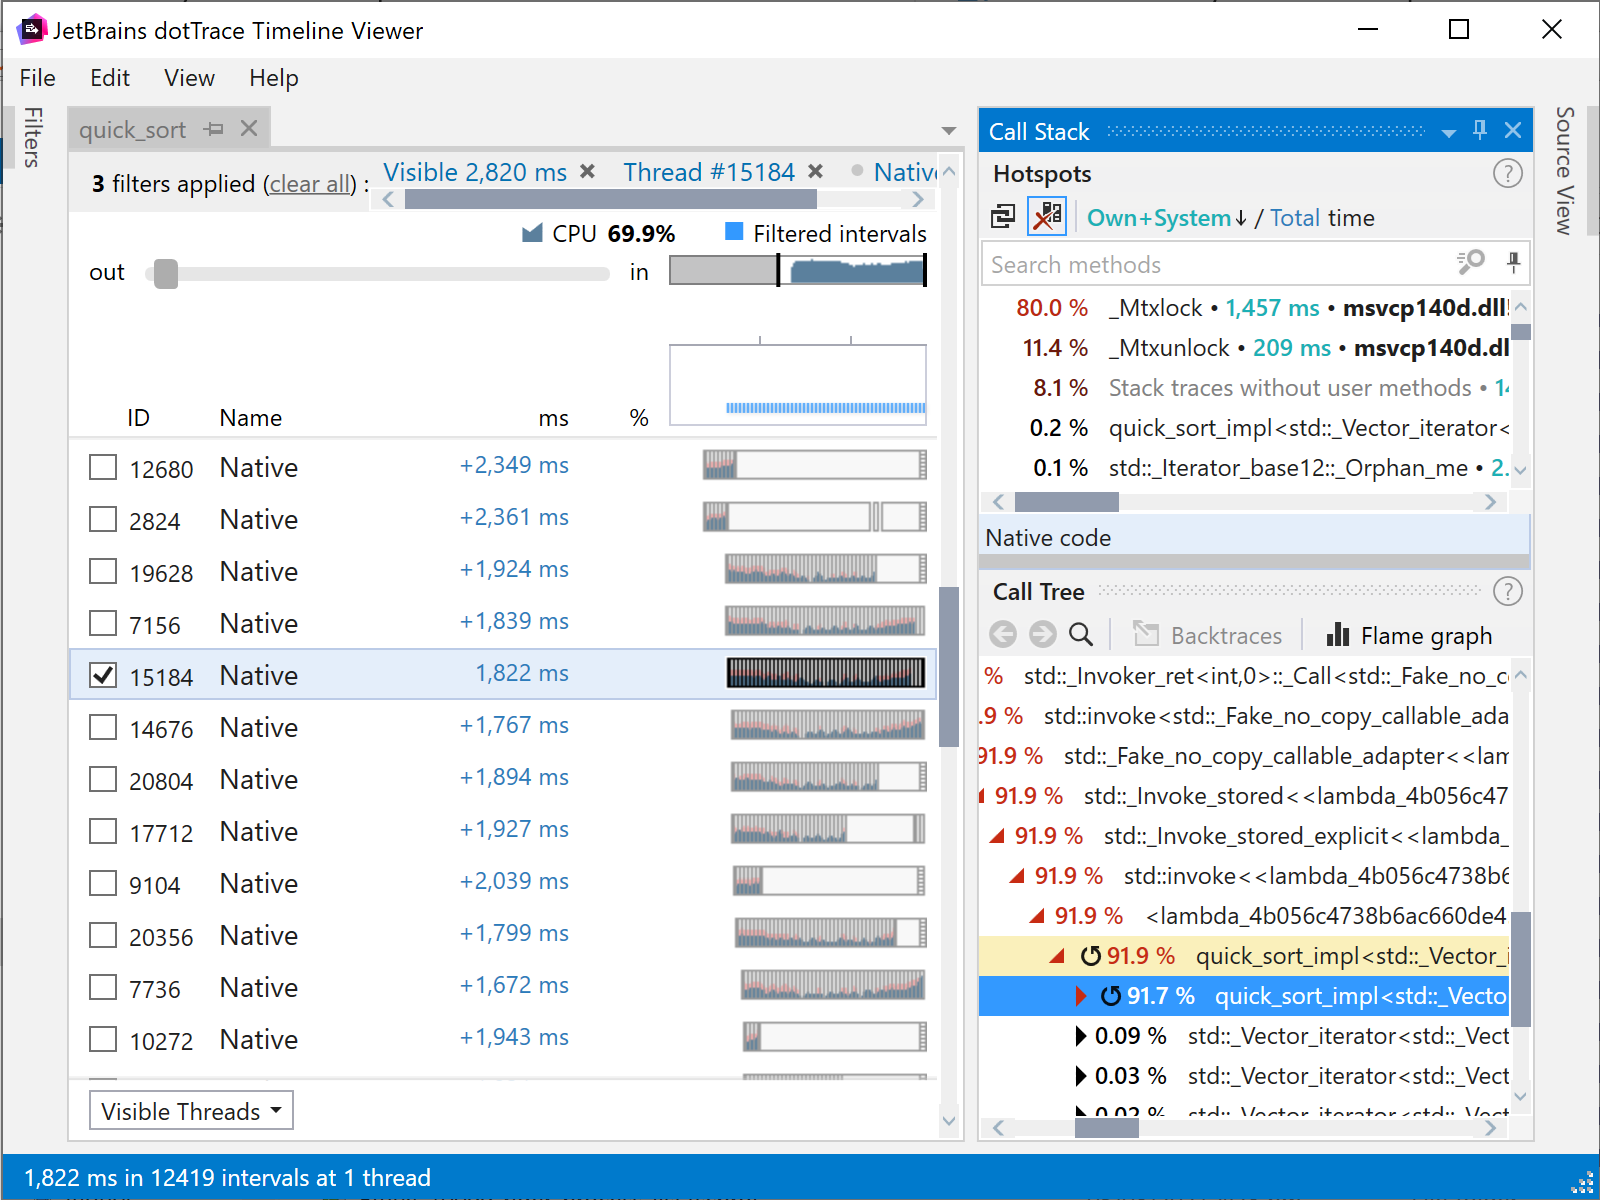
Viewing the results
Of course, once the application has been profiled, any PDBs loaded, then you need to view the results. For this, you can use the Timeline Viewer, just like it’s used for managed applications.
Native profiling is currently only available for Windows applications, as it requires profiling events that are only available under Windows.
Remember that dotTrace is available as part of the dotUltimate license, so a dotTrace license also includes Rider, ReSharper, ReSharper C++ as well the dotMemory profiler and dotCover for code coverage. That’s a lot of tooling in a single license! Go download a trial and give it a go!