.NET Tools
Essential productivity kit for .NET and game developers
Case Study – How the Profilers Uncover Critical Issues That Mimic Apps’ Normal Behavior

Today, we would like to share a few user stories about using the dotTrace performance profiler. We will tell you how a flaw was found in the new Intel CPUs’ architecture, as well as how to find application performance problems when testing in the conventional sense is impossible. We’ll also share some tips and tricks and explain why you should use profilers more often than you probably do.

Hi, Kevin! Could you briefly introduce yourself and tell us about the work activities you are mainly involved in?
I have been working as a staff engineer at Datadog for a bit more than a year now. There I work on Datadog Application Performance Monitoring. In the APM team, in particular, I’m responsible for the reliability and performance aspects. As such, I spend a good deal of time measuring the performance of the product and finding ways to improve it.
Before that, I worked for Criteo for five years. Criteo displays ads on the web and deals with a lot of traffic. There I was working on the SDK. Just like at Datadog, I spent a lot of time tracking performance issues in our services, and I used dotTrace a lot as part of the investigations.
Could you tell us the most memorable story of a time you encountered performance issues in your application? How did you find the problem and what steps were taken to troubleshoot it?
I have many stories, and here are just a few of them.
When I was working for Criteo, after a new release, we saw a new progressive increase of contention over a few days – back then, we used a tool that read performance counters and pushed the values to Graphite and then to Grafana dashboards. I was able to track down the problem easily using dotTrace. I proceeded by capturing a trace in the Timeline profiling mode using a remote agent right after the production server started, and then waiting until the next day and capturing a new trace. Then by enabling the Lock Contention filter, just visually it was really easy to see all the new contention events that weren’t there before. The contention was caused by the Fire method in the TimerQueueTimer class. I was able to isolate them with dotTrace directly, and from there, it was pretty easy to find the matching source code and understand where the leak was coming from.
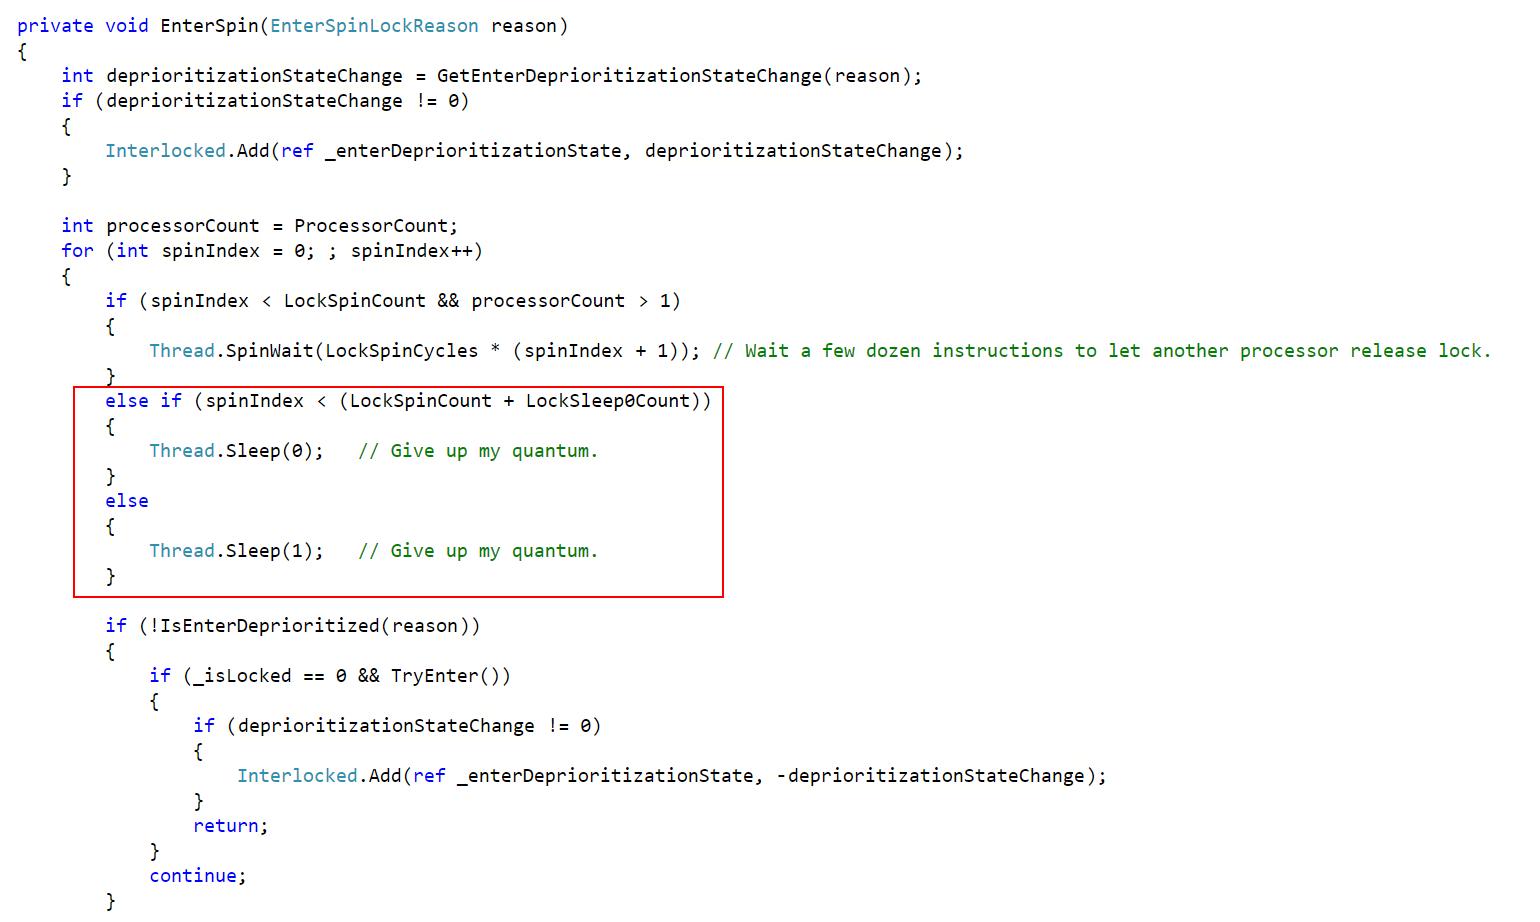
Another story is about when we had performance issues, but only on certain kinds of production servers. Again, after a new release, we had some parts of the code taking longer than expected, and it wasn’t obvious why. And again, I captured a trace with dotTrace. It was pretty clear, from comparing snapshots, that the synchronization primitive ReaderWriterLockSlim was taking far longer on some servers than others. By far longer, I mean about a 10x increase in the response time at the function level and 2x at the service level. From this point on, we were able to track it back to an issue that appeared with the then-new Intel CPUs. Because of that problem, Microsoft introduced a setting to change the spin count on the impacted CPUs. As an unfortunate side-effect, it reduced the total spinning time and caused the `Thread.Sleep(1)` fallback of the spinning logic to be hit, causing a 15ms pause in a normally sub-millisecond logic. We fixed the problem by just replacing ReaderWriterLockSlim with a simple Monitor. That was really an issue that would have been impossible to track down without the profiler
And here’s the last one, which is, I think, a good illustration of how useful the Timeline profiling is. One of the main services in Criteo is hosted on about 6000 servers. So that’s something we really wanted to optimize to reduce infrastructure costs. Something really weird was going on because it was processing requests fine up to, let’s say, 1000 requests per second. When you got above that threshold, the performance would drop in a dramatic way, even though the CPU was only at 50% or 60% usage. This had been going on for months or even for years before I decided to spend some time on it. I captured a trace with dotTrace when going above that mysterious threshold. And from the Timeline viewer I was able to see that there was one thread (this is a pretty big service with about 200 threads) that was using an entire CPU core 100% of the time. Every time this service received a request, it started a task in the background as Fire-and-Forget, and it was processed in a single-threaded queue. Initially, this worked fine, but as years passed by and we started installing better servers with more and more cores, suddenly, one thread wasn’t enough anymore. Since the server was more powerful, it was accepting more requests at a given time. That single thread in the background queue wasn’t enough to handle all those Fire-and-Forget tasks, and because of that, they kept piling up faster than they were processed. Eventually, there were too many references for the GC, putting pressure on it and ruining the service’s overall performance. So that threshold was basically the point when we were actually trying to enqueue more requests than the single thread was capable of processing. And so, by switching the consumer to use multiple threads instead of just one, we completely removed that threshold. The server was able to process about twice as many requests as before. That’s a good illustration of how useful Timeline profiling is: if you had profiled that service with a traditional profiler like PerfView, that single thread on a 32-core server would have been shown as using less than 5% of the total CPU. You wouldn’t notice it at all, even though this was the bottleneck of the application.
Well, that definitely sounds like a real investigation. But what about testing? Why wasn’t the problem detected while testing?
Well, there are two aspects to it. First, “detecting” the problem wasn’t the issue. For years we knew that the app couldn’t go above roughly 60% CPU usage; we just didn’t know why. But in general, Criteo uses production servers for testing at scale. I know it sounds scary at first, but it makes sense when you have all the data at hand. Criteo is an ad provider, and no user has ever complained because an ad failed to show while they were browsing a website. So losing some traffic had no reputational impact, only a financial one. Because of the scale (many services talking to each other, hosted on-premises on beefy servers, handling hundreds or thousands of requests per second) it was more cost-effective to sacrifice a bit of production traffic rather than set up and maintain a test environment.
Why did you decide to adopt dotTrace? What are the key benefits you get from using it?
Getting the trace is very straightforward, even on a remote server. You just drop the remote agent, connect to it from the UI, and then you can easily select when to start and stop the trace.
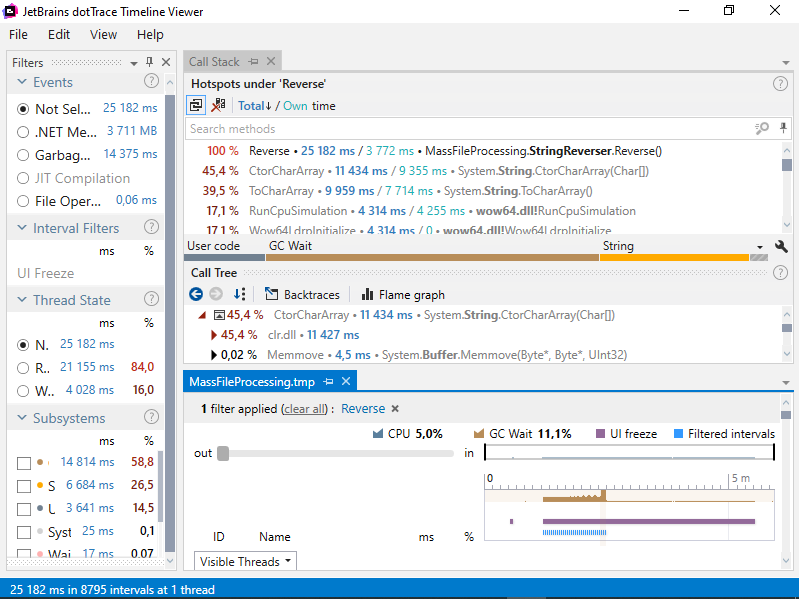
Another killer feature of dotTrace is Timeline profiling. It gives you a very synthetic view of what’s going on, even when dealing with very complex situations, so you can put them into perspective and get a better understanding of what’s happening. I also use Sampling, but less often. Timeline profiling is really my go-to feature in dotTrace. The overhead is low enough to be usable on most production servers.
Do you use command-line profiling tools to profile your apps on operating systems other than Windows?
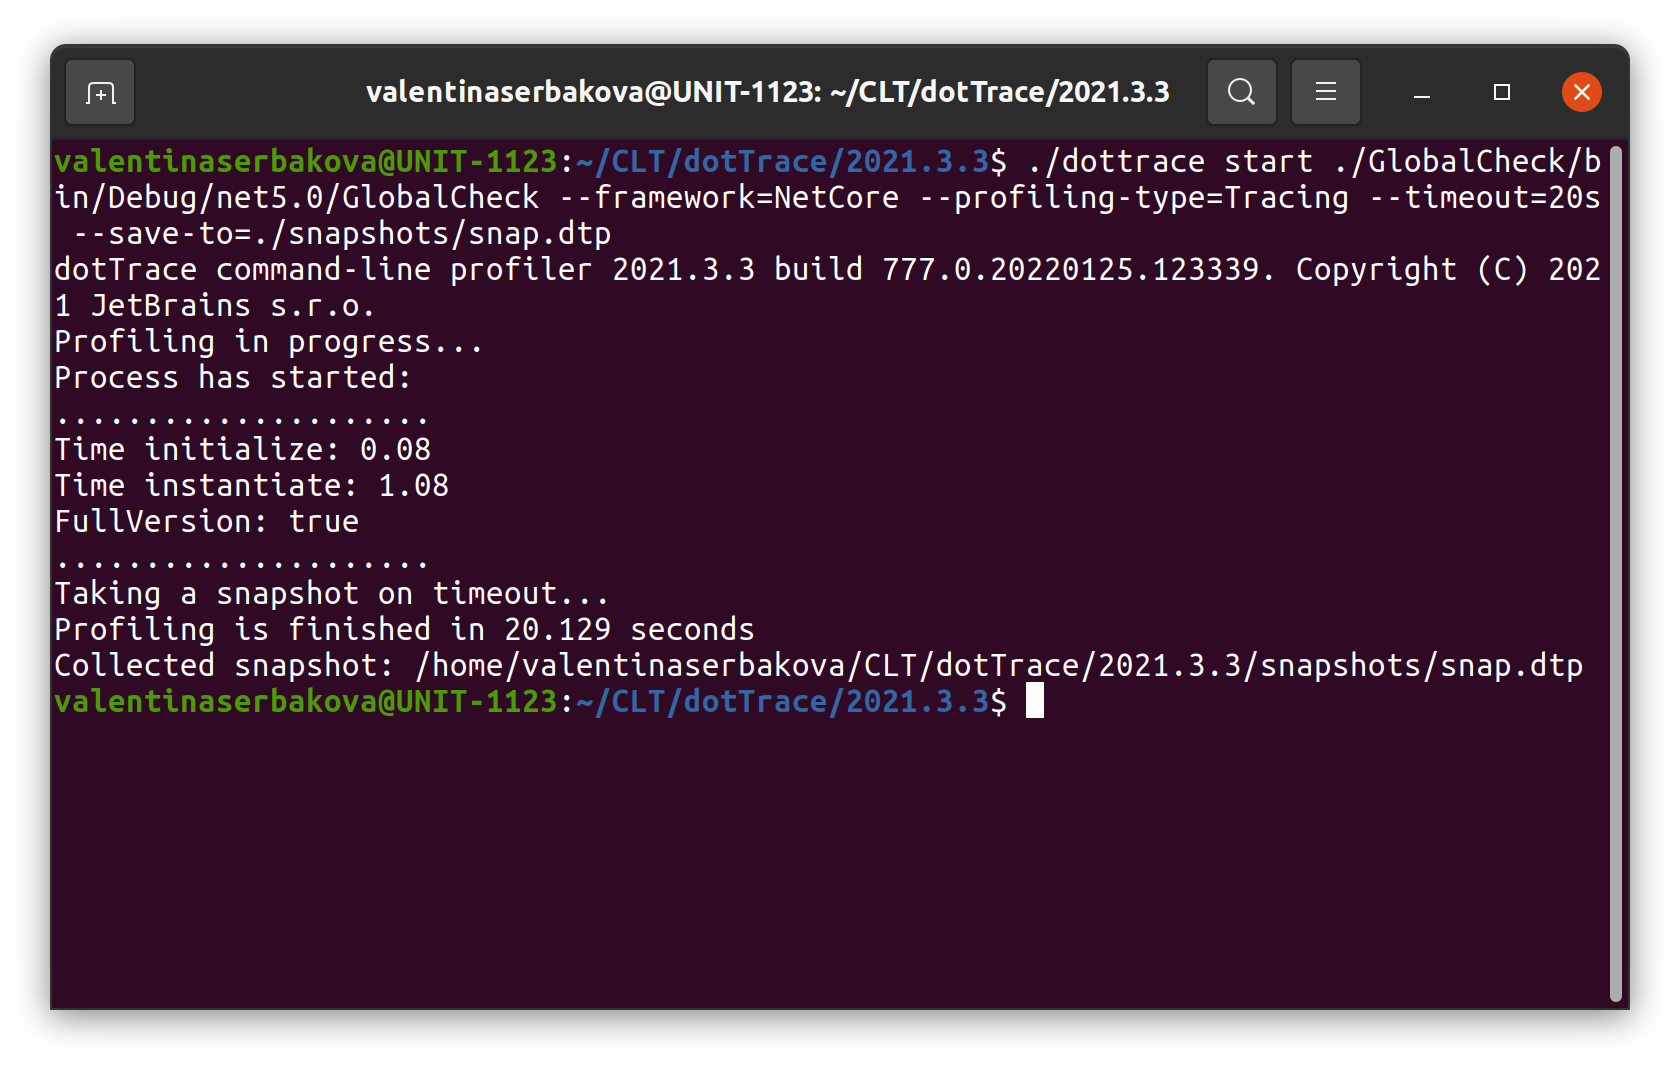
Yes. Not necessarily dotTrace, but yes. I’ve started to use command-line tools a bit. Quite often, I compare the performance of different versions of our products. And to understand what has changed, I need to capture traces in the exact same situation. For instance, I have a workbench where I start an application and need to capture traces for a very precise number of seconds. To automate this, I use a dotTrace command line, especially because it allows you to set a timeout and make sure that you have traces of the exact same length.
Has profiling always been an integral part of your development process? Do you remember your experience of getting started with dotTrace for the first time?
Yes, performance profiling has always been a part of my workflow. The first time I used it was in 2007. I was asked to find ways to optimize an application, so I just downloaded all the .NET profilers available back then. I tried them all. I decided to keep dotTrace because it was much easier to use, especially because it allowed me to very quickly notice a hot path in the application, which let me know what to focus on. The very first time I used dotTrace, it just worked.
Wow, next year will mark almost 15 years of you using dotTrace. That is quite impressive. Could you share some tips and tricks?
Tracing is a much cheaper profiling mode in dotTrace, but the results from Tracing mode are very inaccurate when it comes to execution time. And that’s by design. That’s how it works. It will give you indications about how many times a method is invoked, but not about how long it took. I didn’t understand that back then, and I used to always use the Tracing mode, simply because it gives more information. I thought, ”Why would I use a Sample mode?”. It was only later that I realized that some hotspots that Tracing viewer was showing me weren’t actually hotspots because of the overhead this profiling mode adds for every call. So if you need to optimize an app for CPU usage, then you should use Sampling or Timeline profiling instead of Tracing. That’s something that took me a few months or years to realize.
Do you remember any non-standard ways you’ve used the profiler during all your time working with it?
Back in the day, when I arrived in a new codebase, I liked to capture a profiling trace of the application because it shows you the application’s flow: what function is called and what it calls further, and so on. It gives you a good entry point into a codebase.
In what situations would you say it is necessary to use profiling tools to build high-quality software? How often should developers use them?
I would say, whenever you have a performance issue. I think that measuring should be the first step of any performance investigation. And so I always start by capturing a profiler trace. Well, I say “always”, but even I get bitten from time to time. I have an illustrative example of that.
There was this one debugger I used, and it was quite slow when trying to output a lot of text. So, I tried to see if I could optimize that. I was pretty sure that this was caused by the rendering of the text, so I wrote my own control to display text and replaced the native one. But I had zero performance gain. And that’s when I started profiling the application and found out that the bottleneck was somewhere else entirely.
We’d like to thank Kevin for taking part in this Q&A session.
Do you also optimize applications with dotTrace? We invite you to share your experience with us. If you are interested, please let us know by leaving a comment below or contacting us directly.