.NET Tools
Essential productivity kit for .NET and game developers
How We Used dotMemory to Optimize dotMemory
dotMemory is a .NET memory profiler by JetBrains. My name is Ilya and I help develop the tool.
I’d like to tell you a classical dogfooding story of how we optimized one of dotMemory’s algorithms by using our own tools – dotMemory and dotTrace. We then improved it some more using dotTrace, and finished off the optimization process by using BenchmarkDotNet.
I’d like to thank the authors of two articles, 1 and 2, which inspired me to share this story.
It all began when a colleague messaged me in Slack about a problem he was experiencing with the dominator tree in dotMemory. The data for that tree was taking too long to compute – so long, in fact, that his patience ran out before the process could complete. Thankfully, the problem was internal, so we collected a memory snapshot and began looking into it.
As soon as we reproduced the problem on a local machine, we saw that at some point memory use began growing rapidly at the speed of 1.17 GB per second, forcing the process to begin using a swap file. When that happens, it usually means you won’t receive your results in an adequate time frame. And so, the time had come to use dotMemory to fix a problem in dotMemory.
Once a process has completely exhausted physical memory, capturing a snapshot is no easy task. Even the operating system becomes unstable. That is why we decided to take the snapshot when memory use begins to grow quickly, but there’s still some physical memory left. The dotMemory console profiler was the best tool for the job:

This command launches dotMemory.UI.64.exe in profiling mode. It captures a snapshot as soon as the volume of “private bytes” reaches 20 GB, and after the profiling completes it opens the snapshot in dotMemory. In our case, we had to stop profiling manually (because otherwise we would have ended up swapping again). So we waited until we had enough data and then pressed Ctrl+C.
Now that we had a snapshot, we opened it in dotMemory. I began by analyzing the dominator tree – the one which my colleague couldn’t obtain, but which I managed to get in my snapshot:

As we see, memory is flooded with ~60 million CompactDominatorTreeNode+Builder objects, with each one containing a dictionary. It quickly became apparent that for most dictionaries, Size < Capacity, which meant lots of memory was being wasted.
We had to see what all those dictionaries were for – perhaps we didn’t need so many? I selected the CompactDominatorTreeNode+Builder node and navigated to its declaration (this can be done by using the context menu or by pressing Ctrl+L). This navigated me to my IDE (Rider) with the corresponding class opened. Running Find Usages brought me to the CompactDominatorTree.Build method, which contained the dominator tree compression algorithm.
A bit of background: first, dotMemory builds a dominator tree as follows. For each object, it searches for the object that exclusively retains it and saves this retaining object, or if there is none, saves a marker signifying the lack of such retaining object. This tree can potentially grow very large, and there is no point in showing it to the user “as is”. This is why dotMemory groups the tree nodes by object type at each level of the tree. CompactDominatorTreeNode+Builder represents a node of the compact (compressed) tree being built, and dictionaries are used to group the nodes by type.
The algorithm receives the tree in a “child → parent” format, meaning that each object is matched with its dominator parent. It sequentially traverses all the objects in the snapshot. For each object whose dominator parent hasn’t been processed yet, a new group node is created in the compact tree. The current node becomes a child in a group node (an existing one or a newly created one).
Using this method, the tree is traversed in an arbitrary order, and each node must store a dictionary that groups nodes by type. This isn’t a problem in most cases, because the compact tree is much smaller than the one containing all objects and there’s no significant memory overuse. But this particular snapshot happened to be a corner case, because even the compact tree was huge.
The question now was, “How can we use fewer dictionaries?” What if we had just one dictionary with a composite key? Unfortunately, this would force us to perform decomposition anyway, again resulting in either memory overuse or higher computational complexity. We had to think of something else.
We stood back and took a broader look at the problem. What if we used a different method to traverse the tree, such as breadth-first search? That approach looked promising. A single dictionary with a regular key could suffice. That way, each time we finished building a new level of the compact tree, we’d clear the dictionary so that we could reuse it in the next iteration.
There was a caveat, though: the “child → parent” format was not suitable for breadth-first search, as retrieving the children of a given node is too expensive computationally. We needed a different format for the input tree. Luckily, we already had a candidate: dotMemory was also capable of storing a dominator tree as a “parent → child” adjacency list. That meant we could change the algorithm to use breadth-first search without adding computational complexity.
We edited the algorithm accordingly and ran it. We saw memory use growing much slower than before – just 7 MB per second instead of the previous 1.17 GB per second, but the process still failed to make it to the end and again began using a swap file.
All right, back to the drawing board. We captured another snapshot and opened it. The new dominator tree looked like this:

This time the compact tree alone occupied 16 GB. Was this a reasonable size? Perhaps we could store the tree in a more economical way still?
We grouped the nodes by type to find out how many nodes we had:
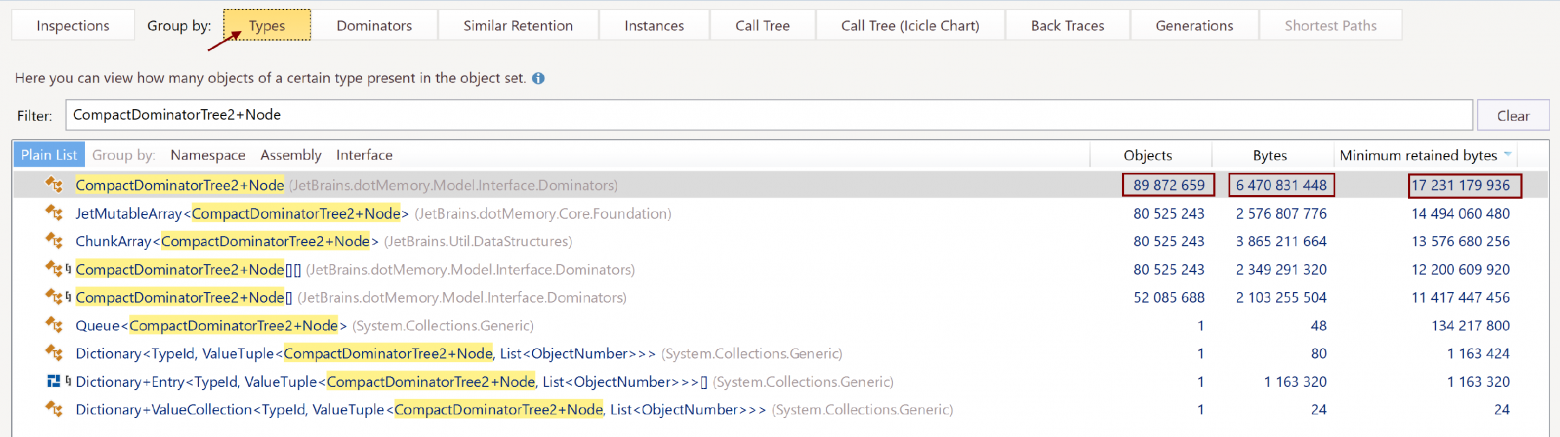
The tree’s 90 million nodes occupied just 6 GB, out of the total size of 16 GB. This seemed suspicious. We navigated to the code for the CompactDominatorTree2+Node declaration:
public sealed class Node
{
  public DfsNumber DfsNumber { get; }      // 8 bytes
  public TypeId ObjectsType { get; }       // 4 bytes
  public int ObjectsCount { get; }         // 4 bytes
  public int RetainedObjectsCount { get; } // 4 bytes
  public ulong RetainedBytes { get; }      // 8 bytes
  public bool IsContainedInSet { get; }    // 1 byte

  public Node Parent { get; }              // 8 bytes
  internal JetArray<Node> ChildrenImpl { get; } // 8 bytes

  // we have omitted unnecessary details
}
The payload here was just 45 bytes, but together with the header and alignment, a Node object took up 72 bytes. And it retained a lot more – 192 bytes on average. To check out the details, we switched to the Instances tab and filtered the contents by using the query “CompactDominatorTree2+Node !g !a” (“!g” excludes generics and “!a” excludes arrays). Here’s what a random instance looked like:

The details of the instance:

Well, isn’t that a lot of overhead?
Now we could see clearly that JetMutableArray was not the most efficient way to store child nodes for a large tree. The first solution that came to our minds was, of course, to optimize the way we stored child nodes. For example, we could store them in a standard array. But we decided to take a more radical path.
Large data structures are a common thing in dotMemory. For example, an object graph is stored as an adjacency list, using two arrays of structs that reference each other through integer array indices. This is interesting given that at dotMemory, we had just stopped using managed arrays and moved to our own implementation based on memory-mapped files. This had helped us achieve minimum overhead when accessing elements (native memory indexing the way it’s done in good old C), as well as a quick way to load and save the array (fully on OS level), and no overhead when serializing/deserializing. What is more, fragments of such arrays could be unloaded from memory even without our involvement, helping us free up physical memory while traversing the array (more or less) sequentially.
We decided to apply the same approach to the compact dominator tree. We also turned the IsContainedInSet attribute into a bit flag, and we got rid of the Parent property which wasn’t being used anyway. Finally, we ended up with the following structure for the tree node:
[StructLayout(LayoutKind.Sequential, Pack = 4)]
public readonly struct Node
{
  public readonly TypeId ObjectsType;

  private readonly uint _objectsCount;
  public int ObjectsCount => (int)(_objectsCount & 0x7FFFFFFF);
  public bool IsContainedInSet => (_objectsCount & 0x80000000) != 0;

  public readonly int RetainedObjectsCount;
  public readonly ulong RetainedBytes;
  public readonly DfsNumber DfsEnter;

  public readonly Range<uint> Children;
}

It’s worth noting that, with such a sequential representation, we could even do with just one integer link pointing to the child node. But instead, we used a range that allowed us to sort child nodes of the built tree by RetainedBytes in ascending order and then helped us build a sunburst diagram. For the representation shown above, the order of nodes #1, #2, and #3 may change.
Holding our breath, we ran the program. Bingo! Memory use peaked at just 12 GB. The dominator tree was built successfully, taking 55 minutes – still longer than we wanted, but acceptable. The snapshot now contained a total of 275 million objects, and the compact tree included 200 million nodes.
This is a good result by any measure. We started out unable to get the size to under 32 GB, with computation taking forever, and now it was down to 12 GB and ready in 55 minutes. Still, we had that nagging feeling that we could do even better. 55 minutes is far from ideal. We decided to see what exactly was taking all that time. Enter dotTrace:

The good thing is we didn’t need to wait for the process to finish – recording performance for several minutes was quite enough. We used the ‘--timeout=3m‘ key to automatically stop profiling after 3 minutes. We opened the snapshot and applied filtering to identify the thread that was performing our task – it’s the one that remains fully loaded for a long time. Here’s the call tree:

Shockingly, 92% of the time was apparently hogged by Dictionary.Clear! We could hardly believe our eyes. How could Clear perform so poorly on a standard library dictionary? The catch, as it turned out, was the dictionary had swollen to an enormous 22K elements during the first iteration of the algorithm, even though the following iterations normally involved just a few dozen elements. The computational complexity of Dictionary.Clear is proportional to Capacity (not Count), particularly to buckets.Length, which depends linearly on Capacity. This meant we just kept clearing elements that were empty to begin with! It turned out we optimized the model a little too much when we chose to clear and reuse the dictionary.
Taking another step back, we now tried the most straightforward way – creating a new dictionary for every iteration. We started the stopwatch again and ran the code, tingling with anticipation. Whoa! 1 minute 46 seconds is all it took! The load on the GC went up, but it was evenly distributed and managed just fine, a fact we verified using dotTrace.
That’s it. We processed 275 million objects in less than 2 minutes with memory use peaking at just 12 GB. Now we were happy – and finally ready to commit our optimized code to the repo!
Later on, just as an icing on the cake, we decided to do one more test. We ran the old and the new algorithms on a different snapshot to compare their performance. We found a snapshot that had the same size but a different topology, so that the old algorithm could also stomach it, and fed it to both algorithms. To our utter surprise, our new algorithm ran 33% slower than the old one, even though the computational complexity stayed the same. But that’s another story, to be told another time. If you are interested, please let us know by leaving a comment below or contacting us directly!